| Param | Original file | Final file |
|---|---|---|
| Filename | modeM0/AS1A05_185T04_9000002548_17211cztM0_level2.evt | modeM0/AS1A05_185T04_9000002548_17211cztM0_level2_quad_clean.evt |
| Size (bytes) | 444,816,000 | 89,153,280 |
| Size | 424.2 MB | 85.0 MB |
| Events in quadrant A | 2,972,902 | 583,005 |
| Events in quadrant B | 3,145,371 | 591,700 |
| Events in quadrant C | 3,520,339 | 556,334 |
| Events in quadrant D | 3,412,745 | 537,490 |
| Mode SS | |||
|---|---|---|---|
| Quadrant | BADHDUFLAG | Total packets | Discarded packets |
| A | 0 | 126 | 0 |
| B | 0 | 126 | 0 |
| C | 0 | 126 | 0 |
| D | 0 | 126 | 0 |
| Mode M9 | |||
|---|---|---|---|
| Quadrant | BADHDUFLAG | Total packets | Discarded packets |
| A | 0 | 24 | 0 |
| B | 0 | 25 | 0 |
| C | 0 | 25 | 0 |
| D | 0 | 25 | 0 |
| Mode M0 | |||
|---|---|---|---|
| Quadrant | BADHDUFLAG | Total packets | Discarded packets |
| A | 0 | 12818 | 2 |
| B | 0 | 13300 | 2 |
| C | 0 | 14300 | 2 |
| D | 0 | 14433 | 2 |
| Quadrant | Total seconds | Saturated seconds | Saturation percentage |
|---|---|---|---|
| A | 6179 | 14 | 0.226574% |
| B | 6179 | 22 | 0.356045% |
| C | 6179 | 56 | 0.906296% |
| D | 6179 | 135 | 2.184820% |
Noise dominated data is calculated using 1-second bins in cleaned event files. If a bin has >2000 counts, and if more than 50% of those come from <1% of pixels, then it is considered to be noise-dominated and hence unusable.
| Quadrant | # 1 sec bins | Bins with >0 counts | Bins with >2000 counts | High rate bins dominated by noise | Noise dominated (total time) | Noise dominated (detector-on time) | Marked lightcurve |
|---|---|---|---|---|---|---|---|
| A | 7484 | 6180 | 0 | 0 | 0.00% | 0.00% | 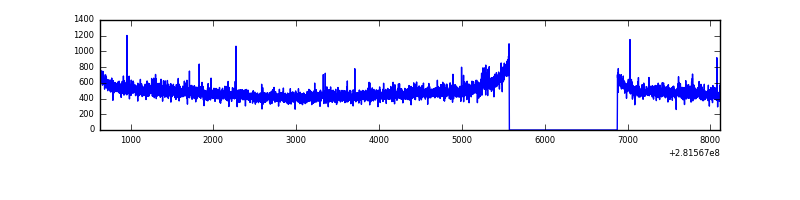 |
| B | 7484 | 6180 | 2 | 2 | 0.03% | 0.03% | 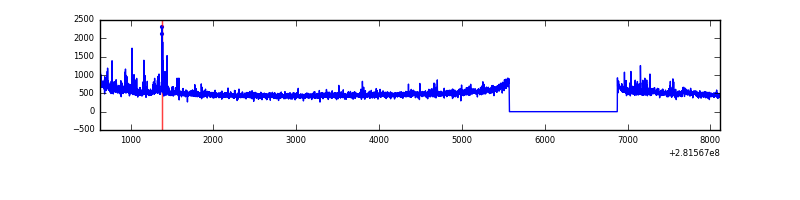 |
| C | 7484 | 6180 | 0 | 0 | 0.00% | 0.00% | 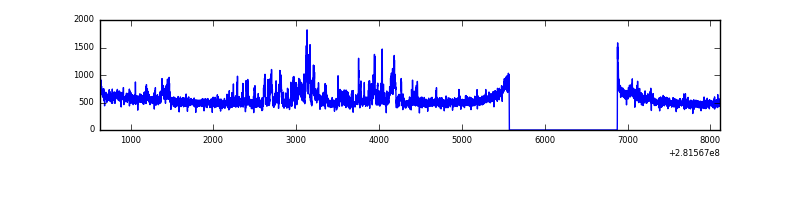 |
| D | 7484 | 6180 | 87 | 87 | 1.16% | 1.41% | 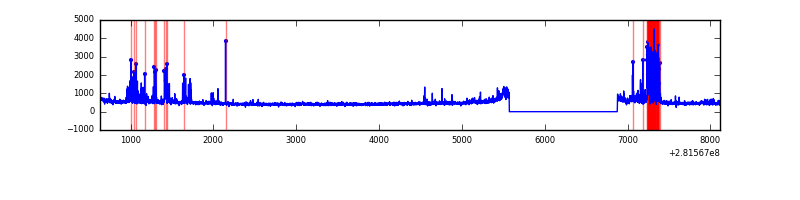 |
Top three noisy pixels from each quadrant. If the there are fewer than three noisy pixels in the level2.evt file, extra rows are filled as -1
| Pixel properties | Quadrant properties | ||||||
|---|---|---|---|---|---|---|---|
| Quadrant | DetID | PixID | Counts | Sigma | Mean | Median | Sigma |
| A | 12 | 189 | 34347 | 218.81 | 764 | 749 | 153.5 |
| A | 0 | 226 | 6893 | 40.01 | 764 | 749 | 153.5 |
| A | 12 | 194 | 5745 | 32.54 | 764 | 749 | 153.5 |
| B | 0 | 197 | 43040 | 292.55 | 768 | 748 | 144.6 |
| B | 6 | 36 | 37703 | 255.64 | 768 | 748 | 144.6 |
| B | 0 | 189 | 20366 | 135.71 | 768 | 748 | 144.6 |
| C | 3 | 233 | 525165 | 3060.1 | 737 | 744 | 171.4 |
| C | 14 | 238 | 114863 | 665.91 | 737 | 744 | 171.4 |
| C | 13 | 61 | 5169 | 25.82 | 737 | 744 | 171.4 |
| D | 5 | 222 | 551071 | 3090.45 | 737 | 717 | 178.1 |
| D | 12 | 110 | 28195 | 154.3 | 737 | 717 | 178.1 |
| D | 2 | 234 | 27826 | 152.23 | 737 | 717 | 178.1 |
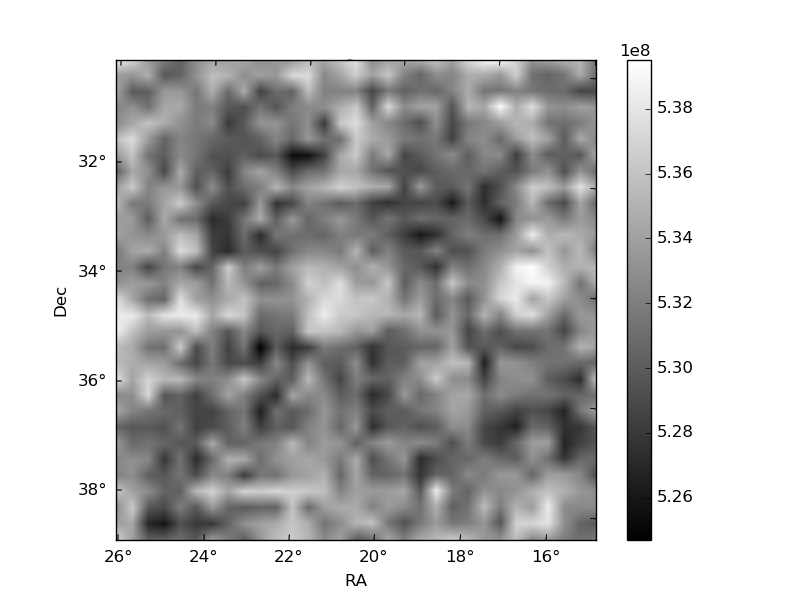
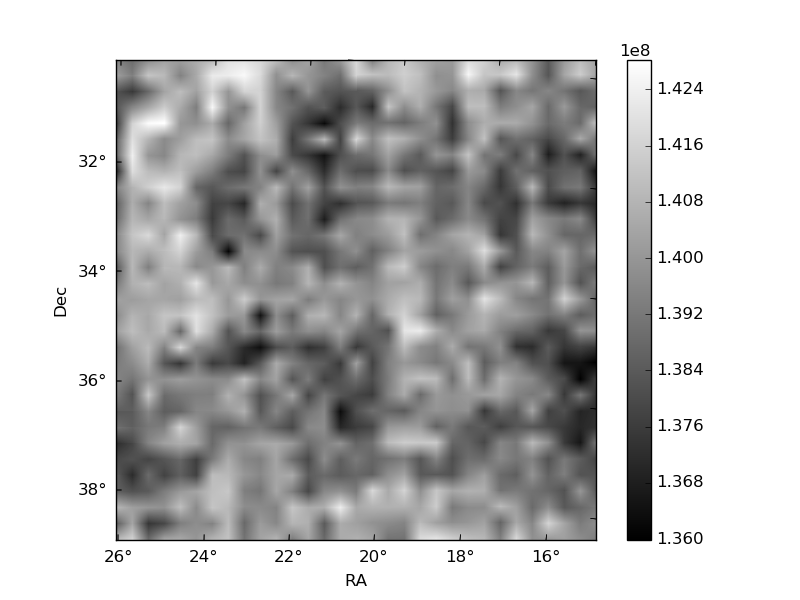
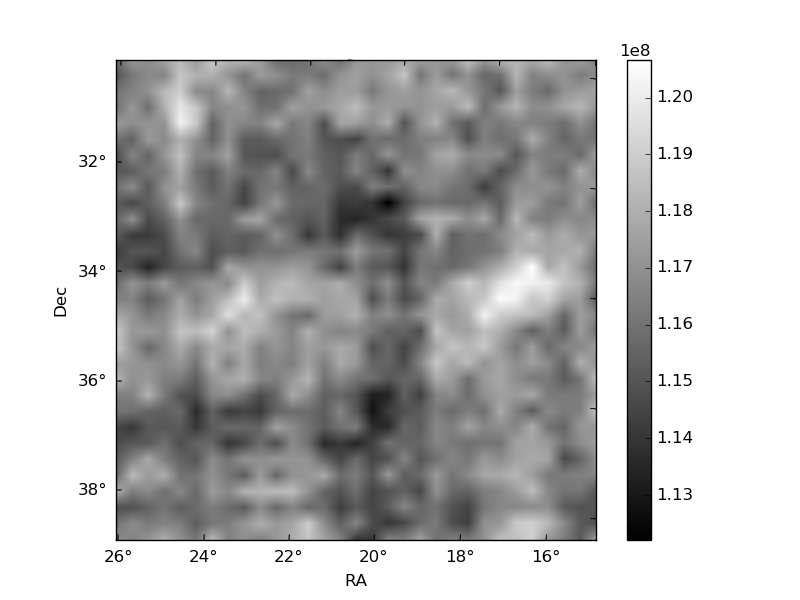
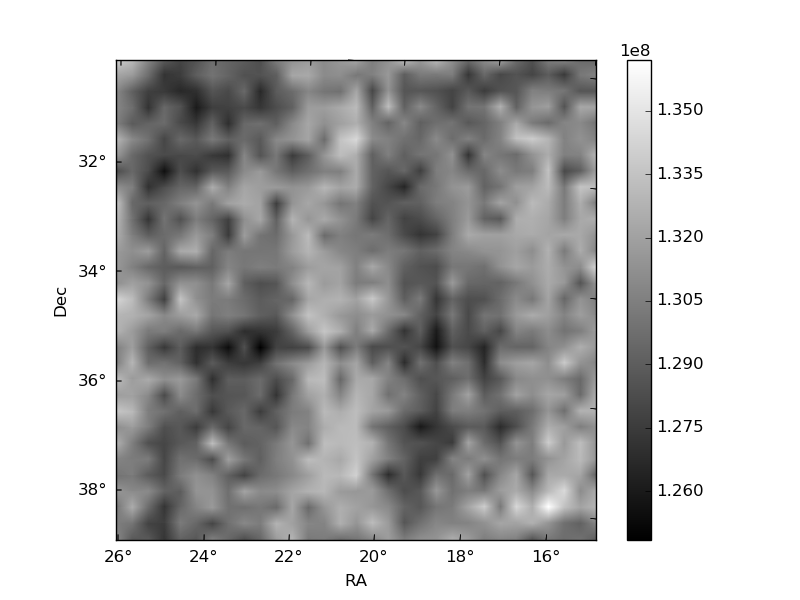
Histogram calculated using DETX and DETY for each event in the final _common_clean file
| Quadrant A | 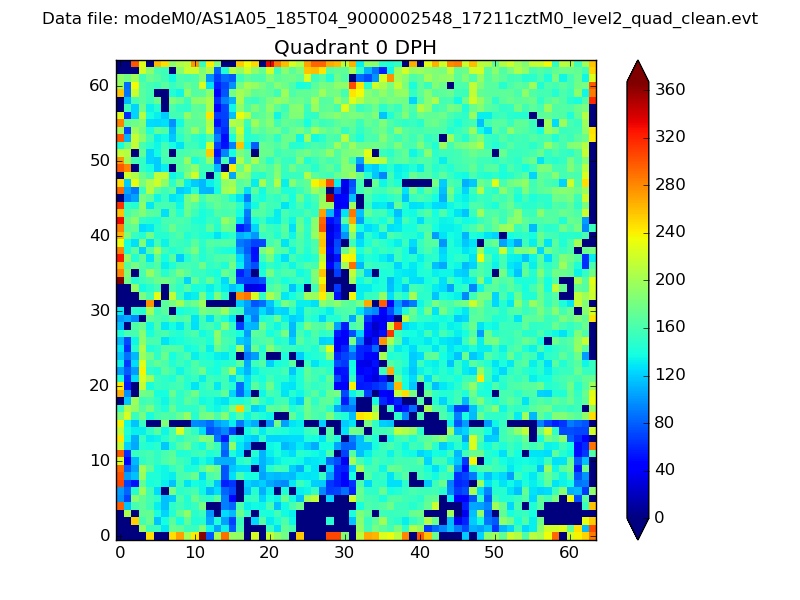 |
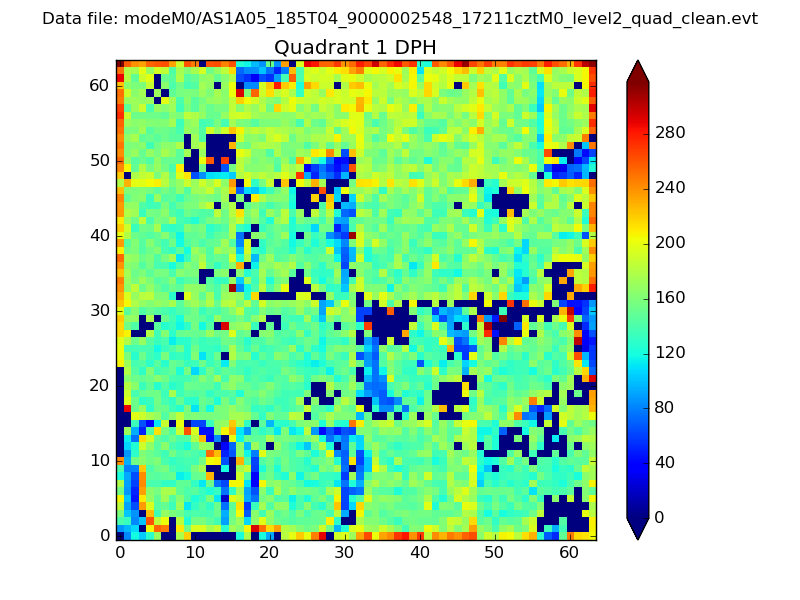 |
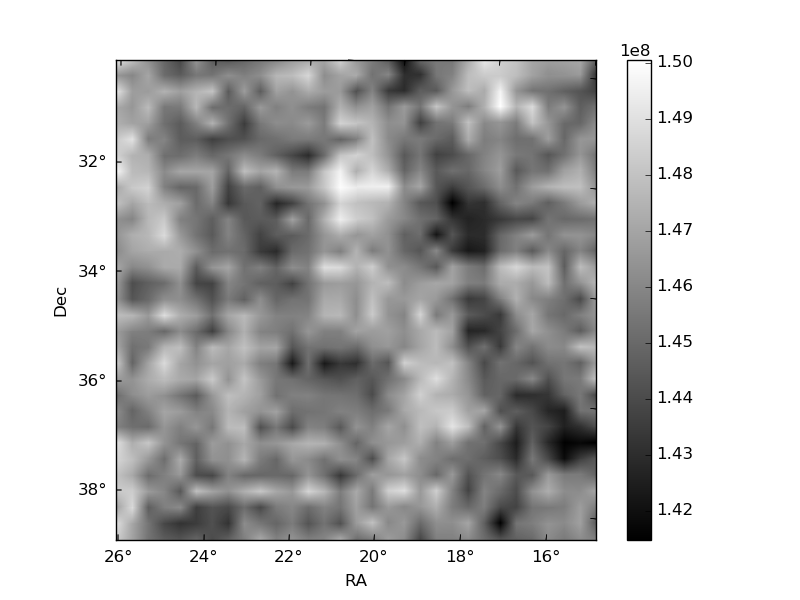
Quadrant B |
|---|---|---|---|
| Quadrant D | 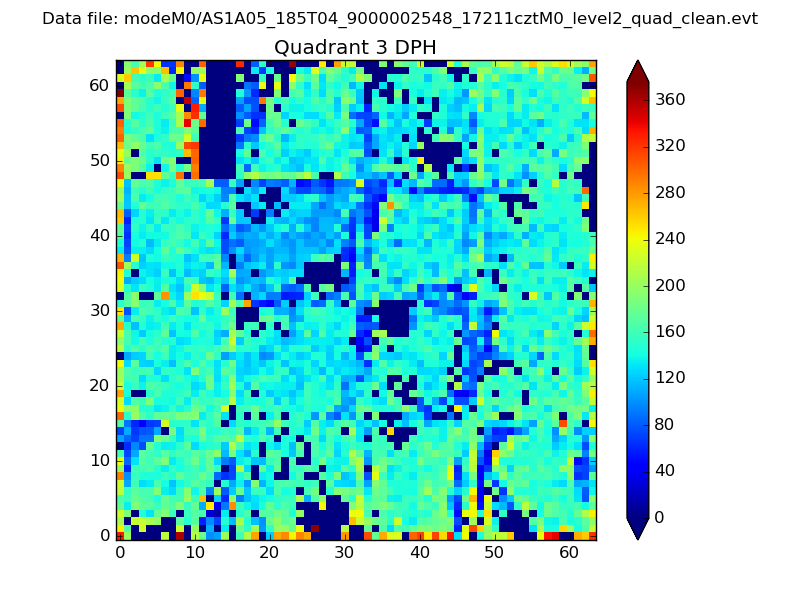 |
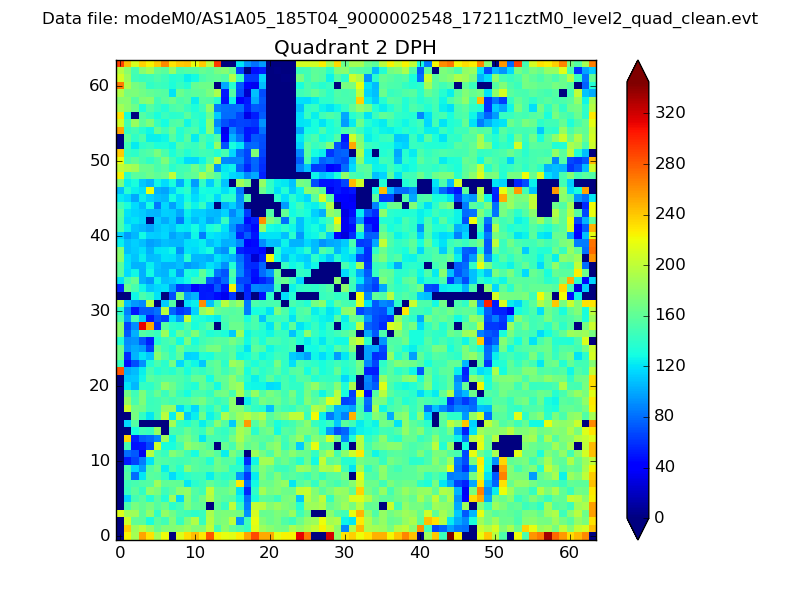 |
Quadrant C |
| Plot type | Count rate plots | Images |
|---|---|---|
| Comparison with Poisson distribution Blue bars denote a histogram of data divided into 1 sec bins. Red curve is a Poisson curve with rate = median count rate of data. |
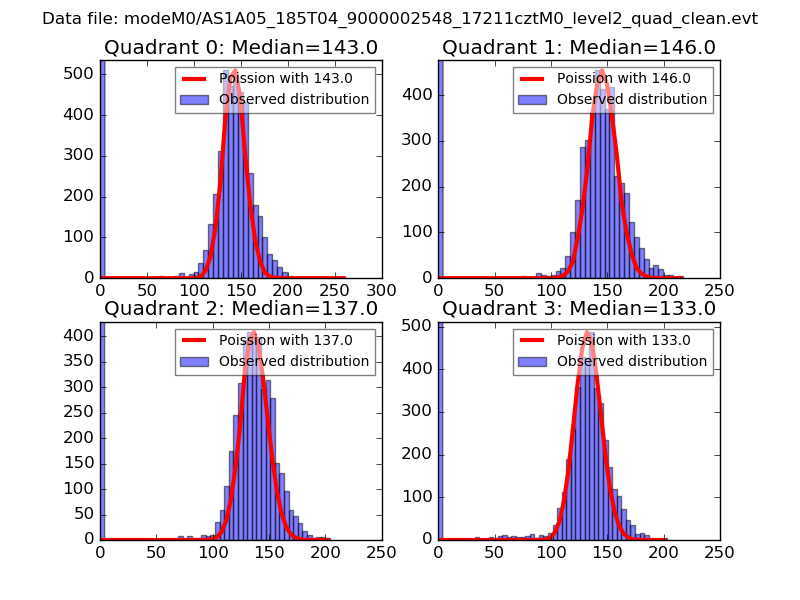 |
 |
| Quadrant-wise count rates Data is divided into 100 sec bins |
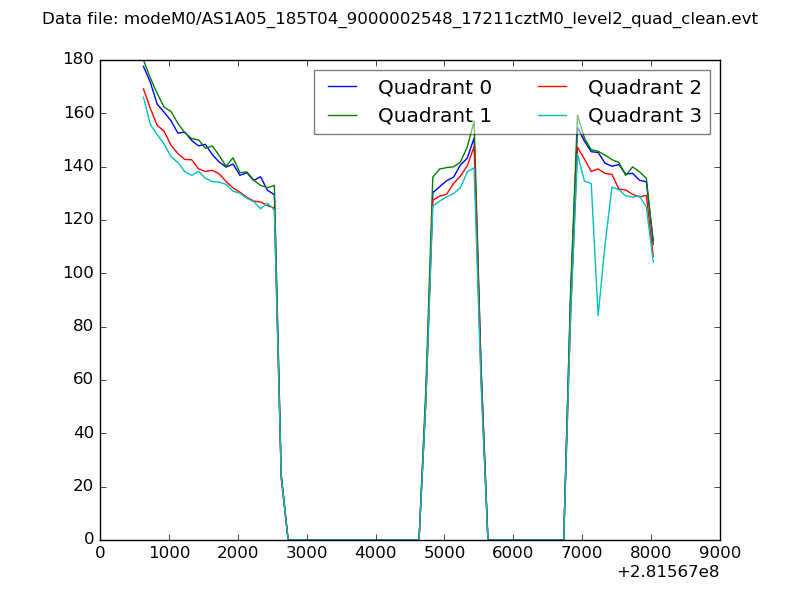 |
|
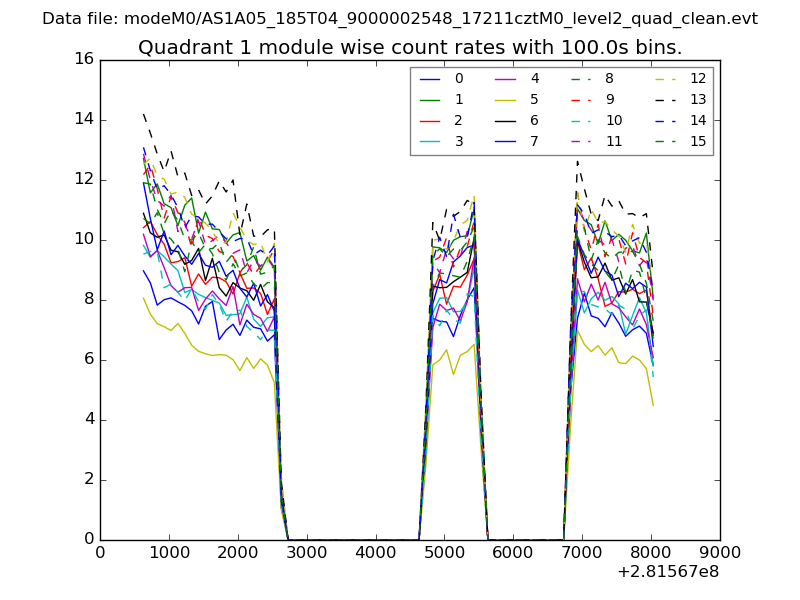
| Module-wise count rates for Quadrant A Data is divided into 100 sec bins |
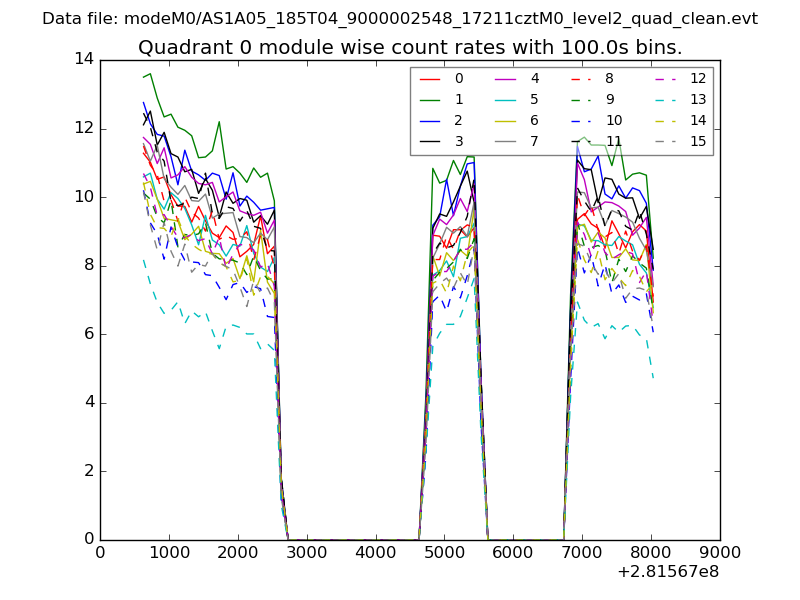 |
 |
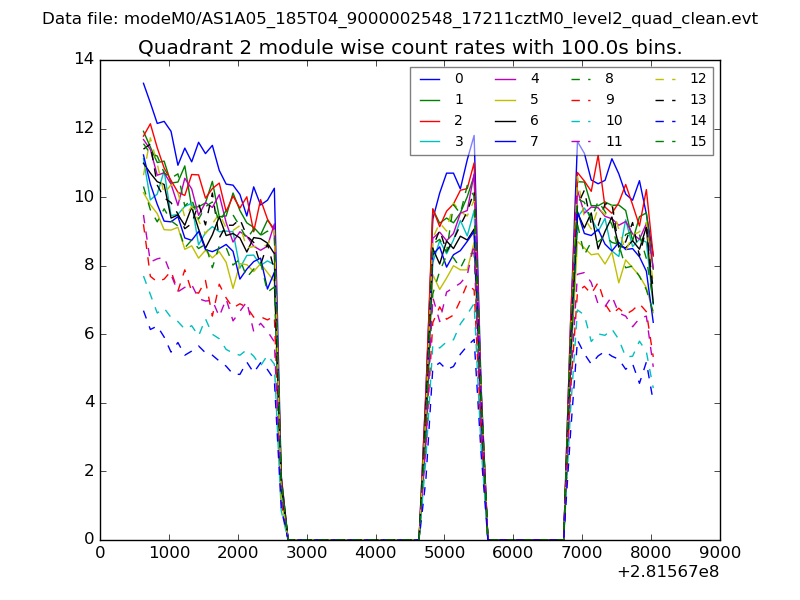
| Module-wise count rates for Quadrant B Data is divided into 100 sec bins |
 |
 |
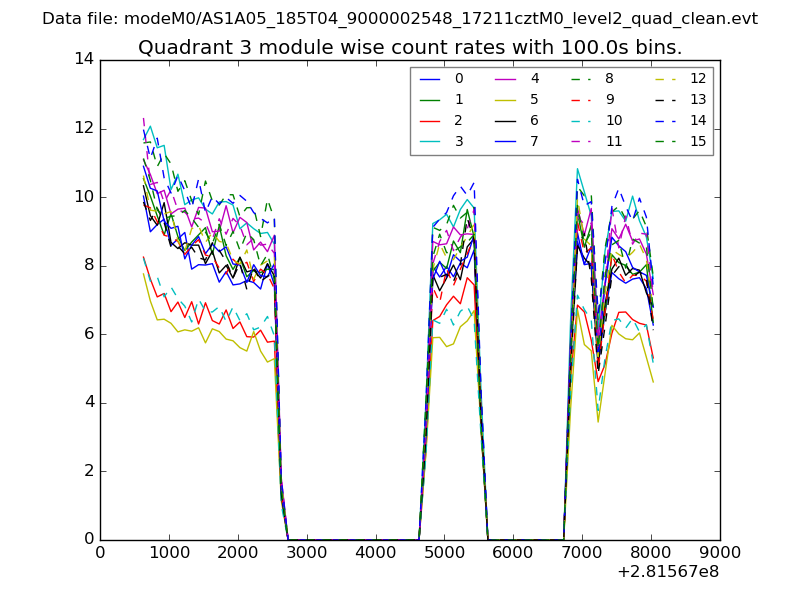
| Module-wise count rates for Quadrant C Data is divided into 100 sec bins |
 |
 |
| Module-wise count rates for Quadrant D Data is divided into 100 sec bins |
 |
 |
| Parameter | Plot |
|---|---|
| CZT HV Monitor | 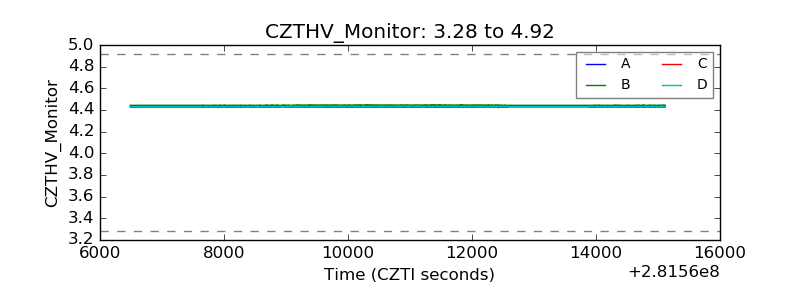 |
| D_VDD | 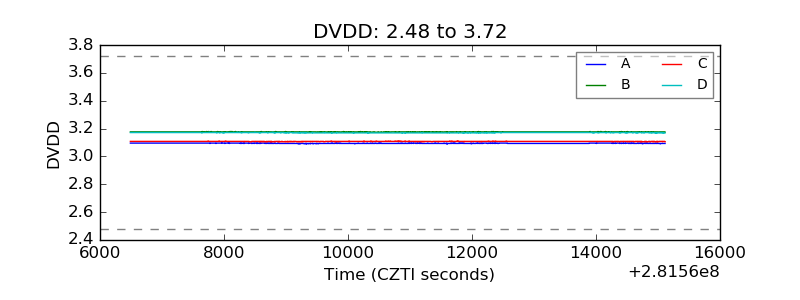 |
| Temperature 1 |  |
| Veto HV Monitor | 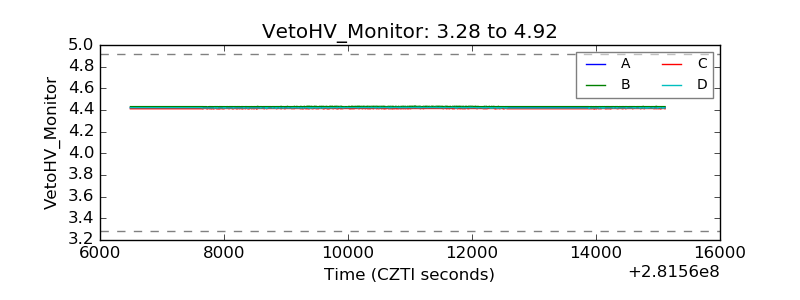 |
| Veto LLD | 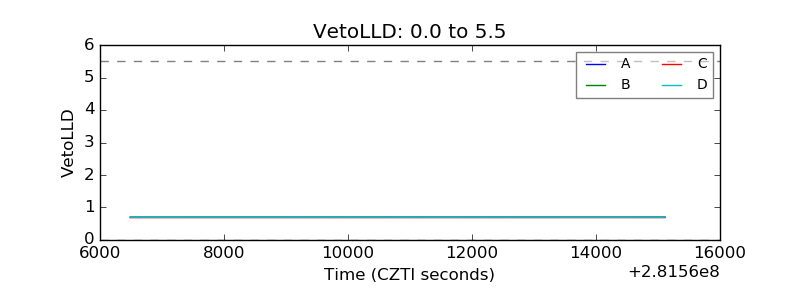 |
| Alpha Counter | 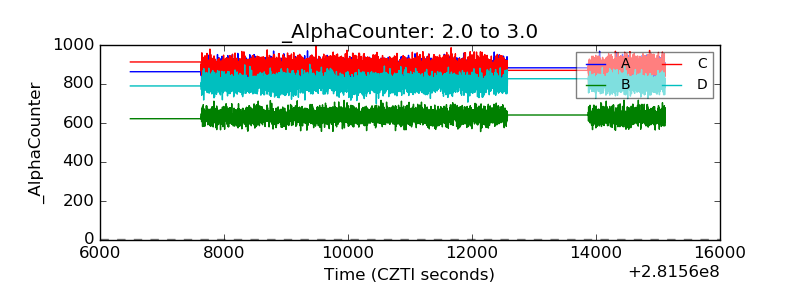 |
| _CPM_Rate | 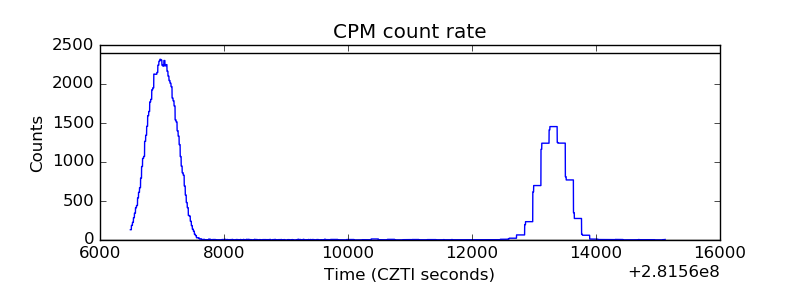 |
| CZT Counter | 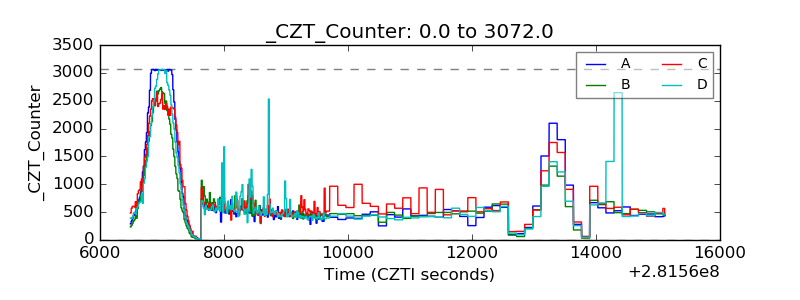 |
| +2.5 Volts monitor | 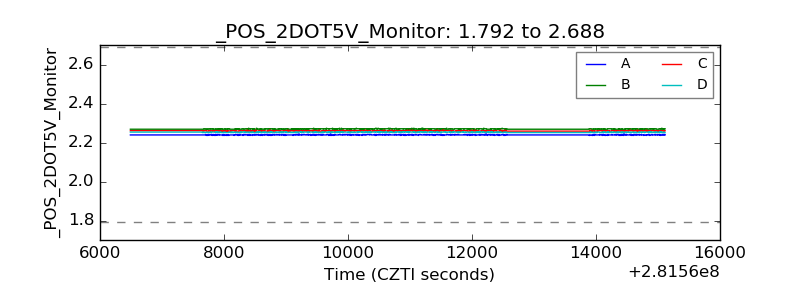 |
| +5 Volts monitor |  |
| _ROLL_ROT | 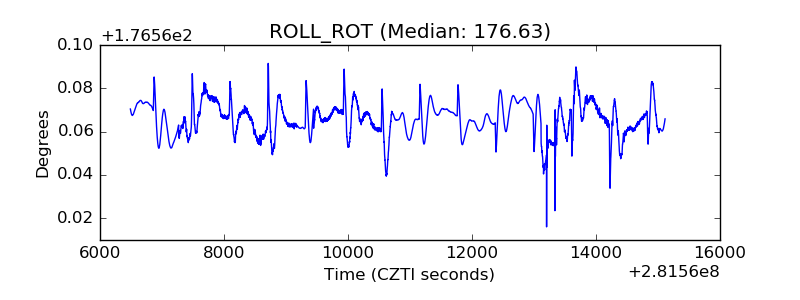 |
| _Roll_DEC | 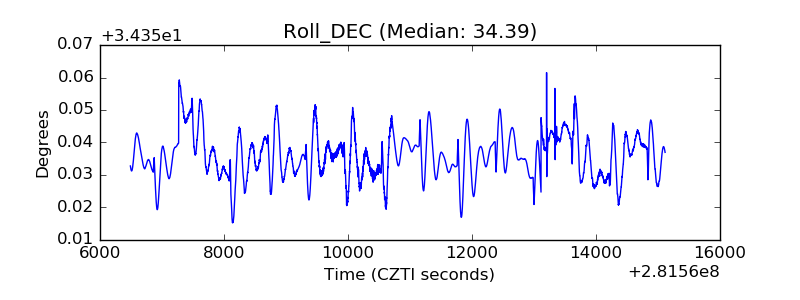 |
| _Roll_RA | 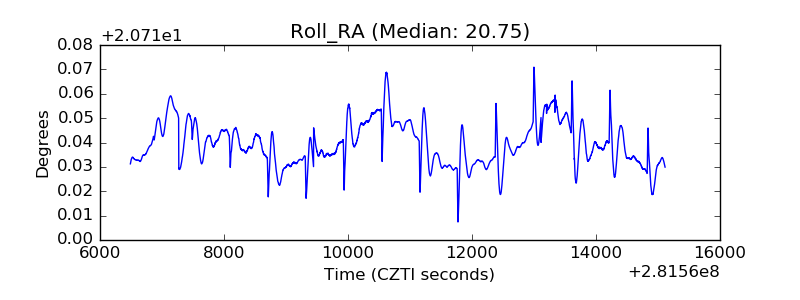 |
| Veto Counter | 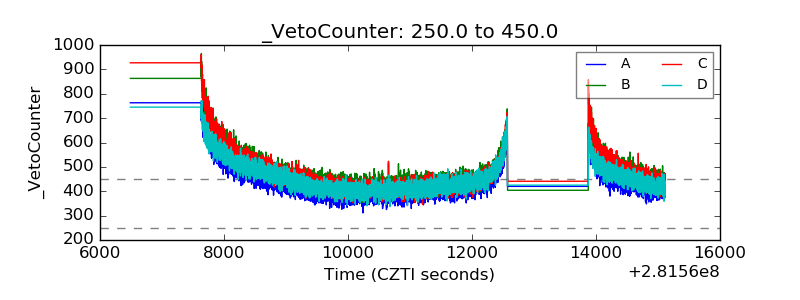 |