| Param | Original file | Final file |
|---|---|---|
| Filename | modeM0/AS1A05_185T04_9000002548_17213cztM0_level2.evt | modeM0/AS1A05_185T04_9000002548_17213cztM0_level2_quad_clean.evt |
| Size (bytes) | 535,305,600 | 99,267,840 |
| Size | 510.5 MB | 94.7 MB |
| Events in quadrant A | 3,532,024 | 638,037 |
| Events in quadrant B | 3,821,271 | 636,820 |
| Events in quadrant C | 4,038,736 | 605,817 |
| Events in quadrant D | 4,305,648 | 598,710 |
| Mode SS | |||
|---|---|---|---|
| Quadrant | BADHDUFLAG | Total packets | Discarded packets |
| A | 0 | 156 | 0 |
| B | 0 | 156 | 0 |
| C | 0 | 156 | 0 |
| D | 0 | 156 | 0 |
| Mode M9 | |||
|---|---|---|---|
| Quadrant | BADHDUFLAG | Total packets | Discarded packets |
| A | 0 | 18 | 0 |
| B | 0 | 18 | 0 |
| C | 0 | 18 | 0 |
| D | 0 | 18 | 0 |
| Mode M0 | |||
|---|---|---|---|
| Quadrant | BADHDUFLAG | Total packets | Discarded packets |
| A | 0 | 15626 | 2 |
| B | 0 | 16395 | 2 |
| C | 0 | 16826 | 2 |
| D | 0 | 18108 | 2 |
| Quadrant | Total seconds | Saturated seconds | Saturation percentage |
|---|---|---|---|
| A | 7572 | 21 | 0.277338% |
| B | 7573 | 85 | 1.122409% |
| C | 7573 | 111 | 1.465734% |
| D | 7573 | 139 | 1.835468% |
Noise dominated data is calculated using 1-second bins in cleaned event files. If a bin has >2000 counts, and if more than 50% of those come from <1% of pixels, then it is considered to be noise-dominated and hence unusable.
| Quadrant | # 1 sec bins | Bins with >0 counts | Bins with >2000 counts | High rate bins dominated by noise | Noise dominated (total time) | Noise dominated (detector-on time) | Marked lightcurve |
|---|---|---|---|---|---|---|---|
| A | 9372 | 7574 | 0 | 0 | 0.00% | 0.00% | 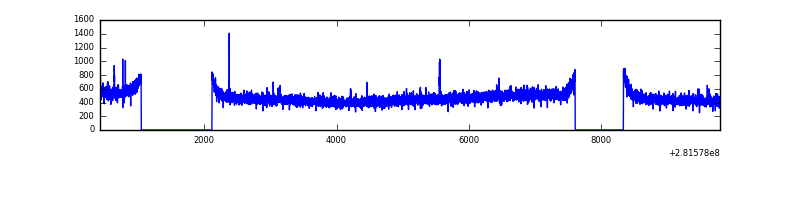 |
| B | 9373 | 7575 | 8 | 8 | 0.09% | 0.11% | 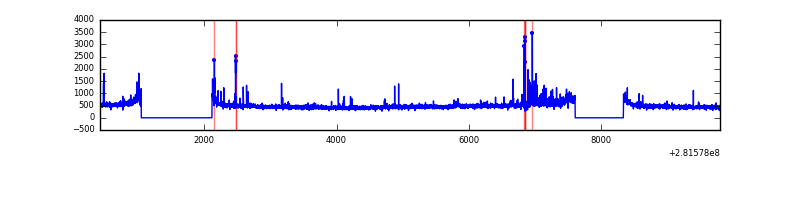 |
| C | 9373 | 7575 | 2 | 2 | 0.02% | 0.03% | 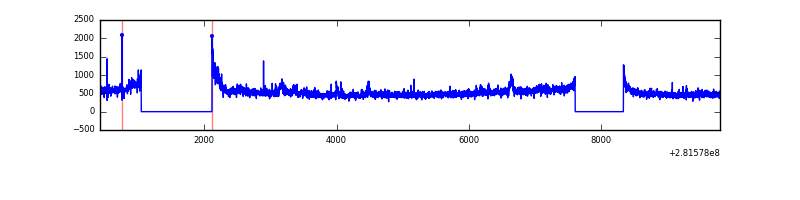 |
| D | 9373 | 7575 | 82 | 82 | 0.87% | 1.08% | 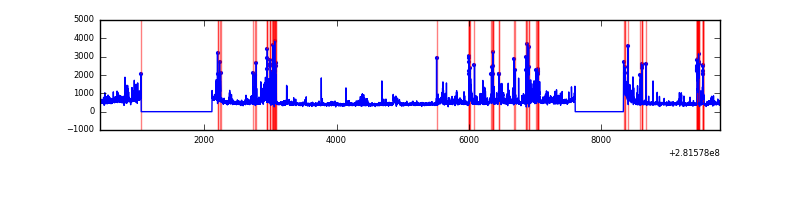 |
Top three noisy pixels from each quadrant. If the there are fewer than three noisy pixels in the level2.evt file, extra rows are filled as -1
| Pixel properties | Quadrant properties | ||||||
|---|---|---|---|---|---|---|---|
| Quadrant | DetID | PixID | Counts | Sigma | Mean | Median | Sigma |
| A | 12 | 189 | 12778 | 63.86 | 913 | 894 | 186.1 |
| A | 0 | 226 | 7992 | 38.14 | 913 | 894 | 186.1 |
| A | 3 | 137 | 6645 | 30.9 | 913 | 894 | 186.1 |
| B | 7 | 220 | 110668 | 626.49 | 912 | 888 | 175.2 |
| B | 15 | 35 | 31459 | 174.46 | 912 | 888 | 175.2 |
| B | 12 | 111 | 20409 | 111.4 | 912 | 888 | 175.2 |
| C | 3 | 233 | 469018 | 2275.3 | 877 | 881 | 205.7 |
| C | 14 | 238 | 133405 | 644.11 | 877 | 881 | 205.7 |
| C | 13 | 61 | 6151 | 25.61 | 877 | 881 | 205.7 |
| D | 5 | 222 | 465230 | 2129.64 | 887 | 860 | 218.1 |
| D | 13 | 189 | 266494 | 1218.22 | 887 | 860 | 218.1 |
| D | 12 | 233 | 70173 | 317.87 | 887 | 860 | 218.1 |
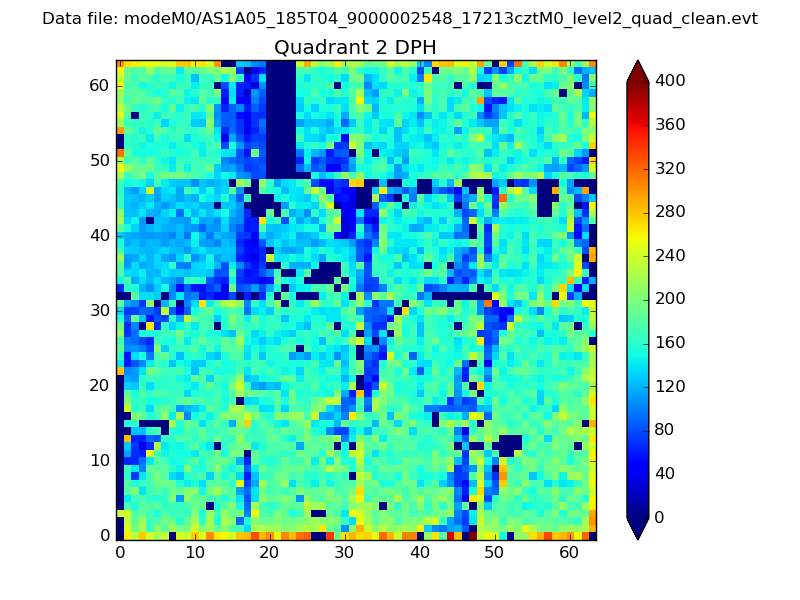
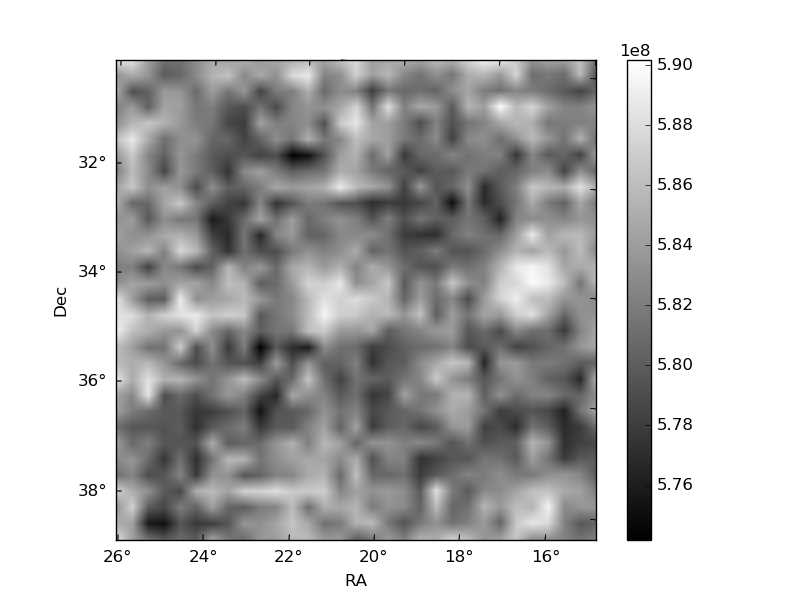
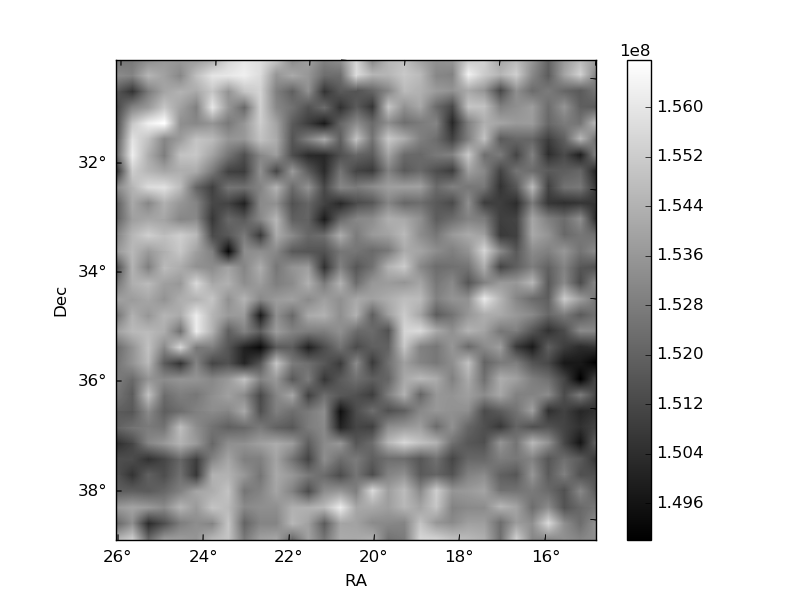
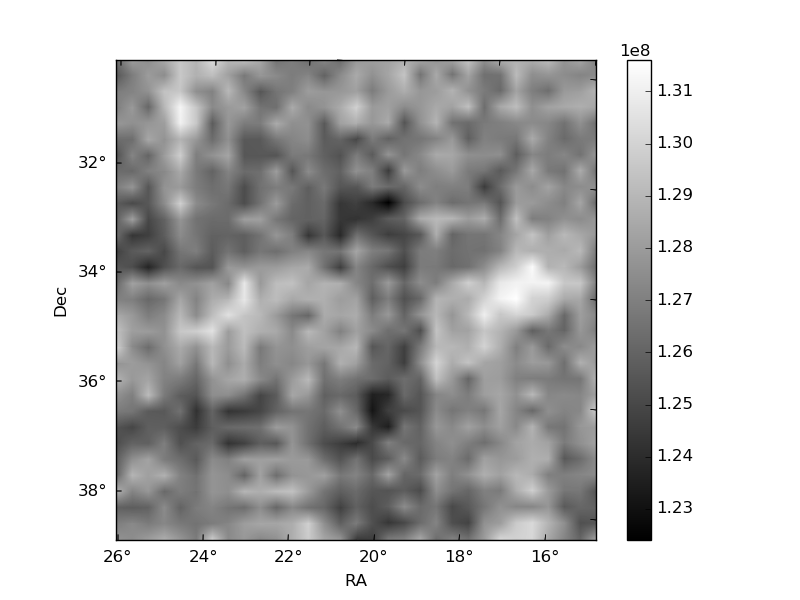
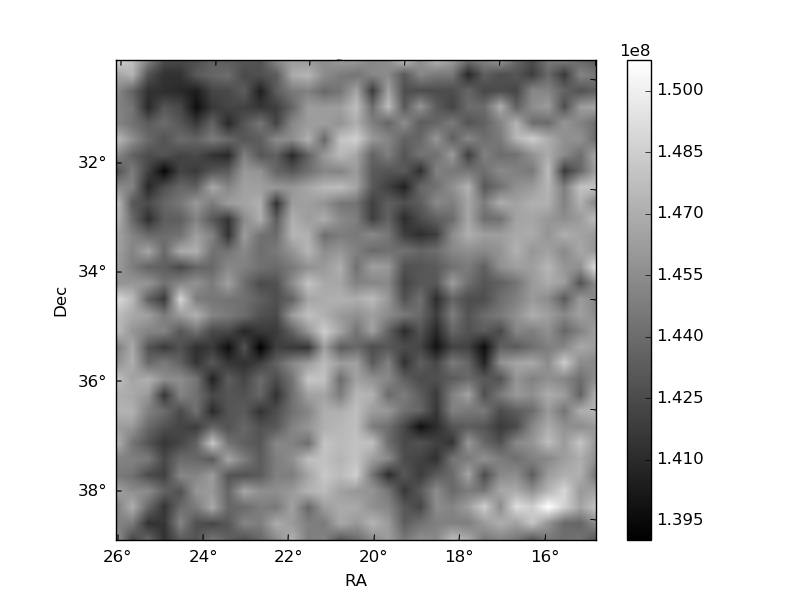
Histogram calculated using DETX and DETY for each event in the final _common_clean file
| Quadrant A | 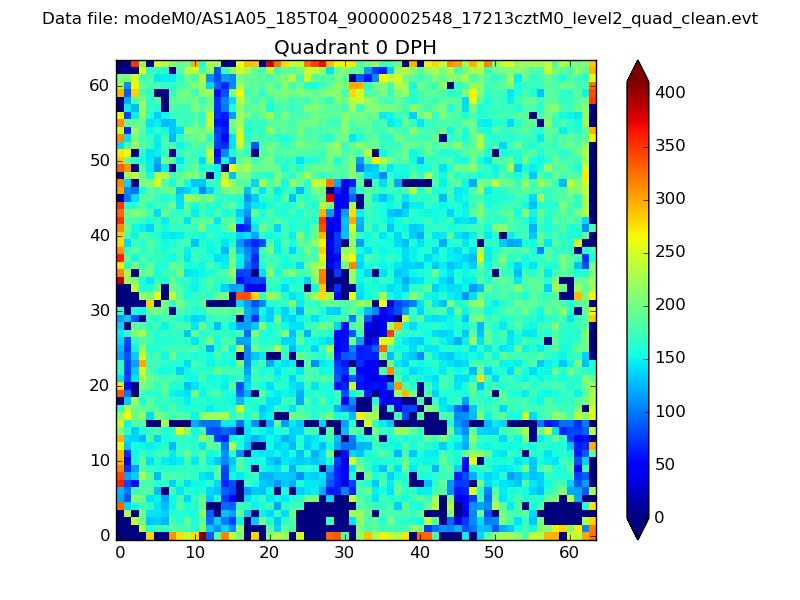 |
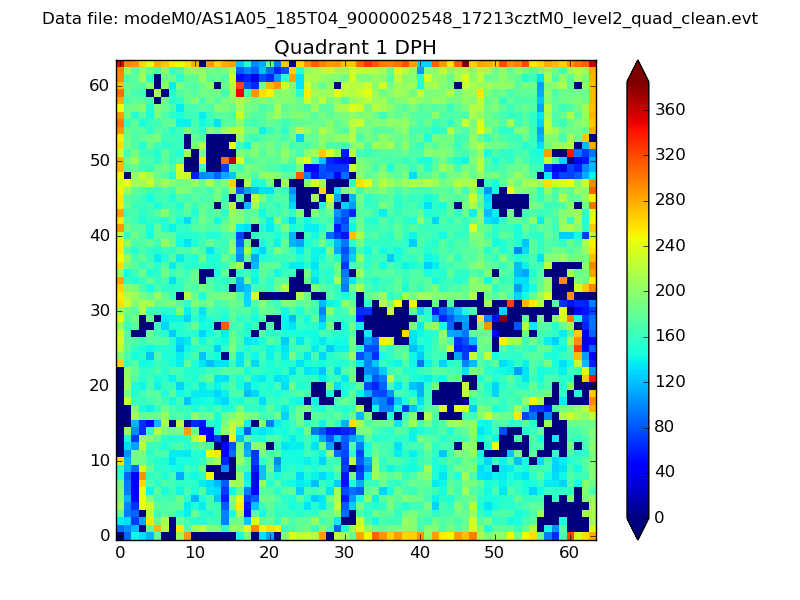 |
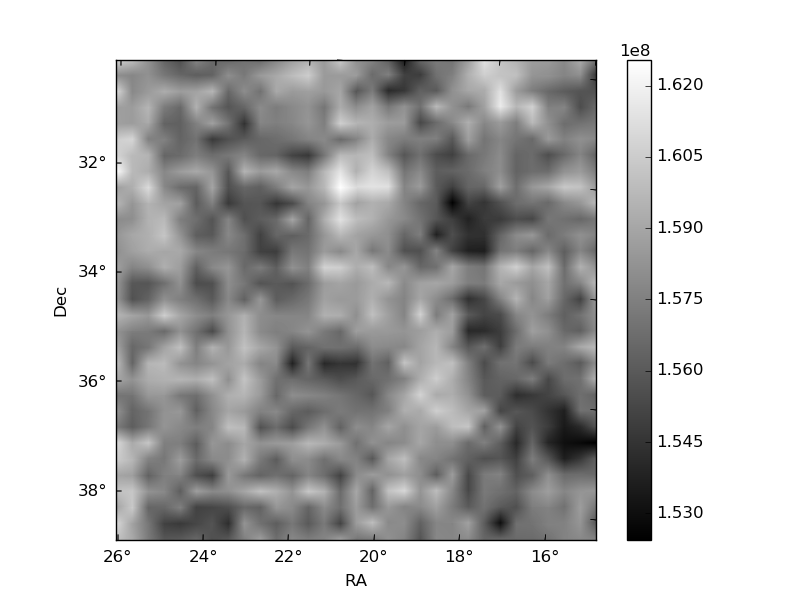
Quadrant B |
|---|---|---|---|
| Quadrant D | 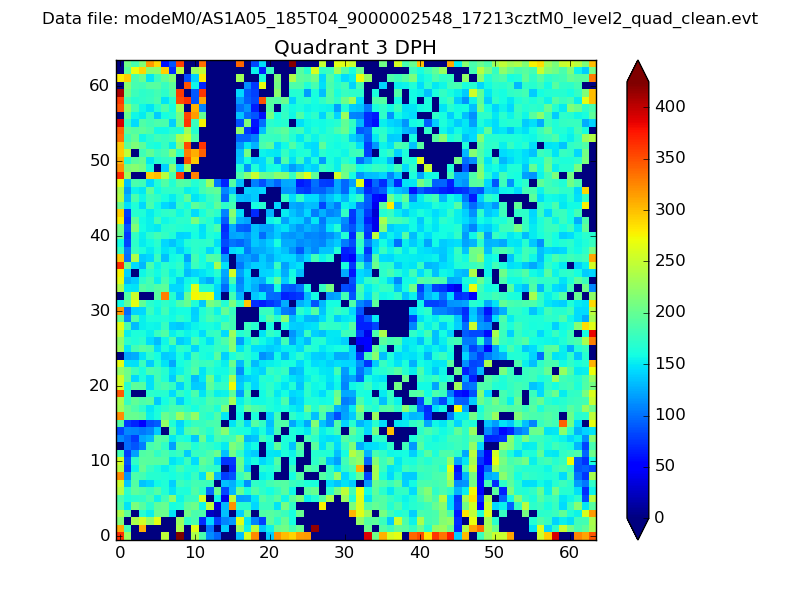 |
 |
Quadrant C |
| Plot type | Count rate plots | Images |
|---|---|---|
| Comparison with Poisson distribution Blue bars denote a histogram of data divided into 1 sec bins. Red curve is a Poisson curve with rate = median count rate of data. |
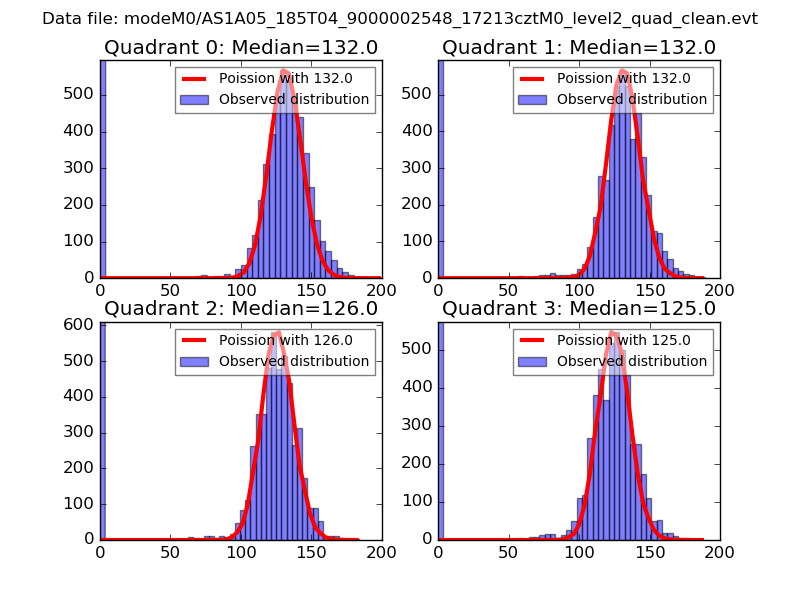 |
 |
| Quadrant-wise count rates Data is divided into 100 sec bins |
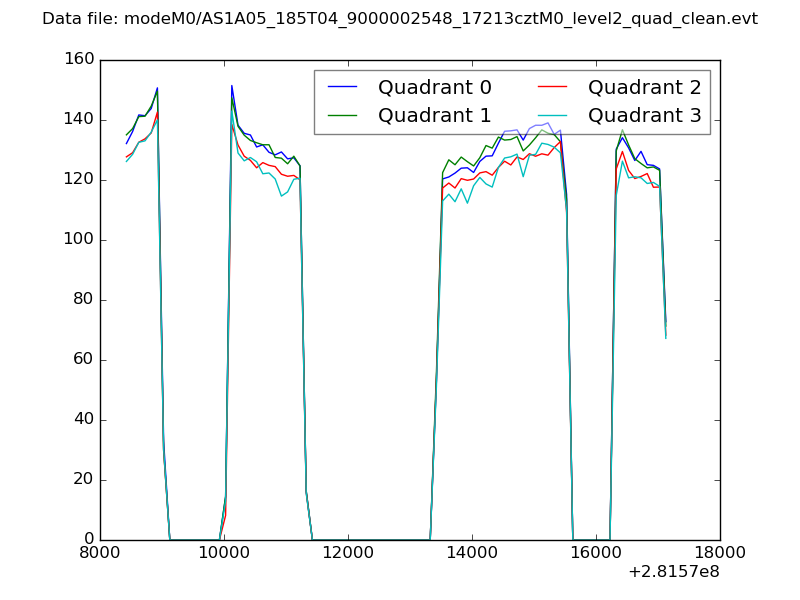 |
|
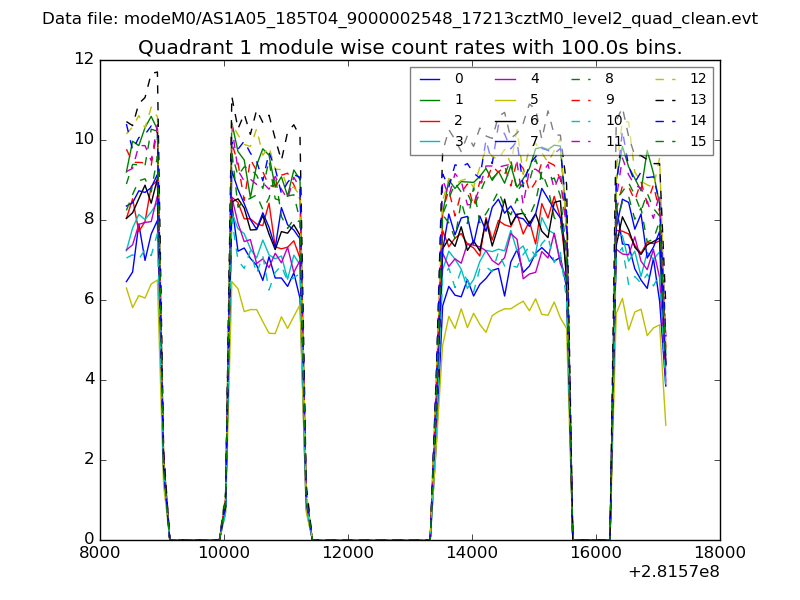
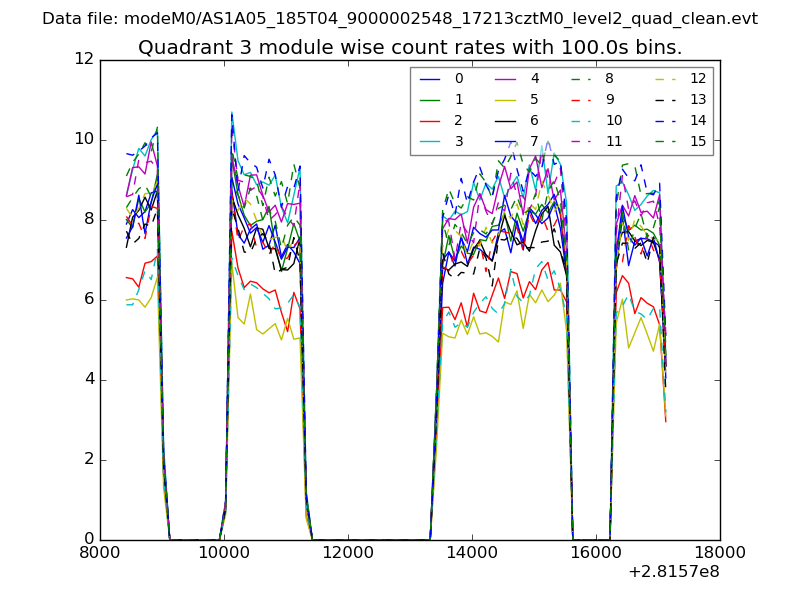
| Module-wise count rates for Quadrant A Data is divided into 100 sec bins |
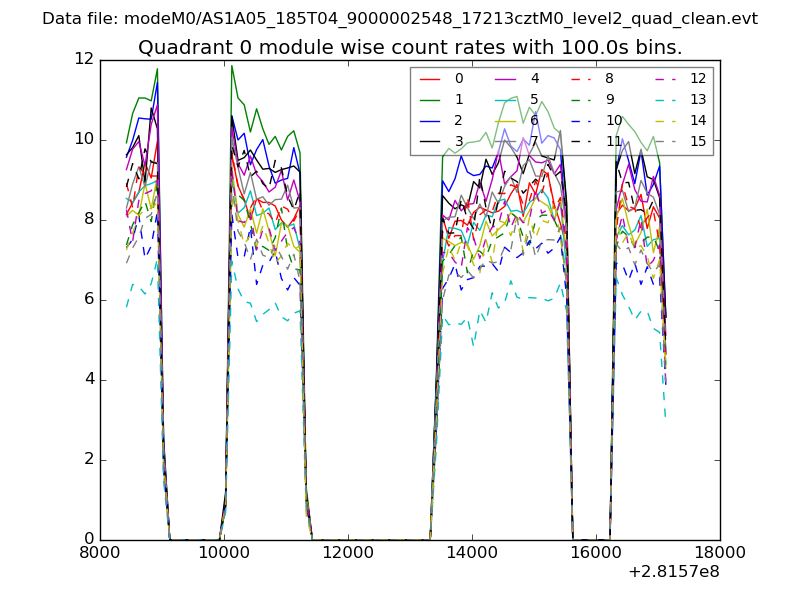 |
 |
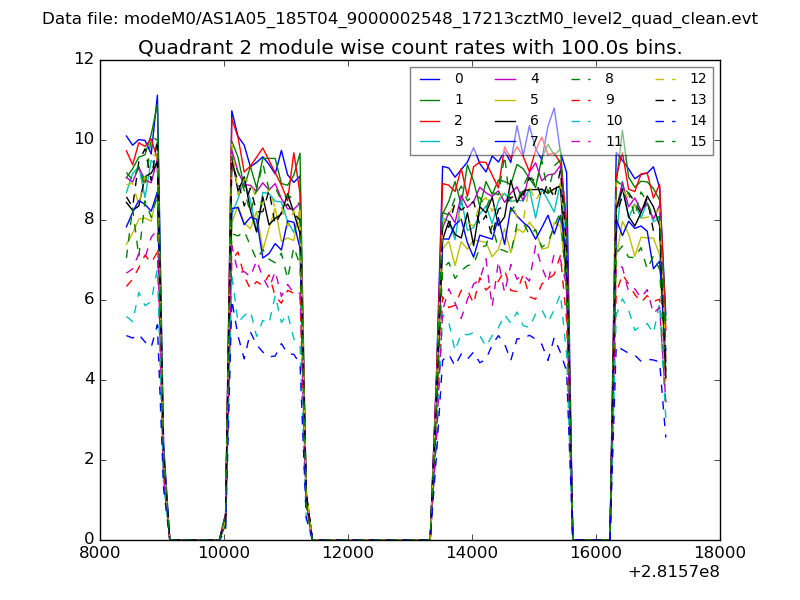
| Module-wise count rates for Quadrant B Data is divided into 100 sec bins |
 |
 |
| Module-wise count rates for Quadrant C Data is divided into 100 sec bins |
 |
 |
| Module-wise count rates for Quadrant D Data is divided into 100 sec bins |
 |
 |
| Parameter | Plot |
|---|---|
| CZT HV Monitor | 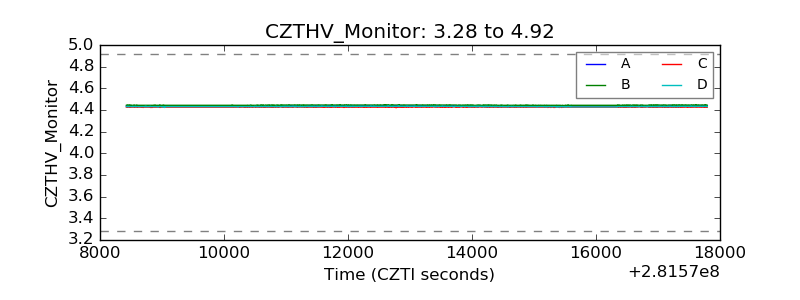 |
| D_VDD |  |
| Temperature 1 | 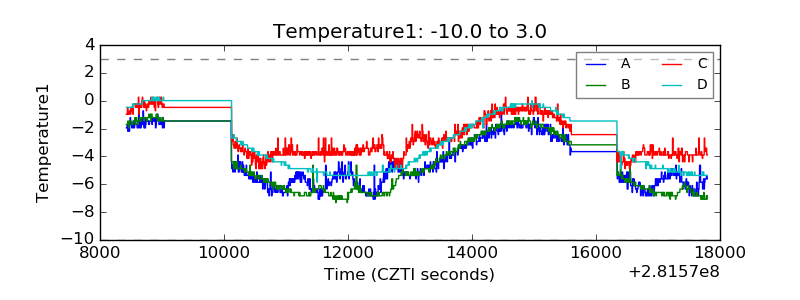 |
| Veto HV Monitor |  |
| Veto LLD | 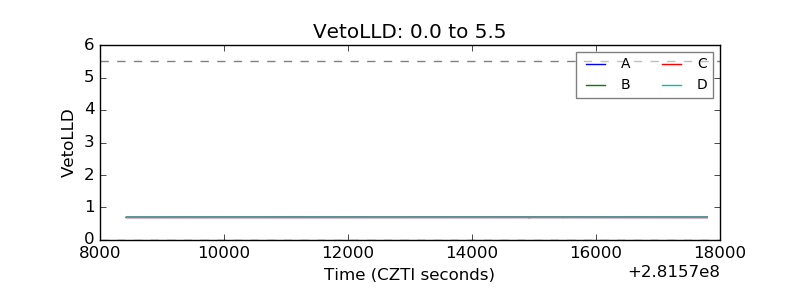 |
| Alpha Counter | 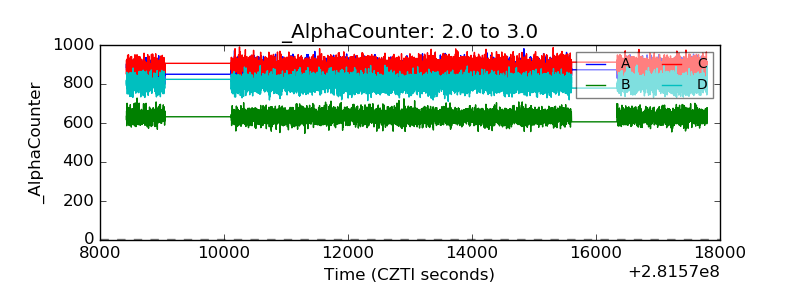 |
| _CPM_Rate | 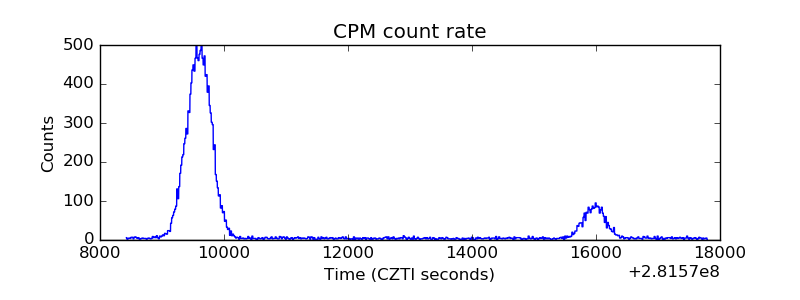 |
| CZT Counter | 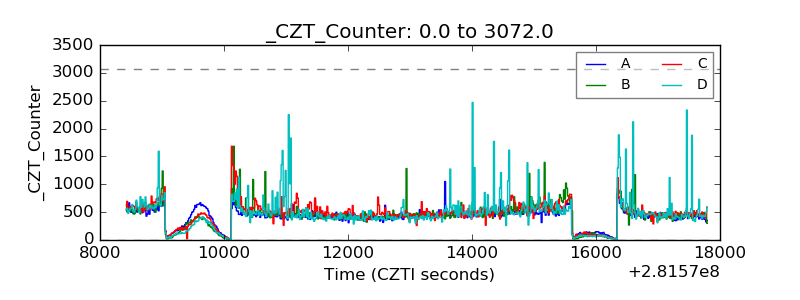 |
| +2.5 Volts monitor |  |
| +5 Volts monitor |  |
| _ROLL_ROT | 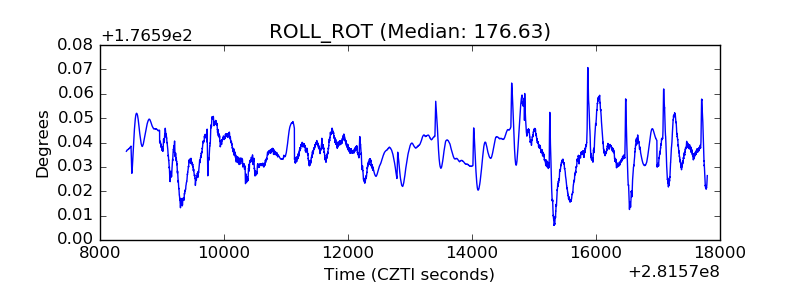 |
| _Roll_DEC | 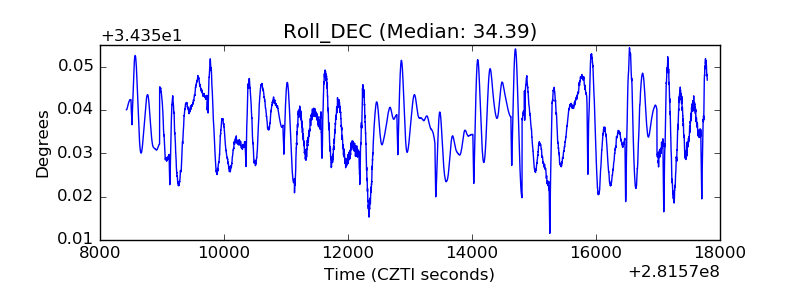 |
| _Roll_RA | 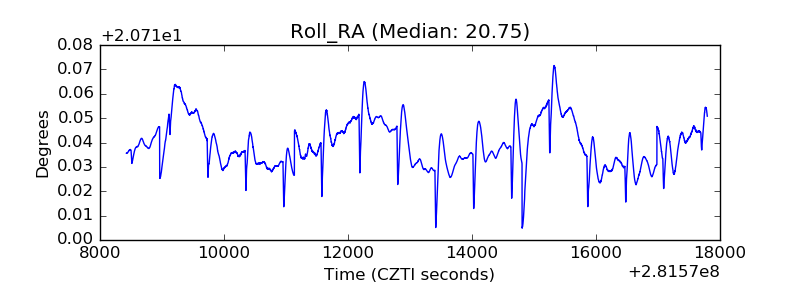 |
| Veto Counter | 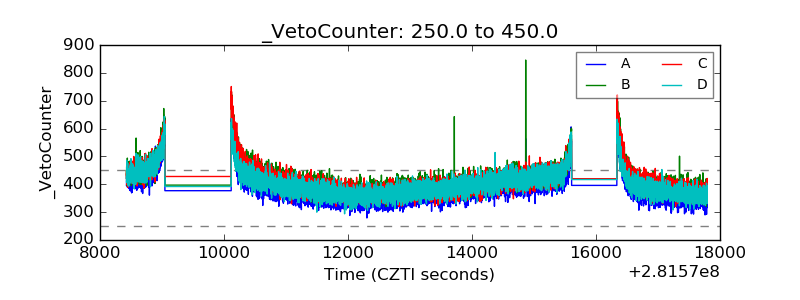 |