| Param | Original file | Final file |
|---|---|---|
| Filename | modeM0/AS1A05_185T04_9000002548_17214cztM0_level2.evt | modeM0/AS1A05_185T04_9000002548_17214cztM0_level2_quad_clean.evt |
| Size (bytes) | 534,510,720 | 93,291,840 |
| Size | 509.7 MB | 89.0 MB |
| Events in quadrant A | 3,571,363 | 587,099 |
| Events in quadrant B | 3,772,731 | 586,807 |
| Events in quadrant C | 4,119,557 | 558,833 |
| Events in quadrant D | 4,196,983 | 552,464 |
| Mode SS | |||
|---|---|---|---|
| Quadrant | BADHDUFLAG | Total packets | Discarded packets |
| A | 0 | 160 | 0 |
| B | 0 | 160 | 0 |
| C | 0 | 160 | 0 |
| D | 0 | 160 | 0 |
| Mode M9 | |||
|---|---|---|---|
| Quadrant | BADHDUFLAG | Total packets | Discarded packets |
| A | 0 | 11 | 0 |
| B | 0 | 11 | 0 |
| C | 0 | 11 | 0 |
| D | 0 | 11 | 0 |
| Mode M0 | |||
|---|---|---|---|
| Quadrant | BADHDUFLAG | Total packets | Discarded packets |
| A | 0 | 15949 | 2 |
| B | 0 | 16362 | 2 |
| C | 0 | 17223 | 2 |
| D | 0 | 17903 | 2 |
| Quadrant | Total seconds | Saturated seconds | Saturation percentage |
|---|---|---|---|
| A | 7760 | 61 | 0.786082% |
| B | 7761 | 101 | 1.301379% |
| C | 7761 | 127 | 1.636387% |
| D | 7761 | 188 | 2.422368% |
Noise dominated data is calculated using 1-second bins in cleaned event files. If a bin has >2000 counts, and if more than 50% of those come from <1% of pixels, then it is considered to be noise-dominated and hence unusable.
| Quadrant | # 1 sec bins | Bins with >0 counts | Bins with >2000 counts | High rate bins dominated by noise | Noise dominated (total time) | Noise dominated (detector-on time) | Marked lightcurve |
|---|---|---|---|---|---|---|---|
| A | 8865 | 7763 | 0 | 0 | 0.00% | 0.00% | 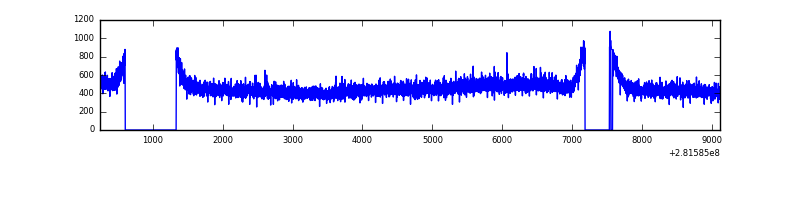 |
| B | 8866 | 7764 | 4 | 4 | 0.05% | 0.05% | 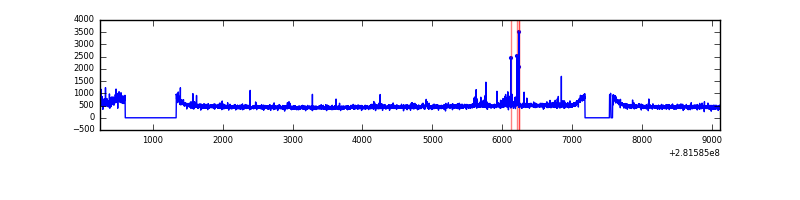 |
| C | 8866 | 7764 | 0 | 0 | 0.00% | 0.00% | 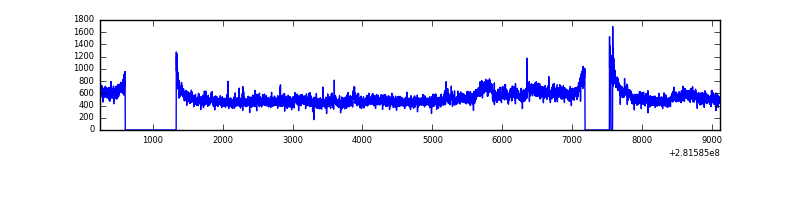 |
| D | 8866 | 7764 | 116 | 116 | 1.31% | 1.49% | 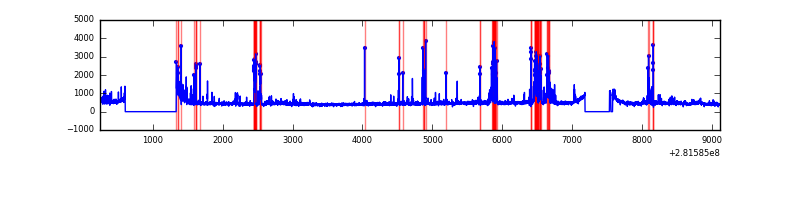 |
Top three noisy pixels from each quadrant. If the there are fewer than three noisy pixels in the level2.evt file, extra rows are filled as -1
| Pixel properties | Quadrant properties | ||||||
|---|---|---|---|---|---|---|---|
| Quadrant | DetID | PixID | Counts | Sigma | Mean | Median | Sigma |
| A | 0 | 226 | 8232 | 39.03 | 927 | 906 | 187.7 |
| A | 3 | 137 | 6839 | 31.61 | 927 | 906 | 187.7 |
| A | 12 | 194 | 6713 | 30.94 | 927 | 906 | 187.7 |
| B | 7 | 220 | 35950 | 194.36 | 931 | 907 | 180.3 |
| B | 15 | 35 | 30014 | 161.43 | 931 | 907 | 180.3 |
| B | 12 | 111 | 21348 | 113.37 | 931 | 907 | 180.3 |
| C | 3 | 233 | 482474 | 2285.09 | 893 | 896 | 210.7 |
| C | 14 | 238 | 134914 | 635.92 | 893 | 896 | 210.7 |
| C | 8 | 128 | 12066 | 53.0 | 893 | 896 | 210.7 |
| D | 13 | 189 | 283415 | 1278.16 | 901 | 873 | 221.1 |
| D | 10 | 70 | 203809 | 918.04 | 901 | 873 | 221.1 |
| D | 5 | 222 | 146358 | 658.14 | 901 | 873 | 221.1 |
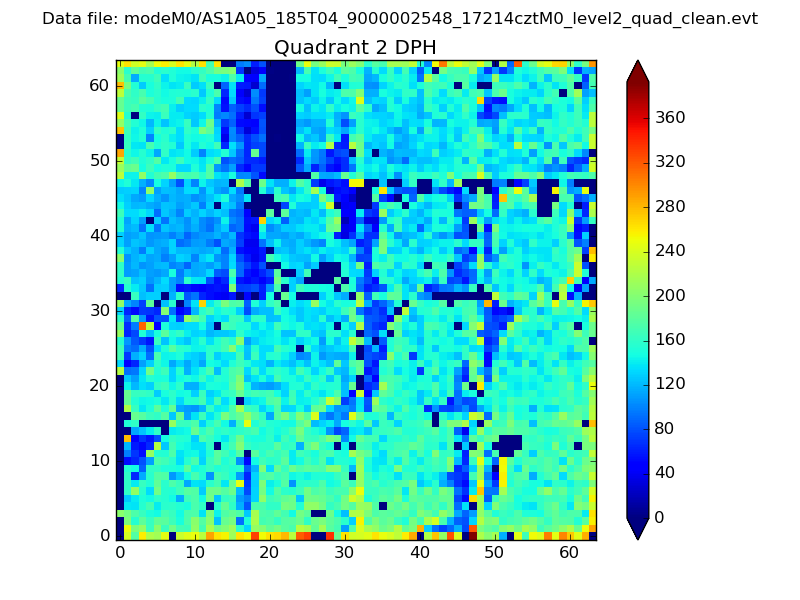
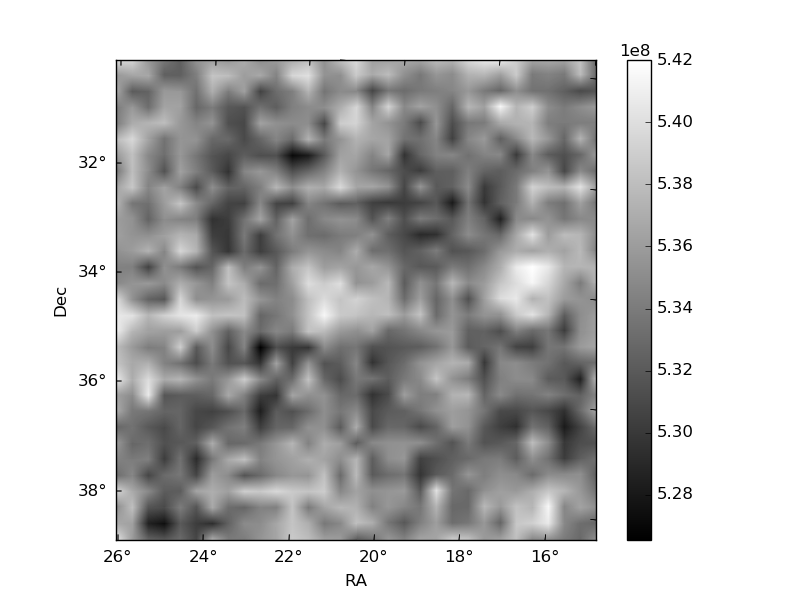
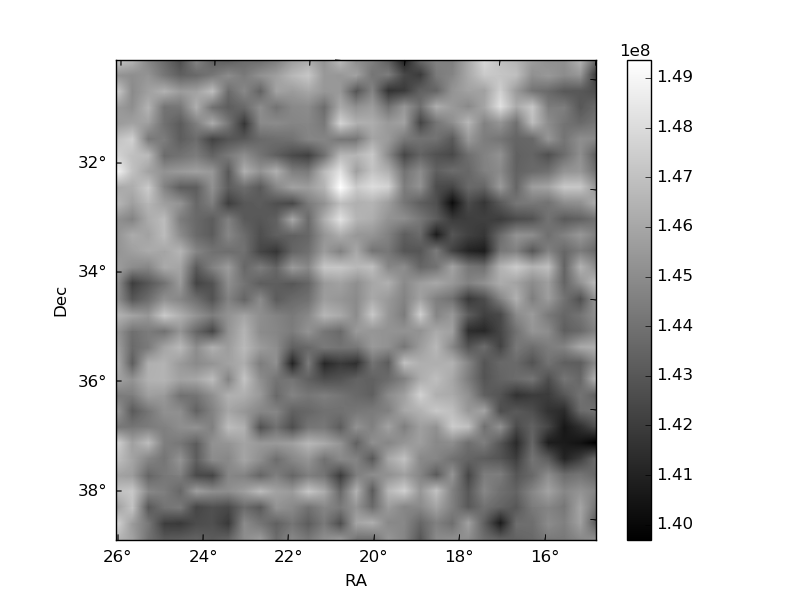
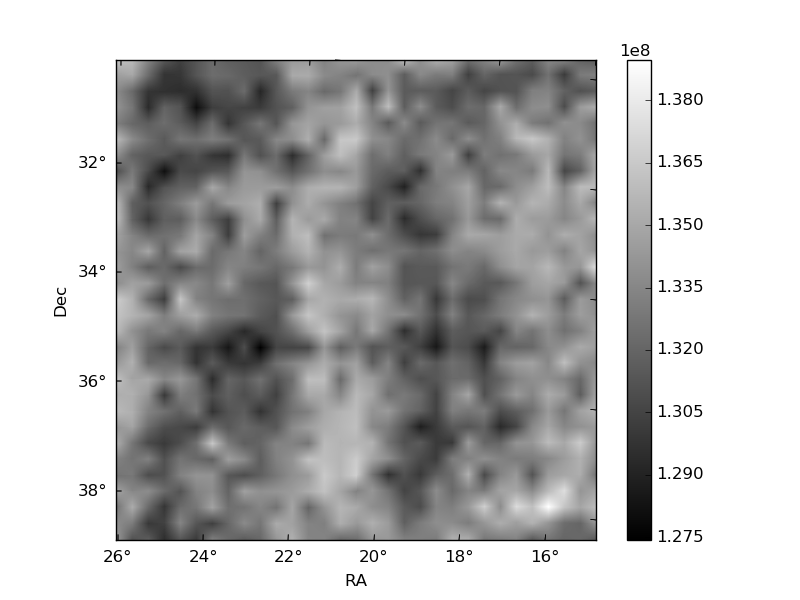
Histogram calculated using DETX and DETY for each event in the final _common_clean file
| Quadrant A | 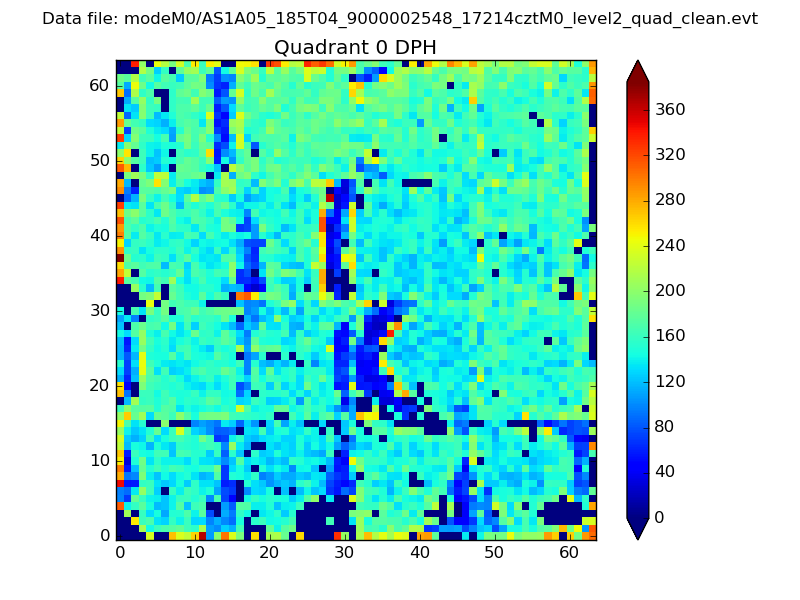 |
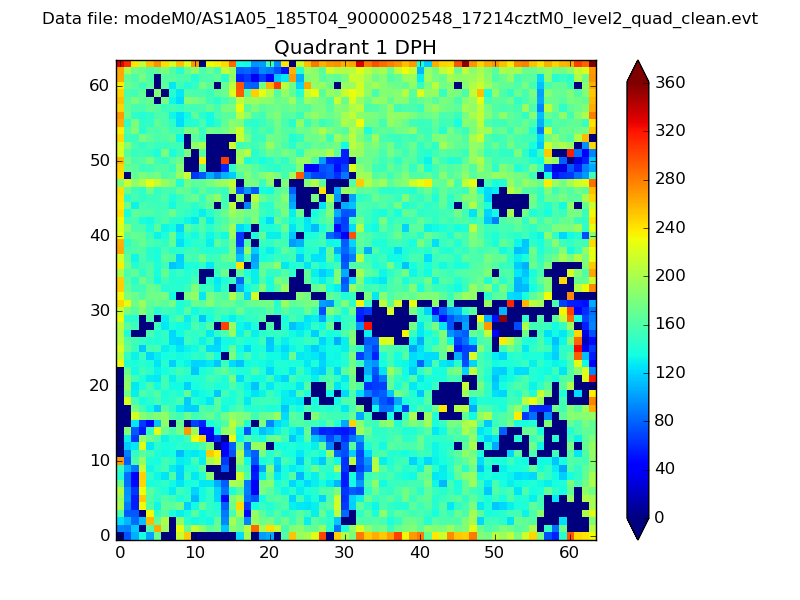 |
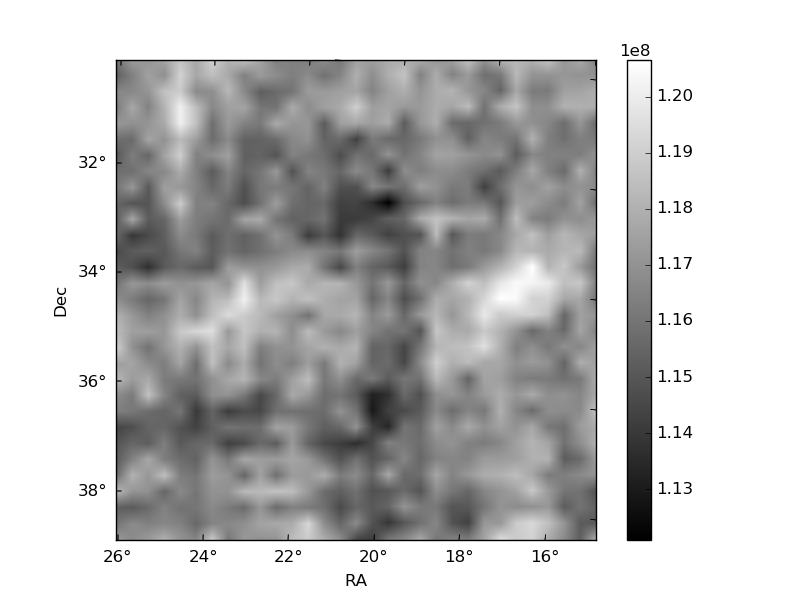
Quadrant B |
|---|---|---|---|
| Quadrant D | 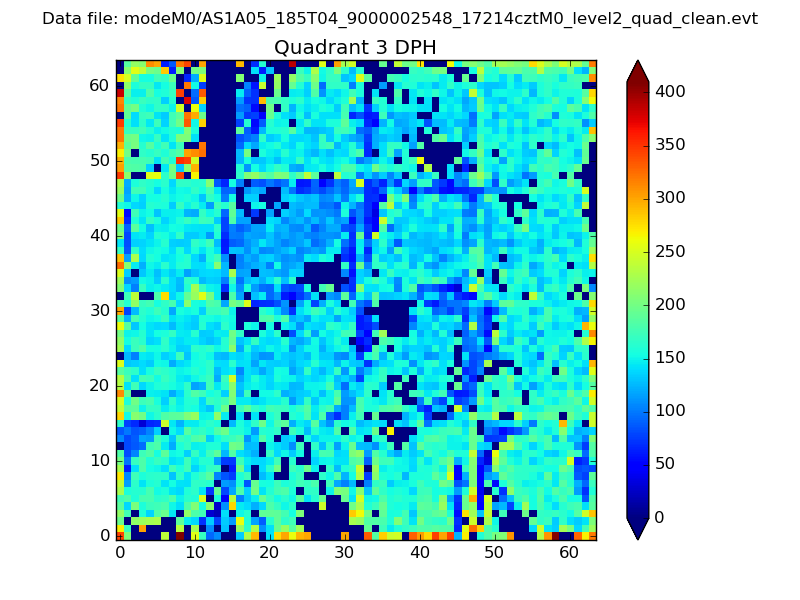 |
 |
Quadrant C |
| Plot type | Count rate plots | Images |
|---|---|---|
| Comparison with Poisson distribution Blue bars denote a histogram of data divided into 1 sec bins. Red curve is a Poisson curve with rate = median count rate of data. |
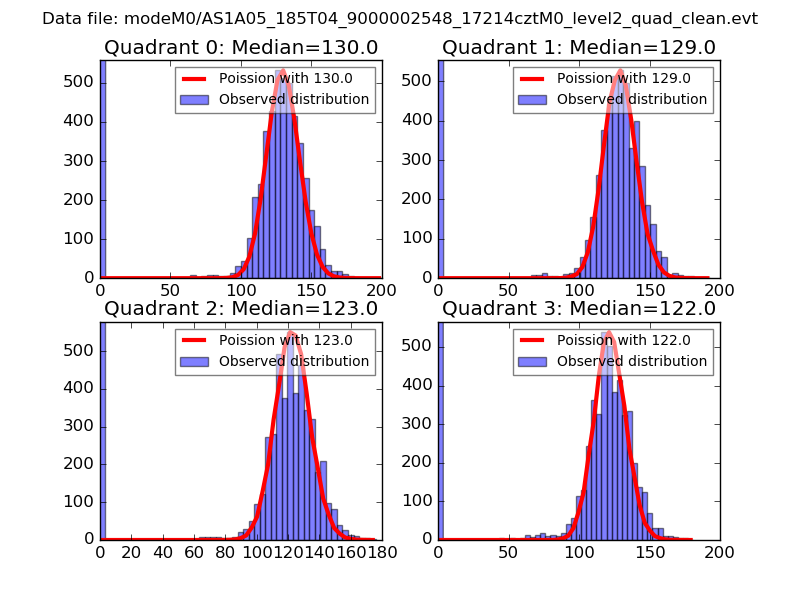 |
 |
| Quadrant-wise count rates Data is divided into 100 sec bins |
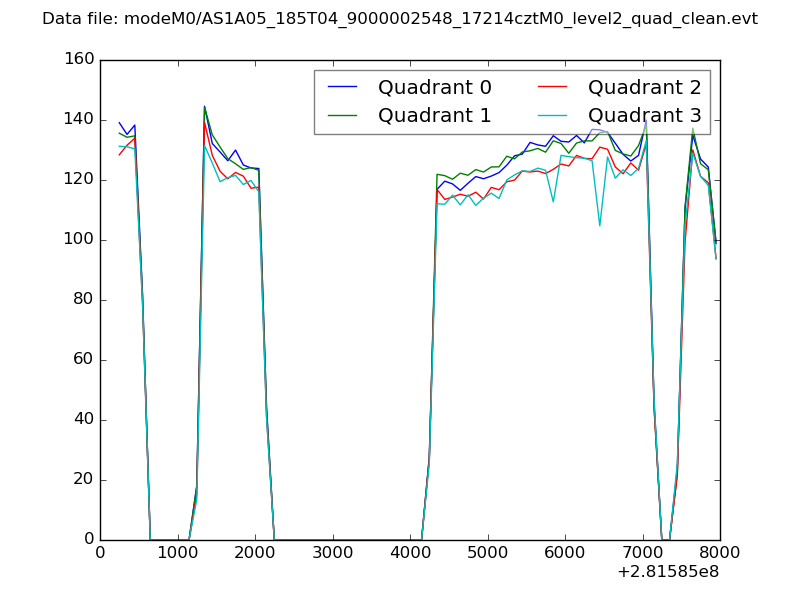 |
|
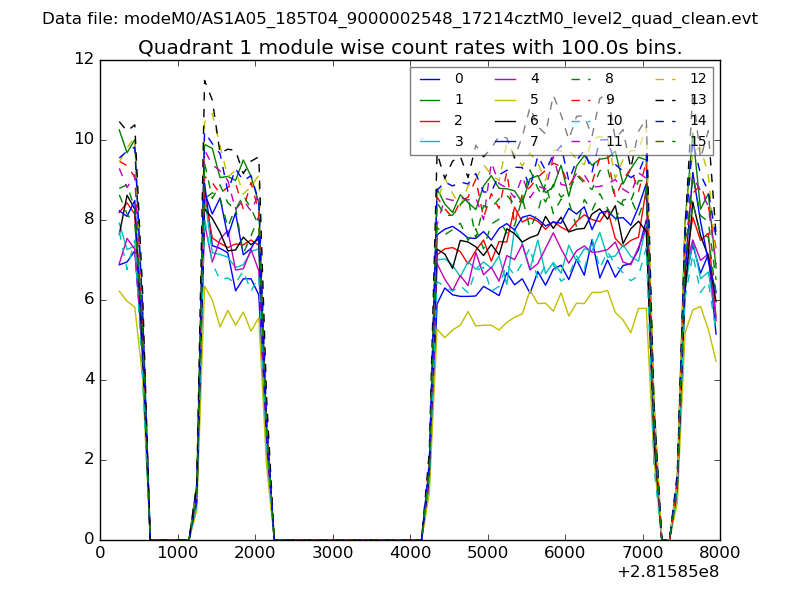
| Module-wise count rates for Quadrant A Data is divided into 100 sec bins |
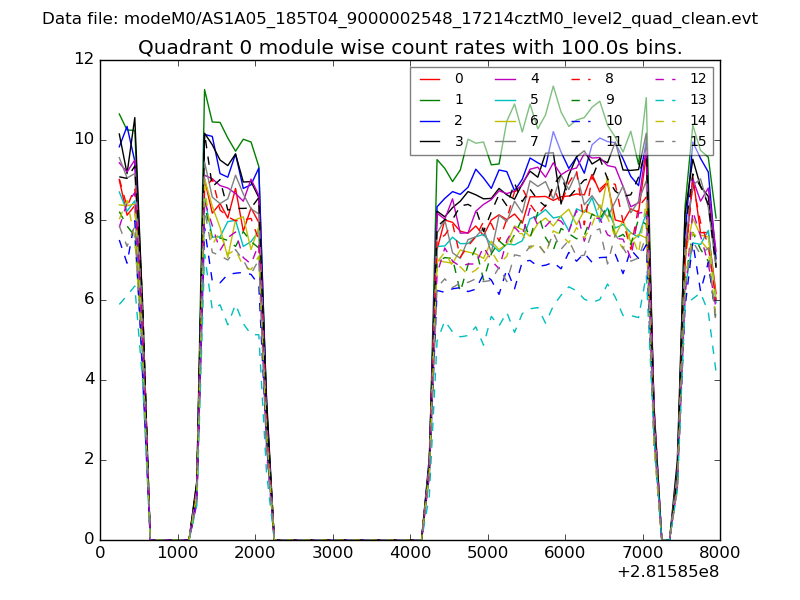 |
 |
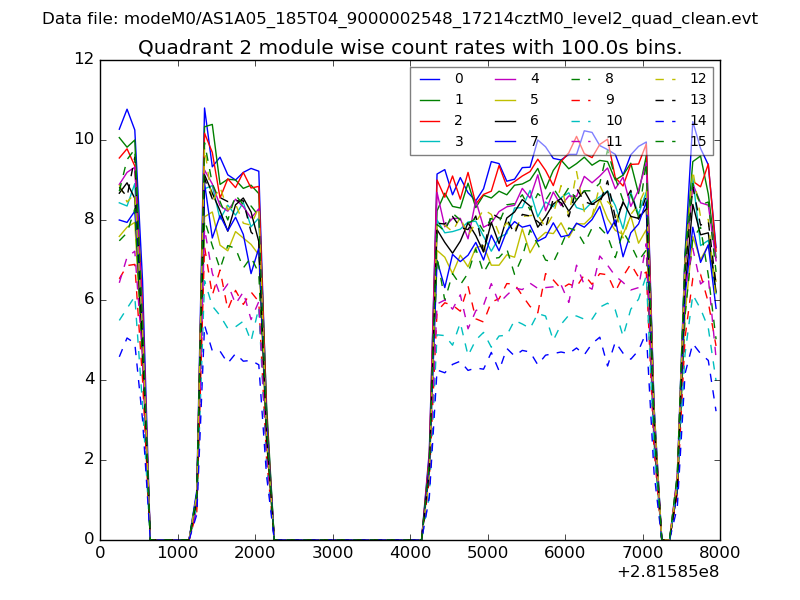
| Module-wise count rates for Quadrant B Data is divided into 100 sec bins |
 |
 |
| Module-wise count rates for Quadrant C Data is divided into 100 sec bins |
 |
 |
| Module-wise count rates for Quadrant D Data is divided into 100 sec bins |
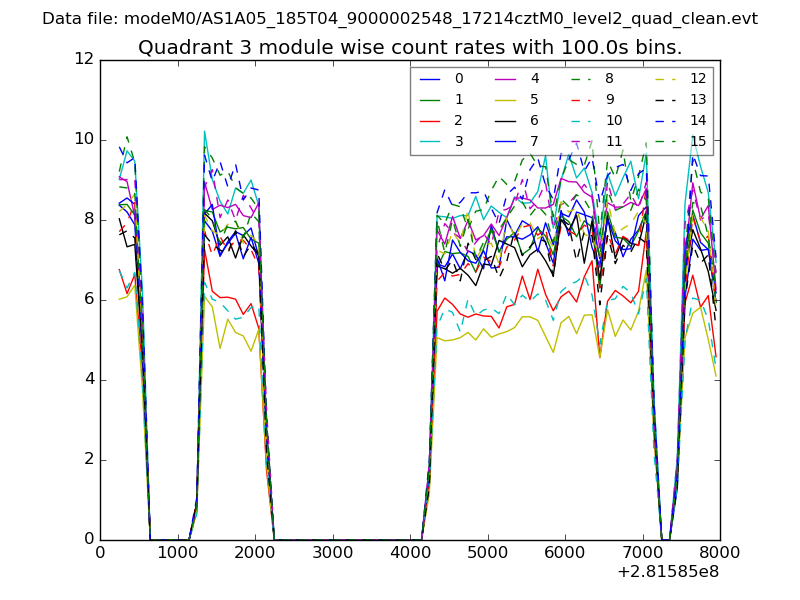 |
 |
| Parameter | Plot |
|---|---|
| CZT HV Monitor | 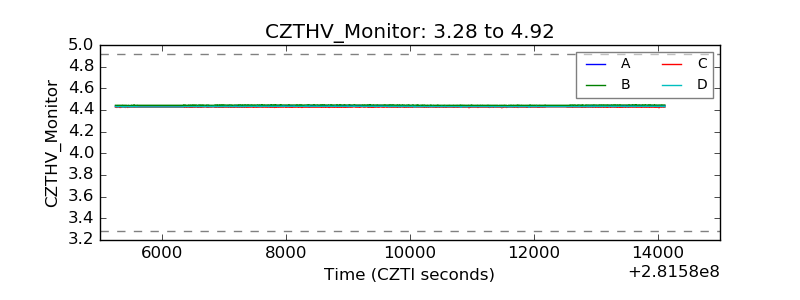 |
| D_VDD | 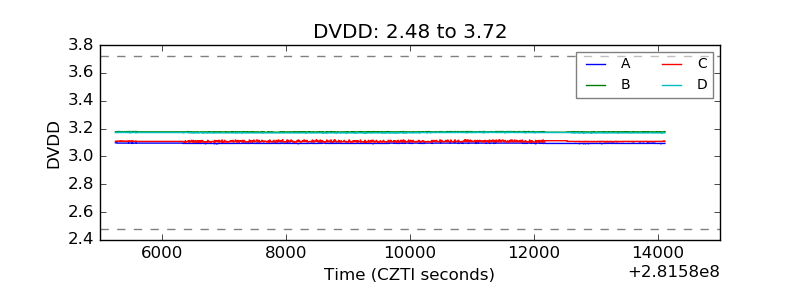 |
| Temperature 1 | 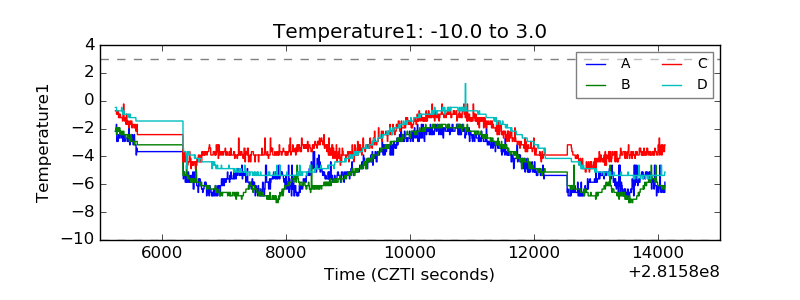 |
| Veto HV Monitor | 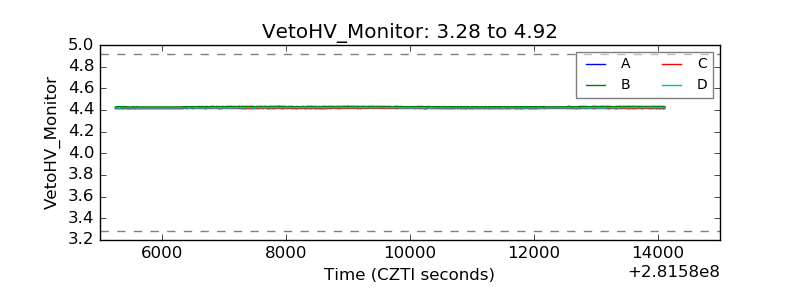 |
| Veto LLD | 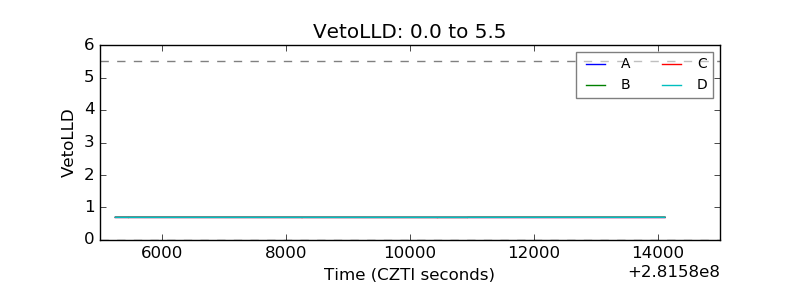 |
| Alpha Counter | 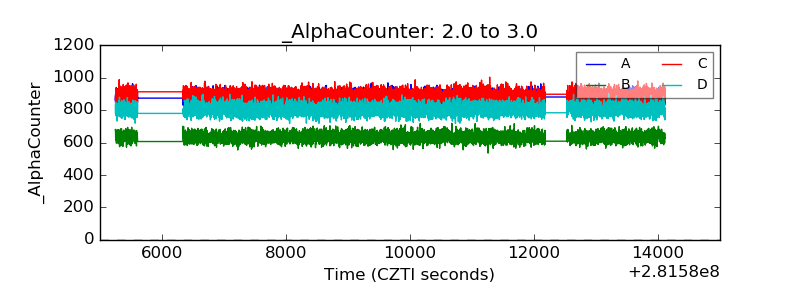 |
| _CPM_Rate | 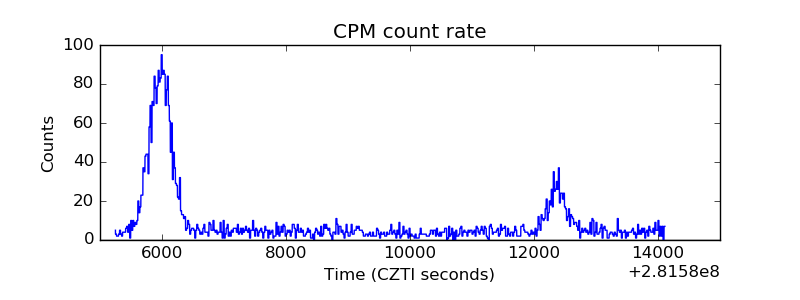 |
| CZT Counter | 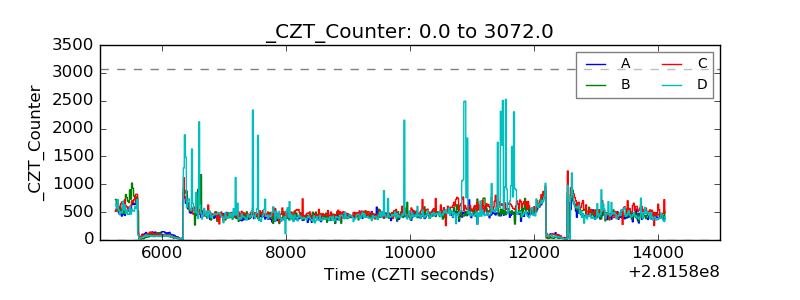 |
| +2.5 Volts monitor |  |
| +5 Volts monitor |  |
| _ROLL_ROT | 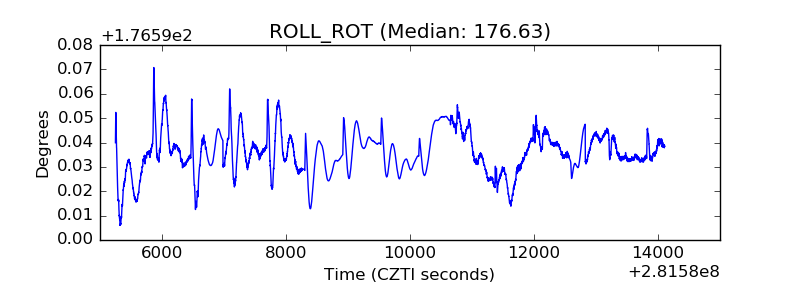 |
| _Roll_DEC | 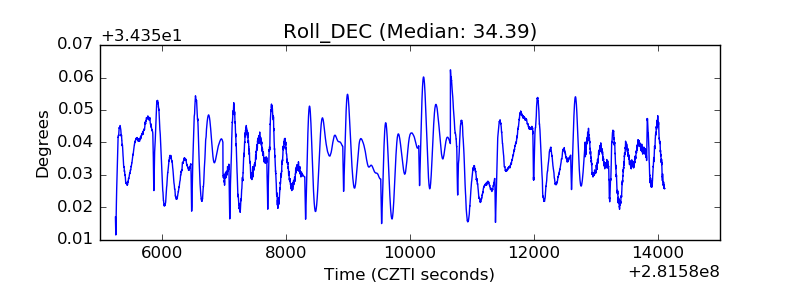 |
| _Roll_RA | 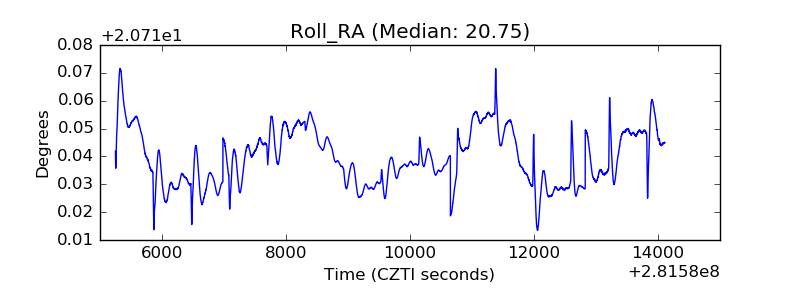 |
| Veto Counter | 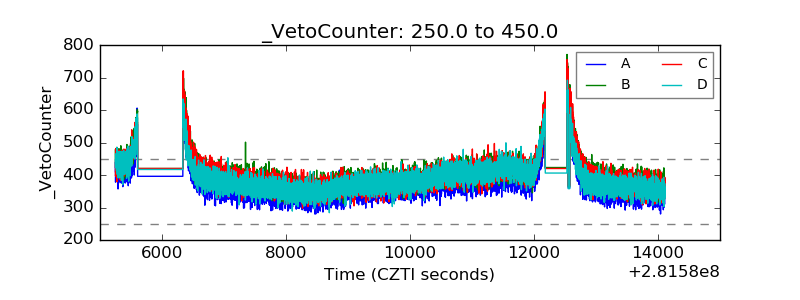 |