| Param | Original file | Final file |
|---|---|---|
| Filename | modeM0/AS1A05_185T04_9000002548_17220cztM0_level2.evt | modeM0/AS1A05_185T04_9000002548_17220cztM0_level2_quad_clean.evt |
| Size (bytes) | 421,188,480 | 96,586,560 |
| Size | 401.7 MB | 92.1 MB |
| Events in quadrant A | 2,846,972 | 643,654 |
| Events in quadrant B | 2,965,039 | 642,751 |
| Events in quadrant C | 3,066,762 | 607,544 |
| Events in quadrant D | 3,462,202 | 605,320 |
| Mode SS | |||
|---|---|---|---|
| Quadrant | BADHDUFLAG | Total packets | Discarded packets |
| A | 0 | 126 | 0 |
| B | 0 | 126 | 0 |
| C | 0 | 126 | 0 |
| D | 0 | 126 | 0 |
| Mode M9 | |||
|---|---|---|---|
| Quadrant | BADHDUFLAG | Total packets | Discarded packets |
| A | 0 | 10 | 0 |
| B | 0 | 10 | 0 |
| C | 0 | 10 | 0 |
| D | 0 | 10 | 0 |
| Mode M0 | |||
|---|---|---|---|
| Quadrant | BADHDUFLAG | Total packets | Discarded packets |
| A | 0 | 12562 | 1 |
| B | 0 | 12818 | 1 |
| C | 0 | 13019 | 1 |
| D | 0 | 14223 | 1 |
| Quadrant | Total seconds | Saturated seconds | Saturation percentage |
|---|---|---|---|
| A | 6093 | 37 | 0.607254% |
| B | 6093 | 45 | 0.738552% |
| C | 6093 | 56 | 0.919087% |
| D | 6094 | 86 | 1.411224% |
Noise dominated data is calculated using 1-second bins in cleaned event files. If a bin has >2000 counts, and if more than 50% of those come from <1% of pixels, then it is considered to be noise-dominated and hence unusable.
| Quadrant | # 1 sec bins | Bins with >0 counts | Bins with >2000 counts | High rate bins dominated by noise | Noise dominated (total time) | Noise dominated (detector-on time) | Marked lightcurve |
|---|---|---|---|---|---|---|---|
| A | 7163 | 6094 | 0 | 0 | 0.00% | 0.00% | 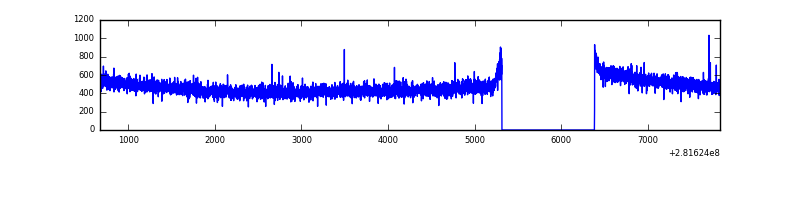 |
| B | 7163 | 6094 | 3 | 3 | 0.04% | 0.05% | 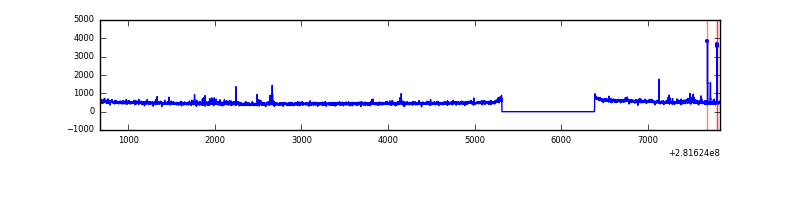 |
| C | 7163 | 6094 | 1 | 1 | 0.01% | 0.02% | 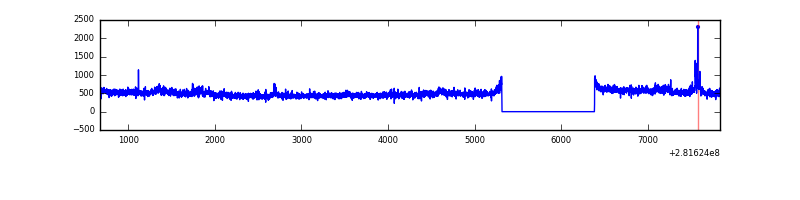 |
| D | 7164 | 6095 | 41 | 41 | 0.57% | 0.67% | 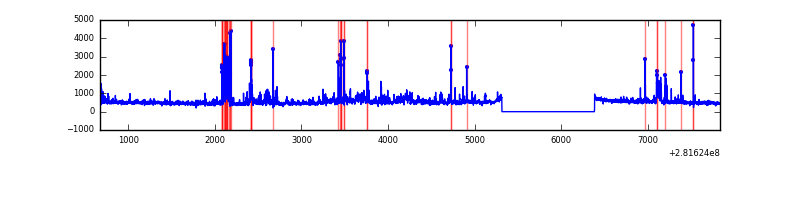 |
Top three noisy pixels from each quadrant. If the there are fewer than three noisy pixels in the level2.evt file, extra rows are filled as -1
| Pixel properties | Quadrant properties | ||||||
|---|---|---|---|---|---|---|---|
| Quadrant | DetID | PixID | Counts | Sigma | Mean | Median | Sigma |
| A | 0 | 226 | 6594 | 39.04 | 740 | 726 | 150.3 |
| A | 12 | 194 | 5565 | 32.19 | 740 | 726 | 150.3 |
| A | 3 | 137 | 5191 | 29.7 | 740 | 726 | 150.3 |
| B | 4 | 216 | 29706 | 207.21 | 729 | 711 | 139.9 |
| B | 0 | 219 | 29005 | 202.2 | 729 | 711 | 139.9 |
| B | 7 | 220 | 17023 | 116.57 | 729 | 711 | 139.9 |
| C | 3 | 233 | 232420 | 1426.27 | 699 | 703 | 162.5 |
| C | 14 | 238 | 108194 | 661.63 | 699 | 703 | 162.5 |
| C | 13 | 61 | 4984 | 26.35 | 699 | 703 | 162.5 |
| D | 1 | 52 | 233740 | 1339.26 | 717 | 696 | 174.0 |
| D | 5 | 222 | 227200 | 1301.68 | 717 | 696 | 174.0 |
| D | 10 | 70 | 111607 | 637.39 | 717 | 696 | 174.0 |
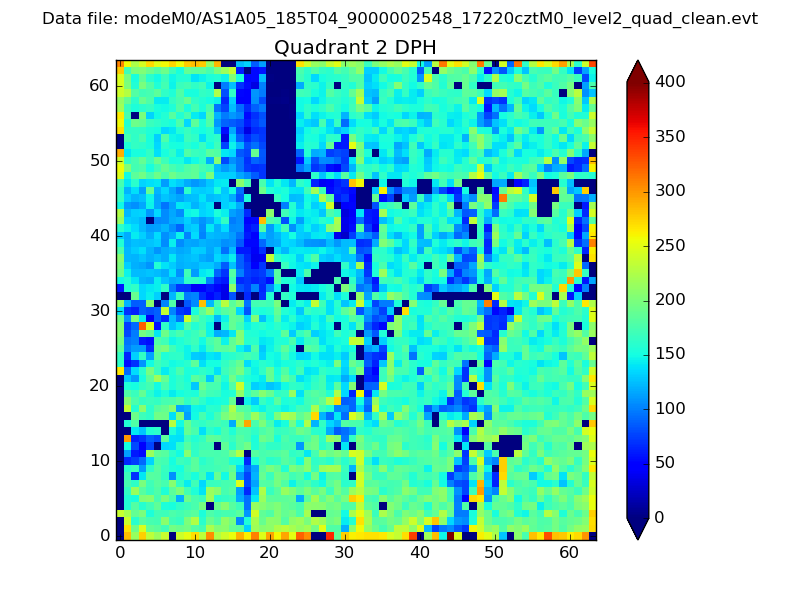
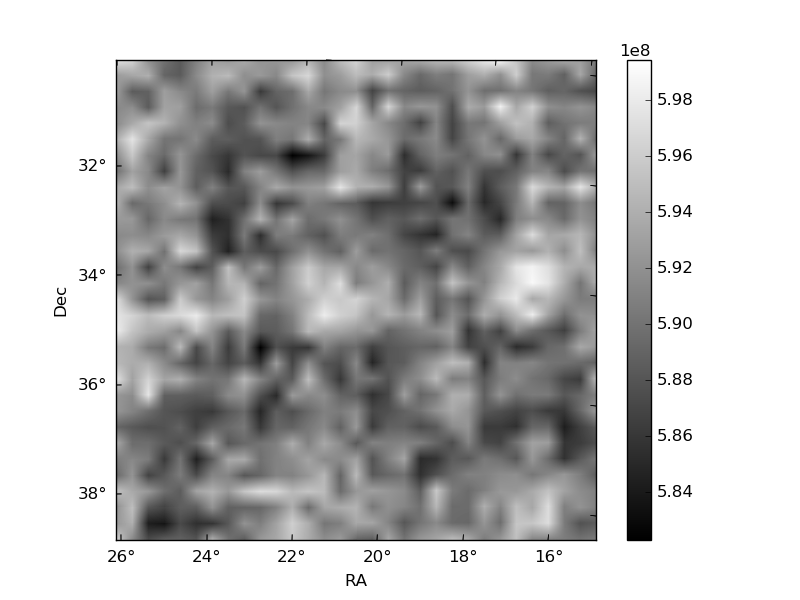
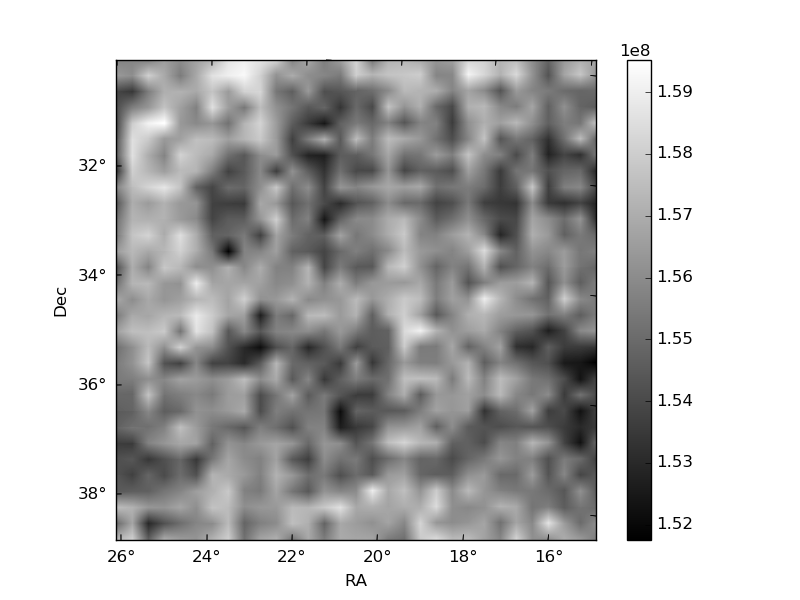
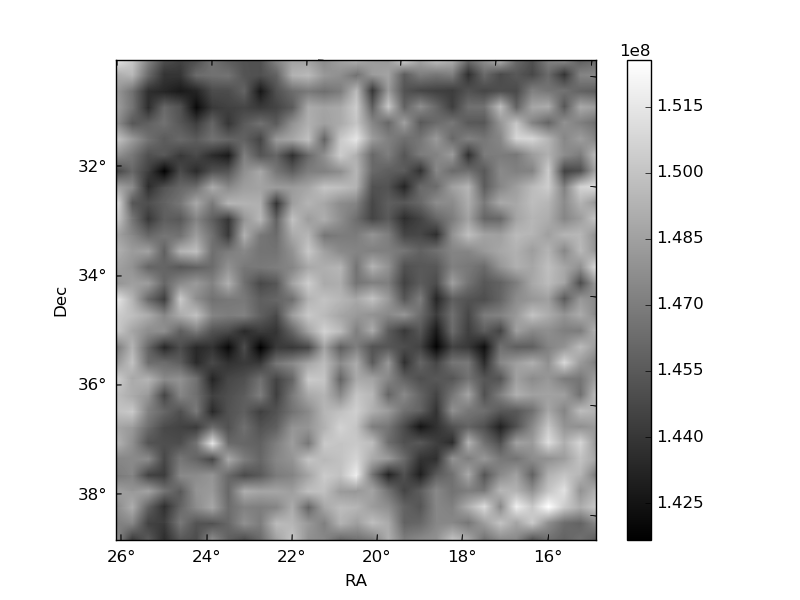
Histogram calculated using DETX and DETY for each event in the final _common_clean file
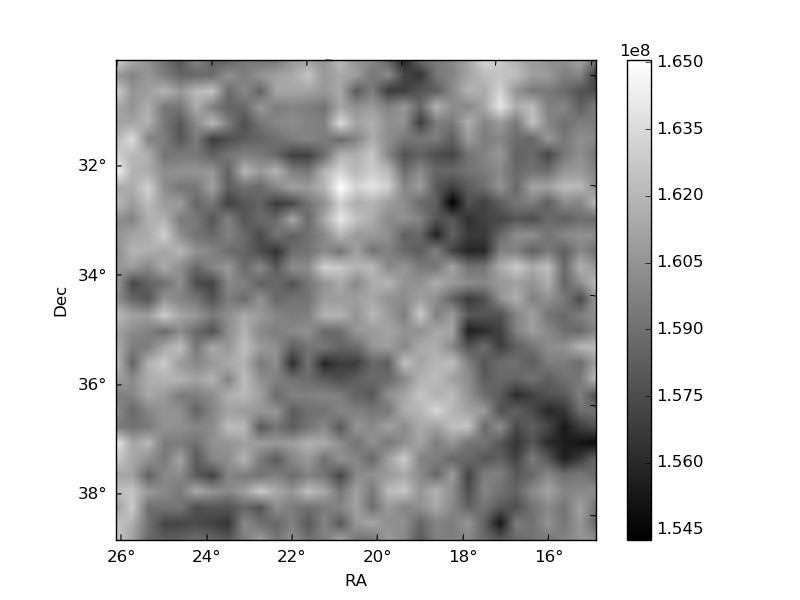
| Quadrant A | 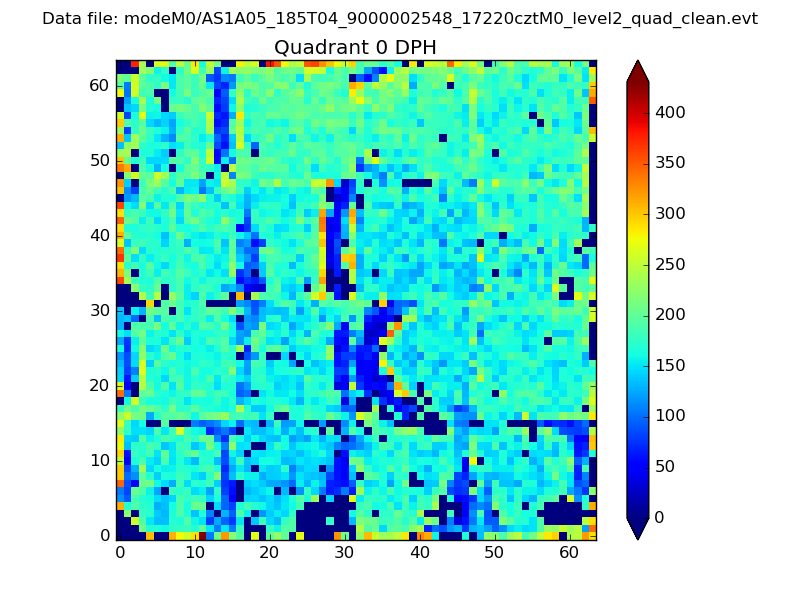 |
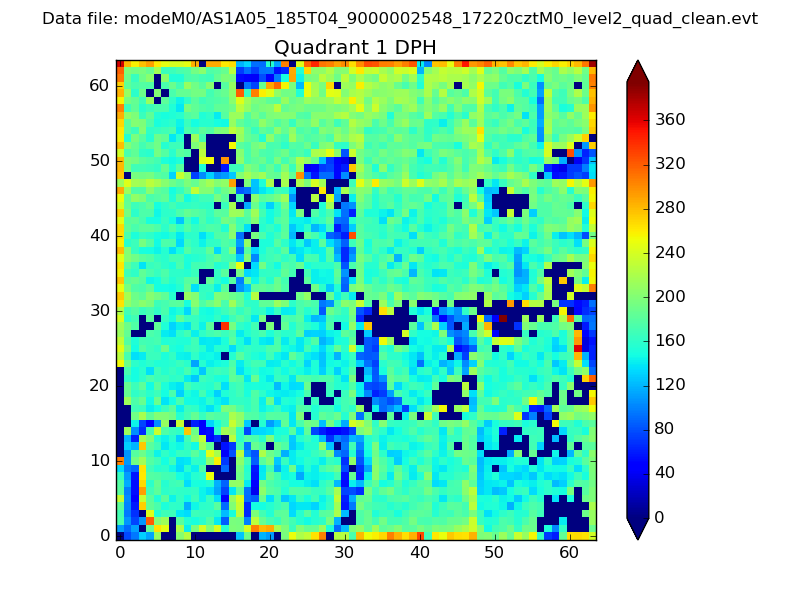 |
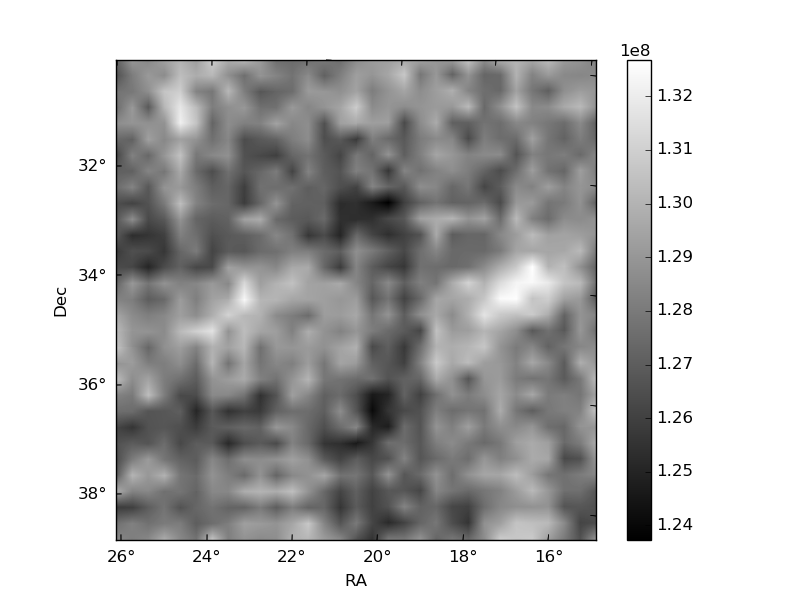
Quadrant B |
|---|---|---|---|
| Quadrant D | 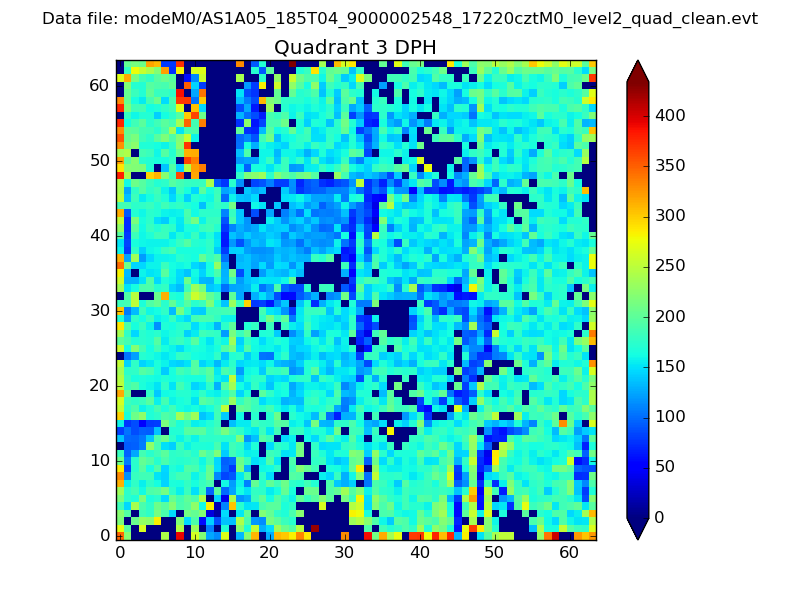 |
 |
Quadrant C |
| Plot type | Count rate plots | Images |
|---|---|---|
| Comparison with Poisson distribution Blue bars denote a histogram of data divided into 1 sec bins. Red curve is a Poisson curve with rate = median count rate of data. |
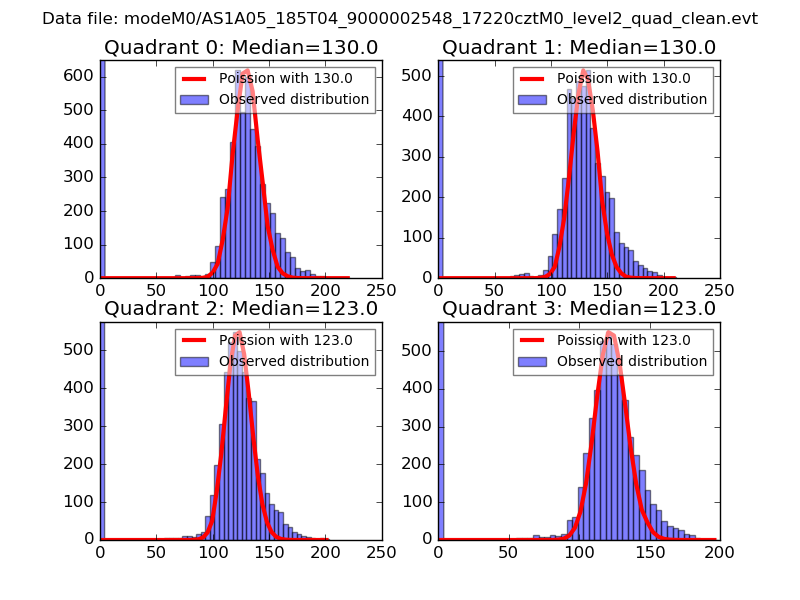 |
 |
| Quadrant-wise count rates Data is divided into 100 sec bins |
 |
|
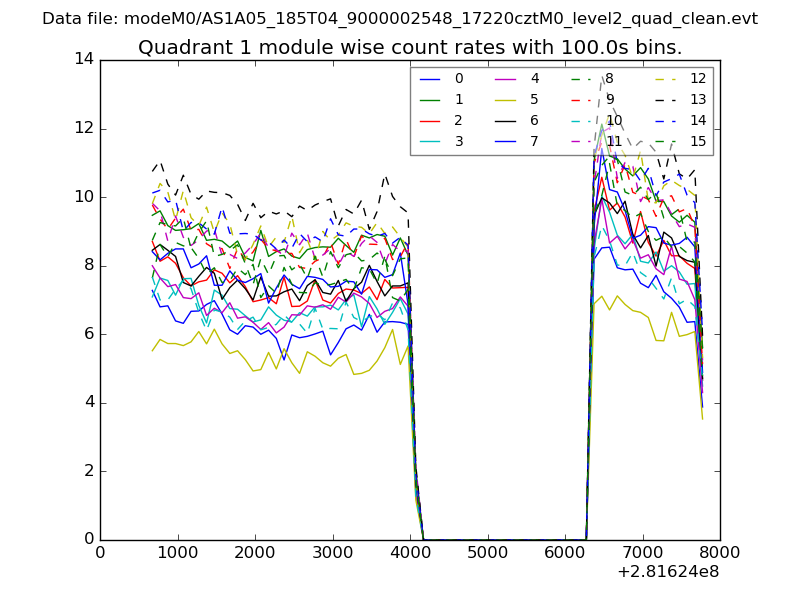
| Module-wise count rates for Quadrant A Data is divided into 100 sec bins |
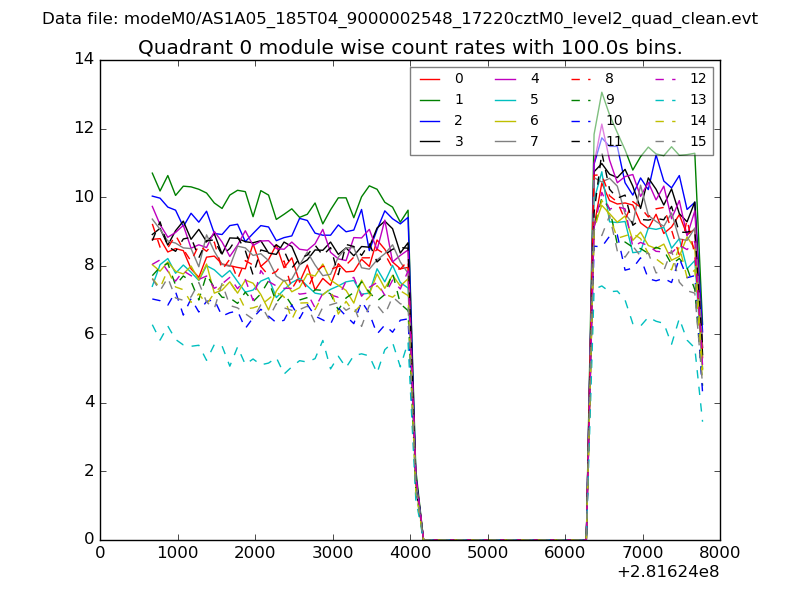 |
 |
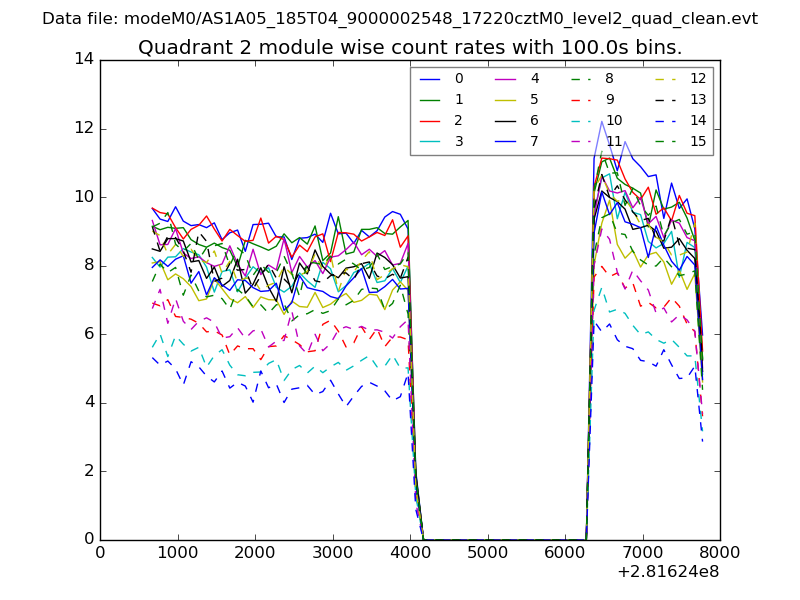
| Module-wise count rates for Quadrant B Data is divided into 100 sec bins |
 |
 |
| Module-wise count rates for Quadrant C Data is divided into 100 sec bins |
 |
 |
| Module-wise count rates for Quadrant D Data is divided into 100 sec bins |
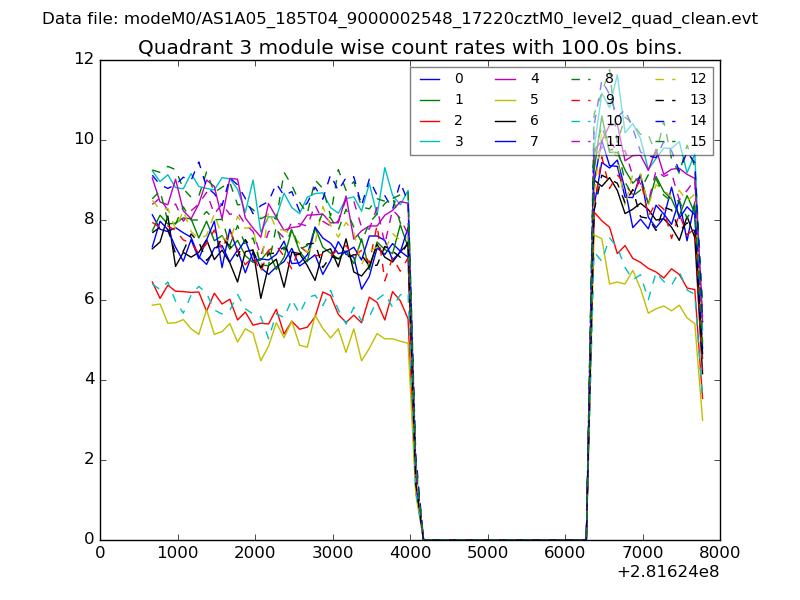 |
 |
| Parameter | Plot |
|---|---|
| CZT HV Monitor | 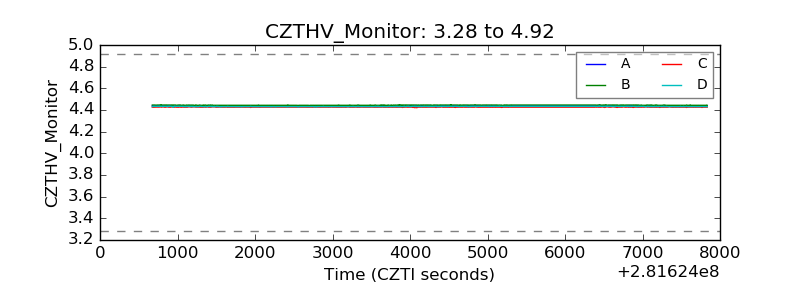 |
| D_VDD | 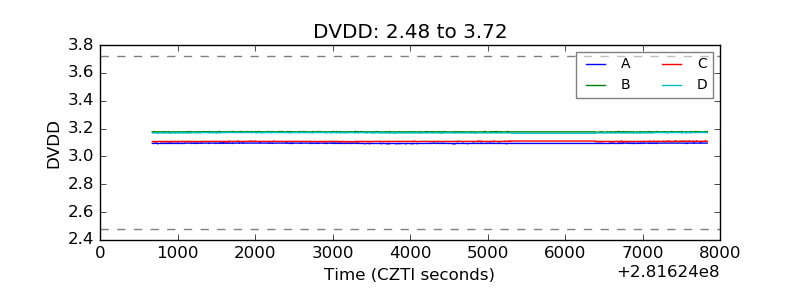 |
| Temperature 1 | 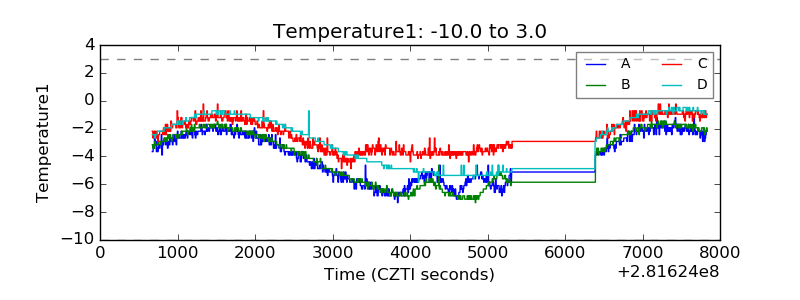 |
| Veto HV Monitor | 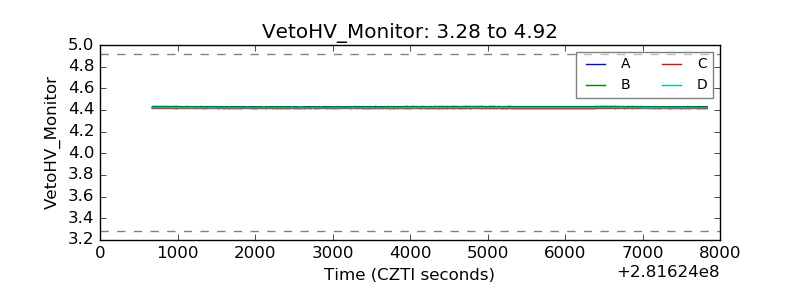 |
| Veto LLD | 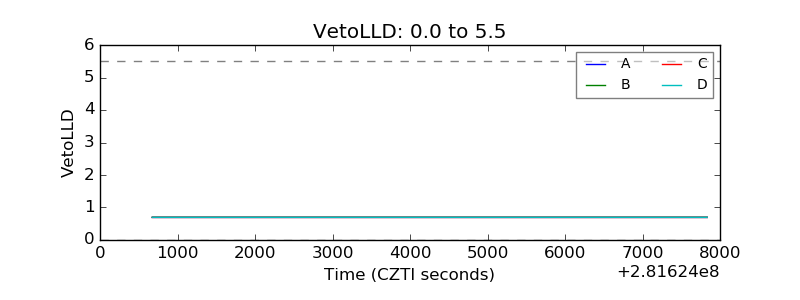 |
| Alpha Counter | 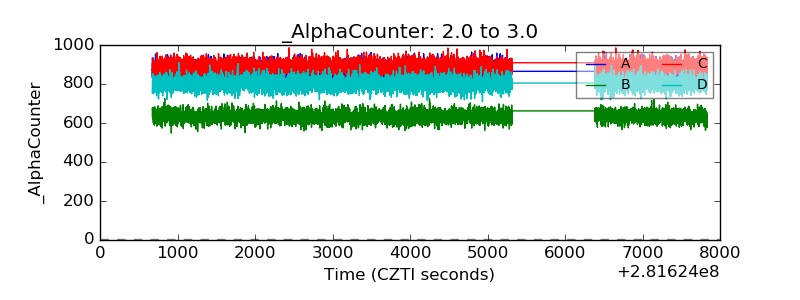 |
| _CPM_Rate | 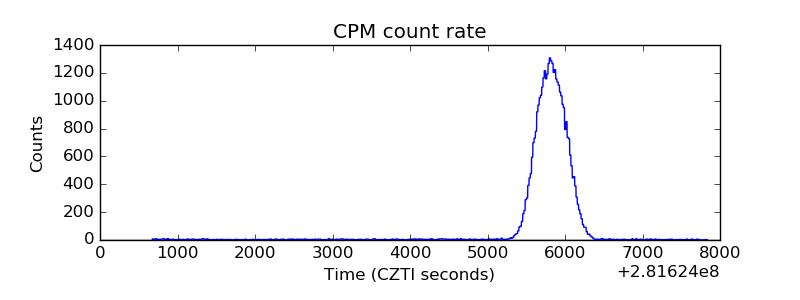 |
| CZT Counter | 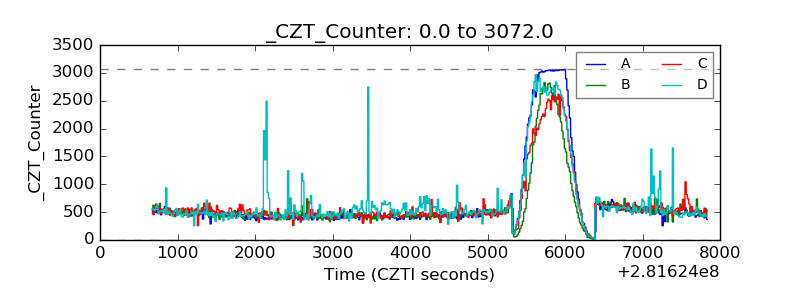 |
| +2.5 Volts monitor |  |
| +5 Volts monitor |  |
| _ROLL_ROT | 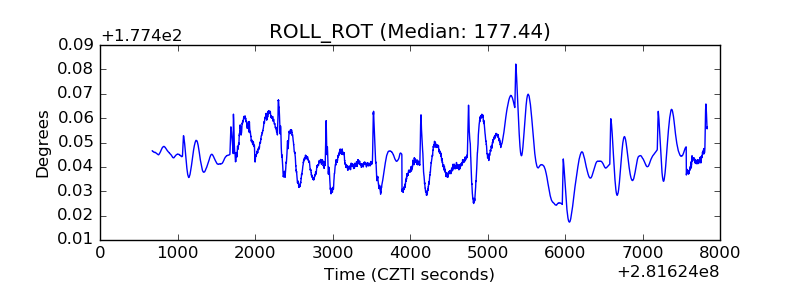 |
| _Roll_DEC | 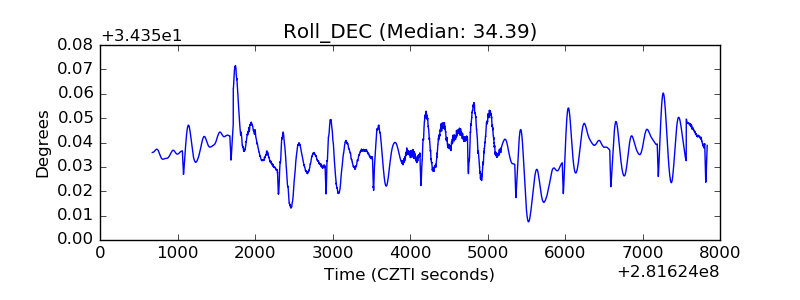 |
| _Roll_RA | 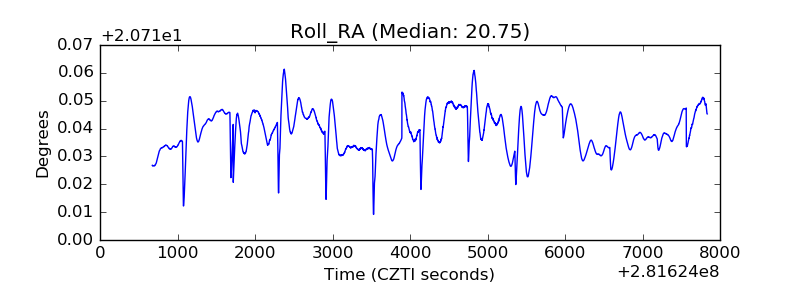 |
| Veto Counter | 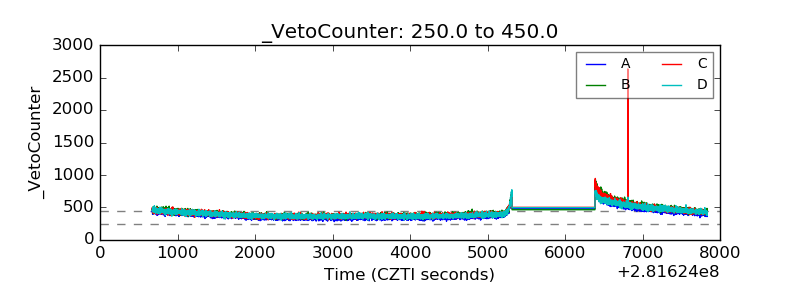 |