| Param | Original file | Final file |
|---|---|---|
| Filename | modeM0/AS1A05_185T04_9000002548_17224cztM0_level2.evt | modeM0/AS1A05_185T04_9000002548_17224cztM0_level2_quad_clean.evt |
| Size (bytes) | 455,227,200 | 92,304,000 |
| Size | 434.1 MB | 88.0 MB |
| Events in quadrant A | 3,059,689 | 611,994 |
| Events in quadrant B | 3,242,016 | 612,812 |
| Events in quadrant C | 3,860,697 | 570,719 |
| Events in quadrant D | 3,208,950 | 572,956 |
| Mode SS | |||
|---|---|---|---|
| Quadrant | BADHDUFLAG | Total packets | Discarded packets |
| A | 0 | 124 | 0 |
| B | 0 | 124 | 0 |
| C | 0 | 124 | 0 |
| D | 0 | 124 | 0 |
| Mode M9 | |||
|---|---|---|---|
| Quadrant | BADHDUFLAG | Total packets | Discarded packets |
| A | 0 | 15 | 0 |
| B | 0 | 16 | 0 |
| C | 0 | 16 | 0 |
| D | 0 | 16 | 0 |
| Mode M0 | |||
|---|---|---|---|
| Quadrant | BADHDUFLAG | Total packets | Discarded packets |
| A | 0 | 12991 | 2 |
| B | 0 | 13567 | 2 |
| C | 0 | 15542 | 2 |
| D | 0 | 13594 | 2 |
| Quadrant | Total seconds | Saturated seconds | Saturation percentage |
|---|---|---|---|
| A | 6114 | 73 | 1.193981% |
| B | 6114 | 72 | 1.177625% |
| C | 6114 | 142 | 2.322538% |
| D | 6114 | 84 | 1.373896% |
Noise dominated data is calculated using 1-second bins in cleaned event files. If a bin has >2000 counts, and if more than 50% of those come from <1% of pixels, then it is considered to be noise-dominated and hence unusable.
| Quadrant | # 1 sec bins | Bins with >0 counts | Bins with >2000 counts | High rate bins dominated by noise | Noise dominated (total time) | Noise dominated (detector-on time) | Marked lightcurve |
|---|---|---|---|---|---|---|---|
| A | 7414 | 6115 | 0 | 0 | 0.00% | 0.00% | 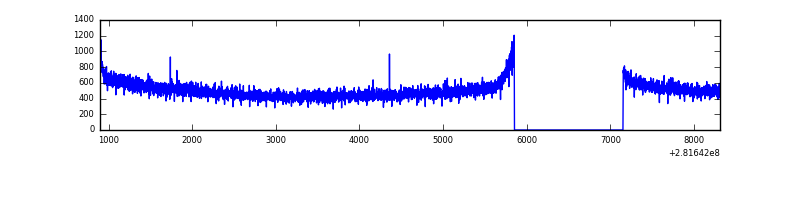 |
| B | 7414 | 6115 | 1 | 1 | 0.01% | 0.02% | 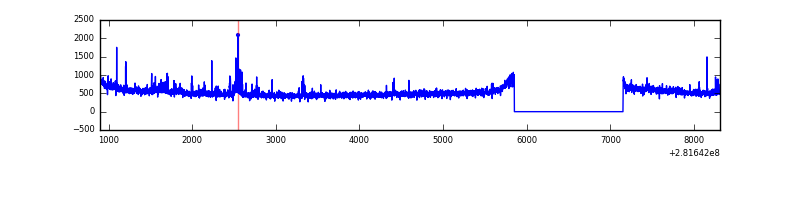 |
| C | 7414 | 6115 | 0 | 0 | 0.00% | 0.00% | 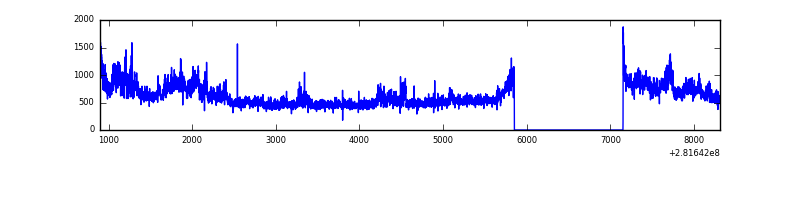 |
| D | 7414 | 6115 | 25 | 25 | 0.34% | 0.41% | 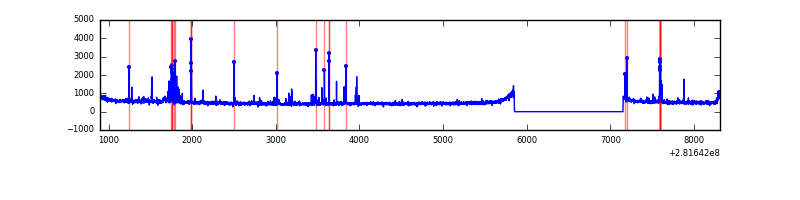 |
Top three noisy pixels from each quadrant. If the there are fewer than three noisy pixels in the level2.evt file, extra rows are filled as -1
| Pixel properties | Quadrant properties | ||||||
|---|---|---|---|---|---|---|---|
| Quadrant | DetID | PixID | Counts | Sigma | Mean | Median | Sigma |
| A | 0 | 226 | 7280 | 41.02 | 794 | 778 | 158.5 |
| A | 12 | 194 | 5933 | 32.53 | 794 | 778 | 158.5 |
| A | 3 | 137 | 5254 | 28.24 | 794 | 778 | 158.5 |
| B | 4 | 216 | 27812 | 182.17 | 792 | 773 | 148.4 |
| B | 6 | 36 | 26410 | 172.73 | 792 | 773 | 148.4 |
| B | 0 | 219 | 25546 | 166.91 | 792 | 773 | 148.4 |
| C | 3 | 233 | 788644 | 4466.42 | 757 | 763 | 176.4 |
| C | 14 | 238 | 118260 | 666.08 | 757 | 763 | 176.4 |
| C | 13 | 61 | 5379 | 26.17 | 757 | 763 | 176.4 |
| D | 5 | 222 | 85461 | 454.61 | 775 | 756 | 186.3 |
| D | 13 | 189 | 48088 | 254.03 | 775 | 756 | 186.3 |
| D | 10 | 70 | 39220 | 206.44 | 775 | 756 | 186.3 |
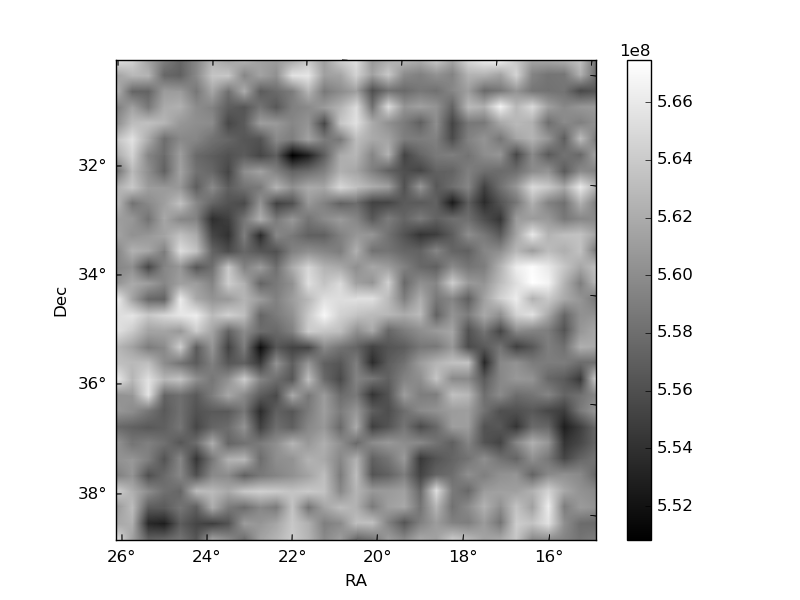
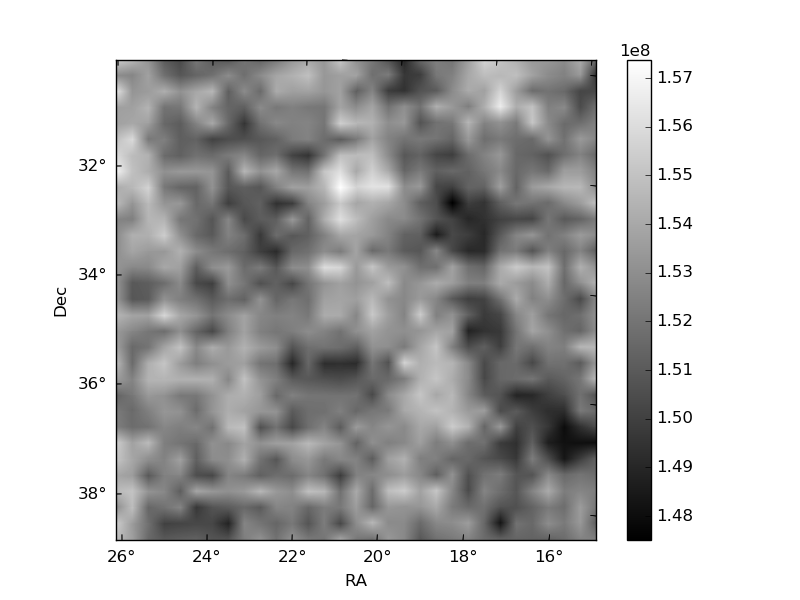
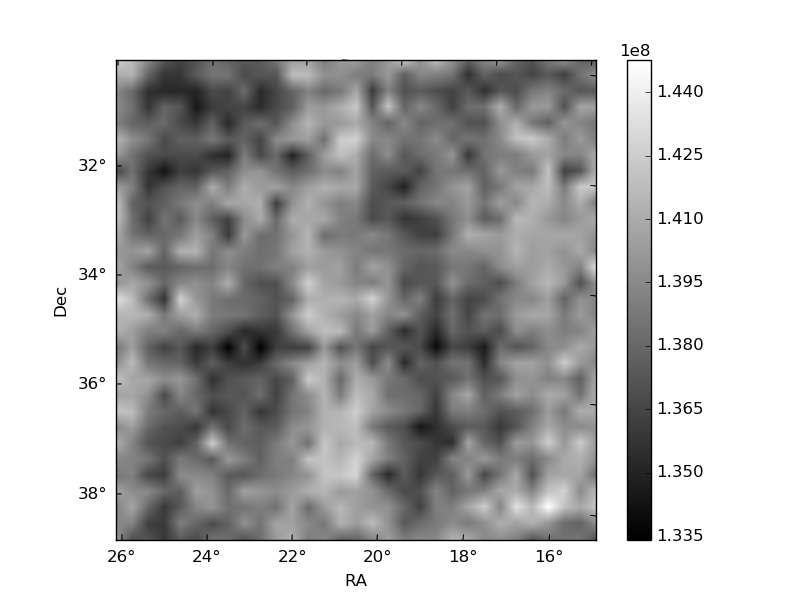
Histogram calculated using DETX and DETY for each event in the final _common_clean file
| Quadrant A | 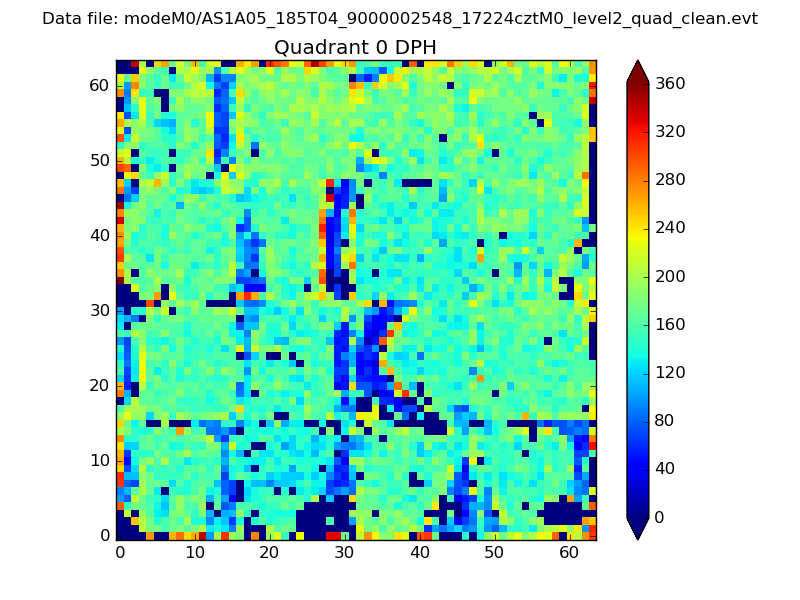 |
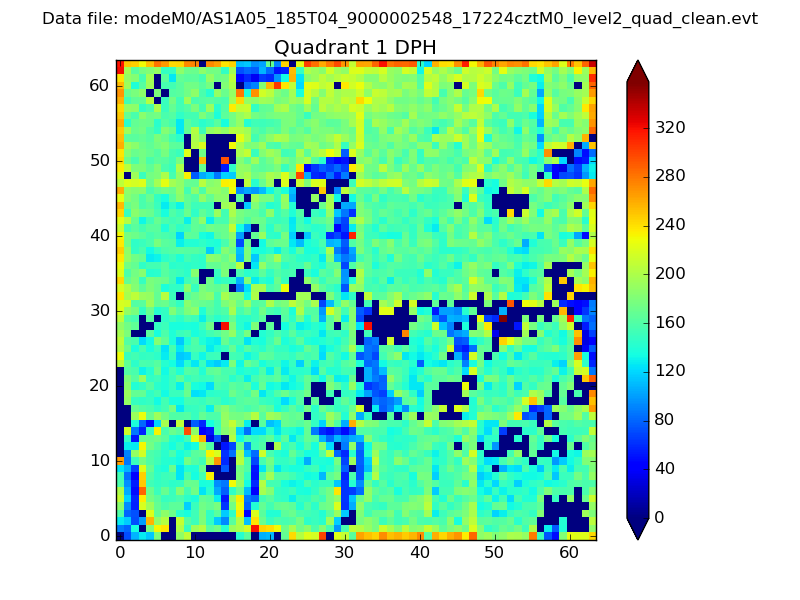 |
Quadrant B |
|---|---|---|---|
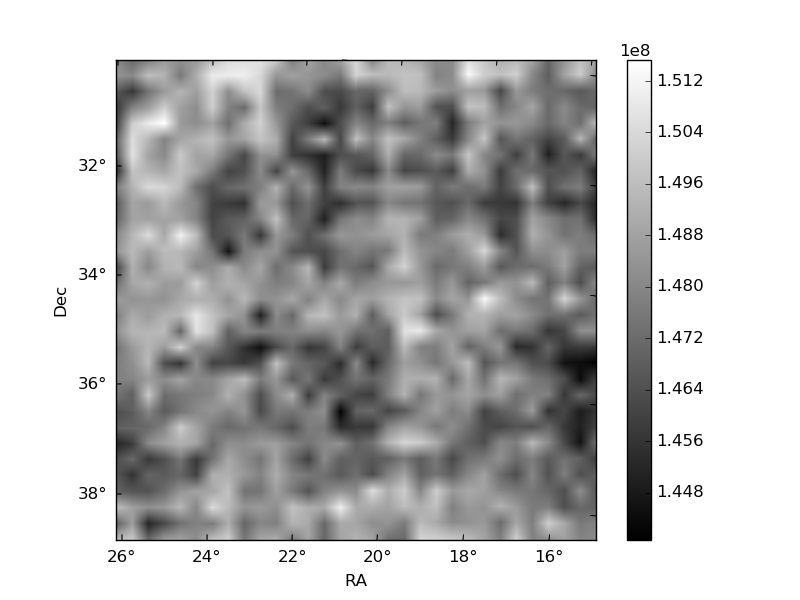
| Quadrant D | 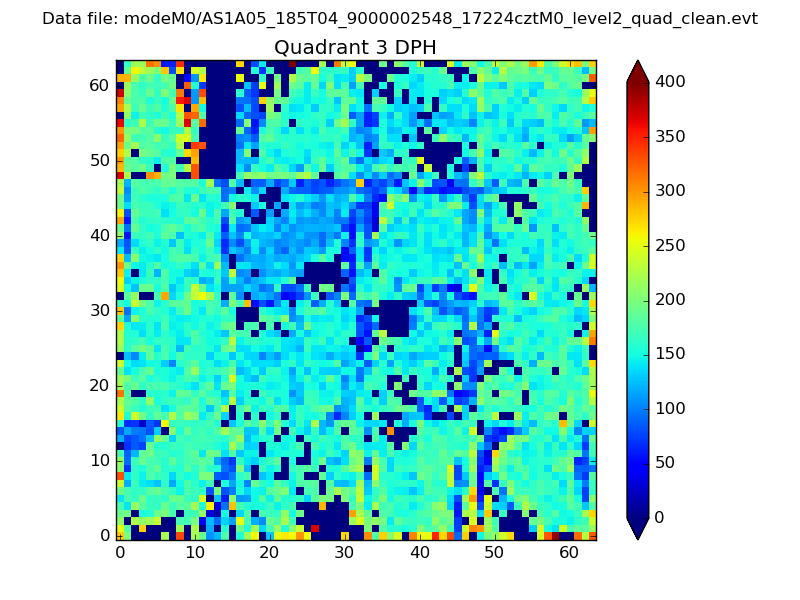 |
 |
Quadrant C |
| Plot type | Count rate plots | Images |
|---|---|---|
| Comparison with Poisson distribution Blue bars denote a histogram of data divided into 1 sec bins. Red curve is a Poisson curve with rate = median count rate of data. |
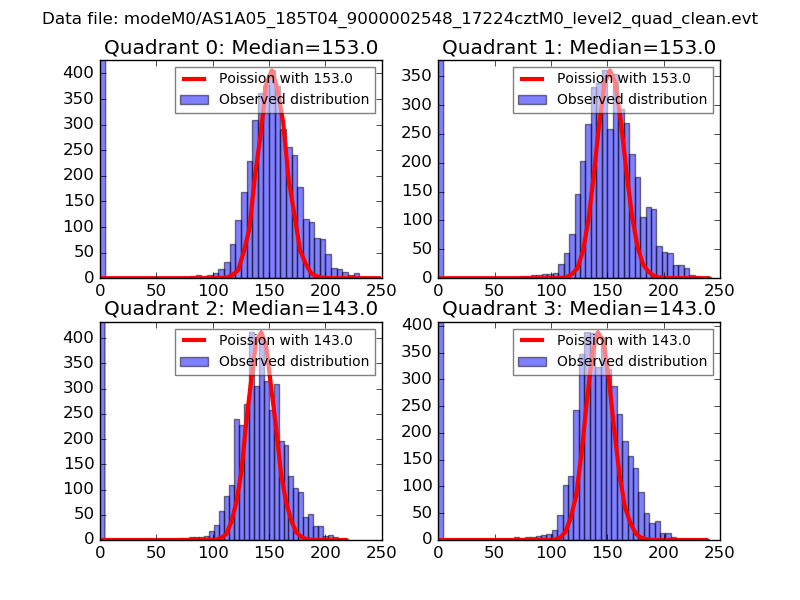 |
 |
| Quadrant-wise count rates Data is divided into 100 sec bins |
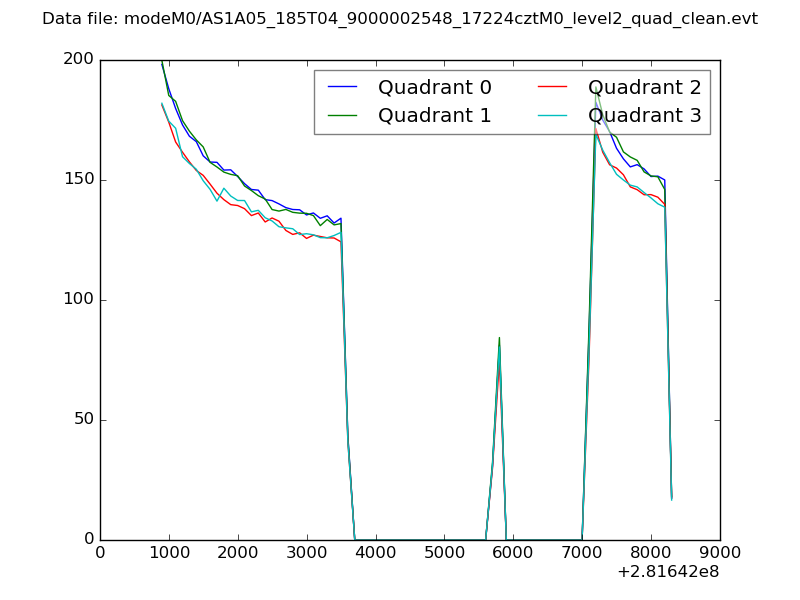 |
|
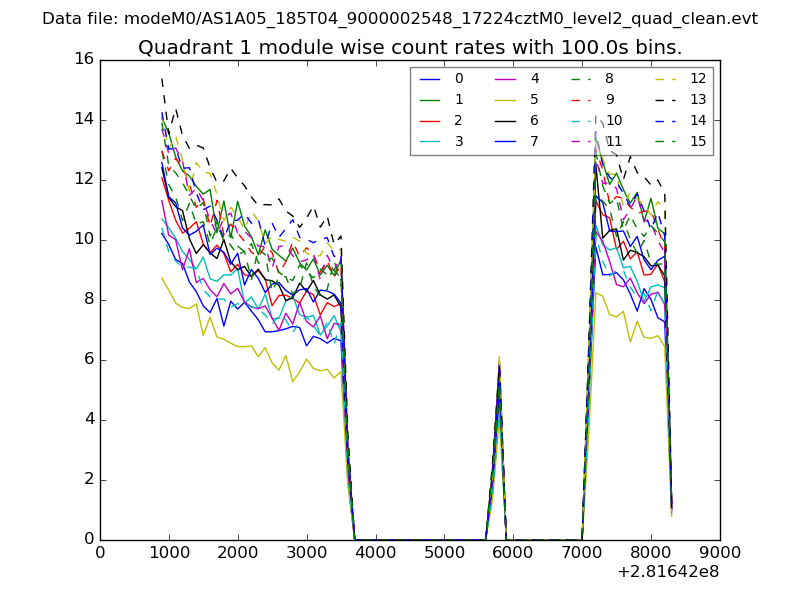
| Module-wise count rates for Quadrant A Data is divided into 100 sec bins |
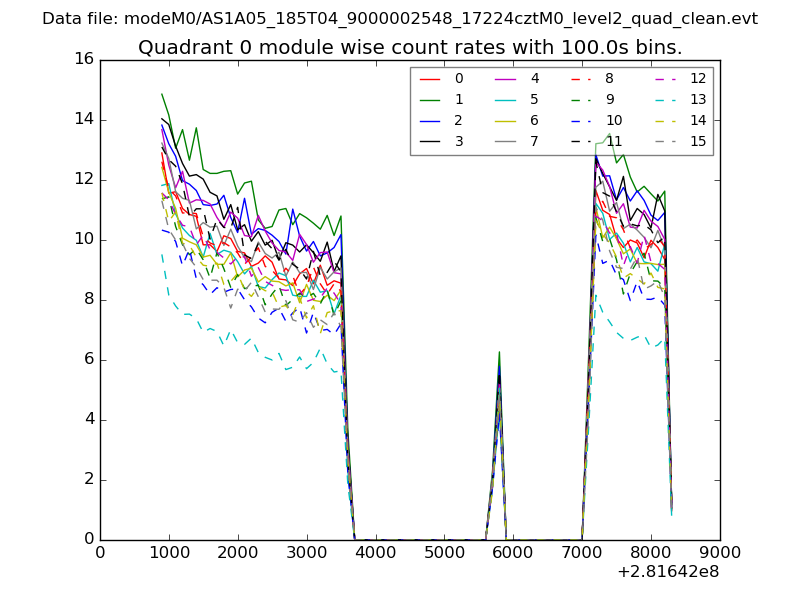 |
 |
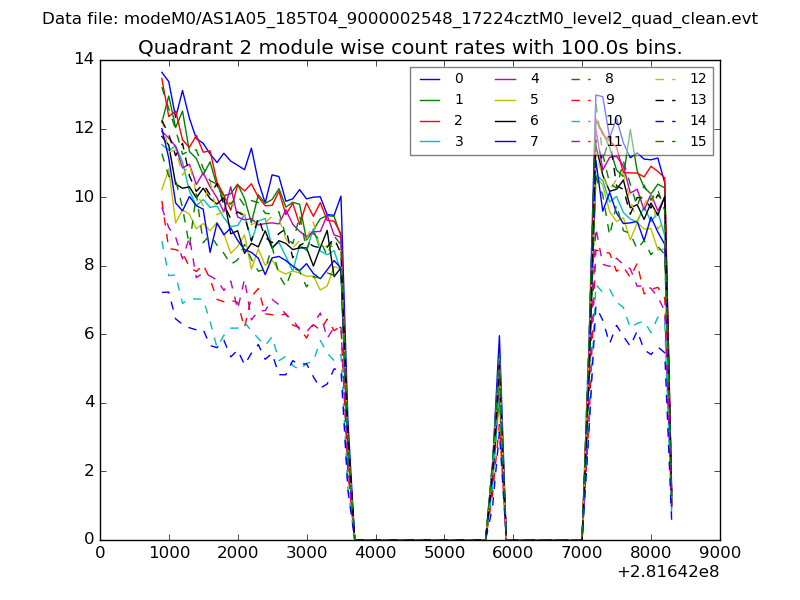
| Module-wise count rates for Quadrant B Data is divided into 100 sec bins |
 |
 |
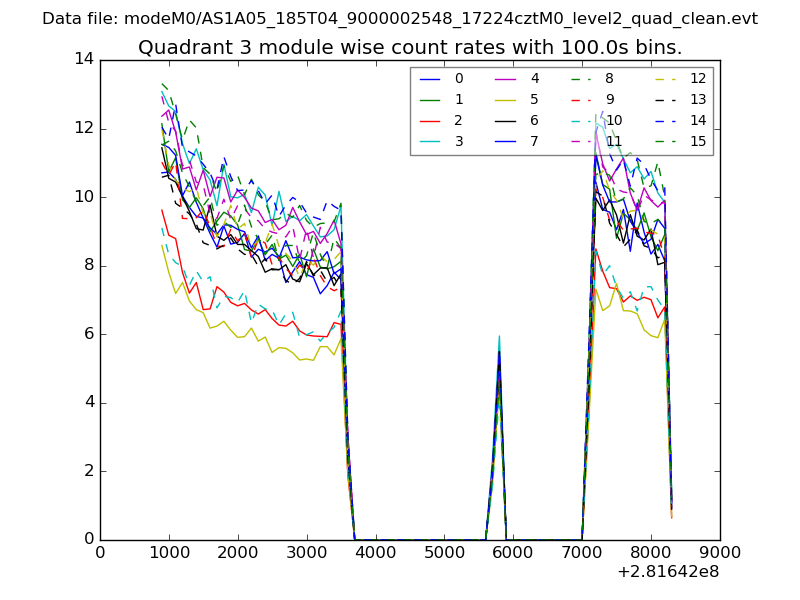
| Module-wise count rates for Quadrant C Data is divided into 100 sec bins |
 |
 |
| Module-wise count rates for Quadrant D Data is divided into 100 sec bins |
 |
 |
| Parameter | Plot |
|---|---|
| CZT HV Monitor | 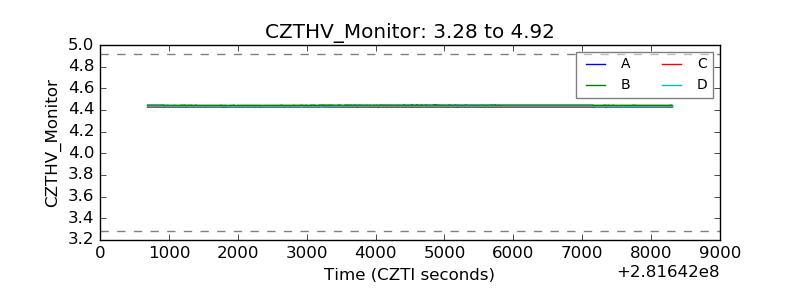 |
| D_VDD | 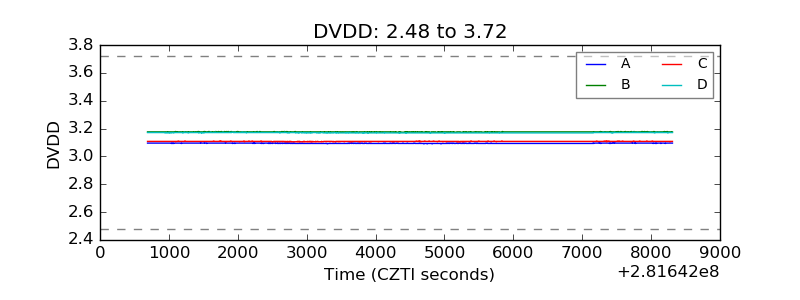 |
| Temperature 1 | 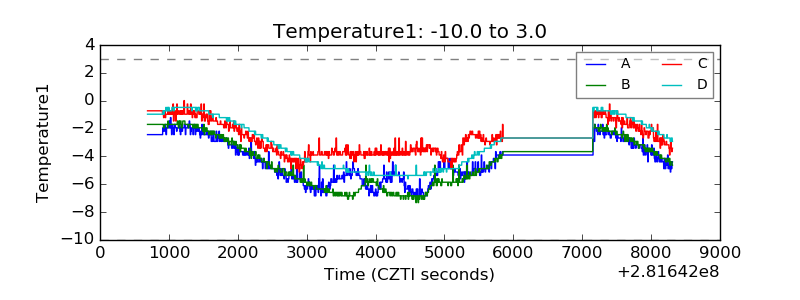 |
| Veto HV Monitor | 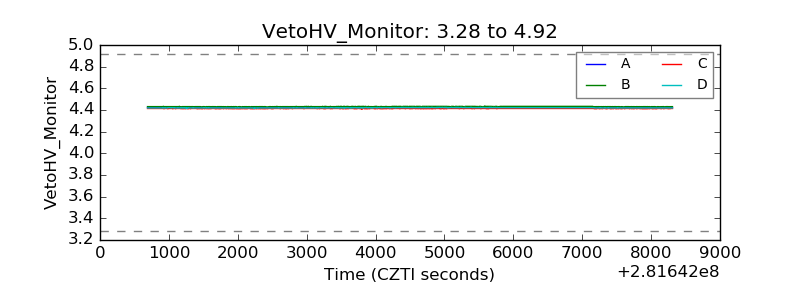 |
| Veto LLD | 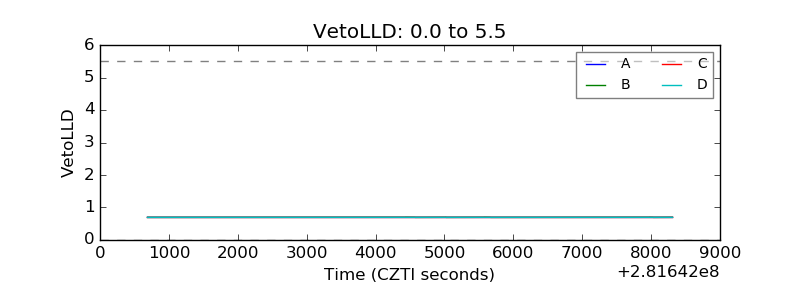 |
| Alpha Counter | 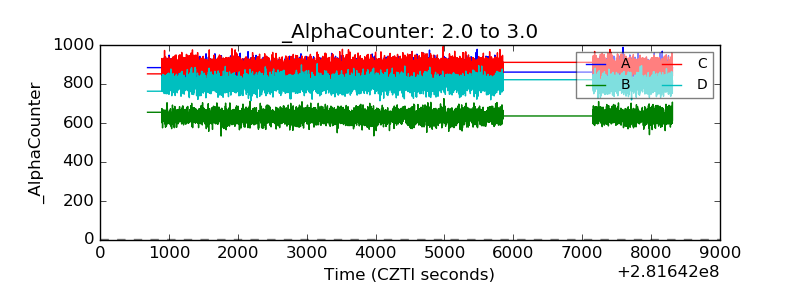 |
| _CPM_Rate | 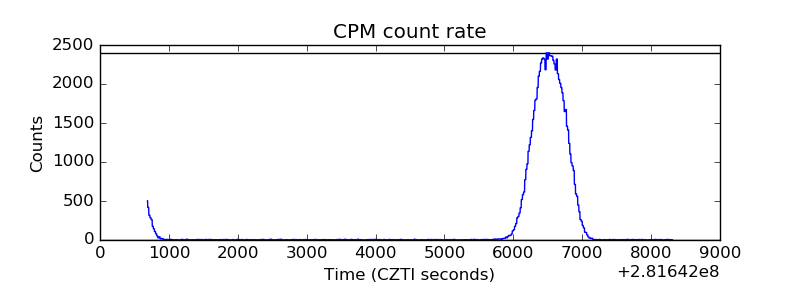 |
| CZT Counter | 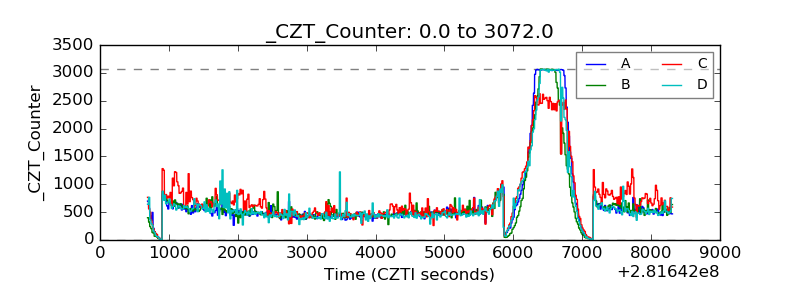 |
| +2.5 Volts monitor | 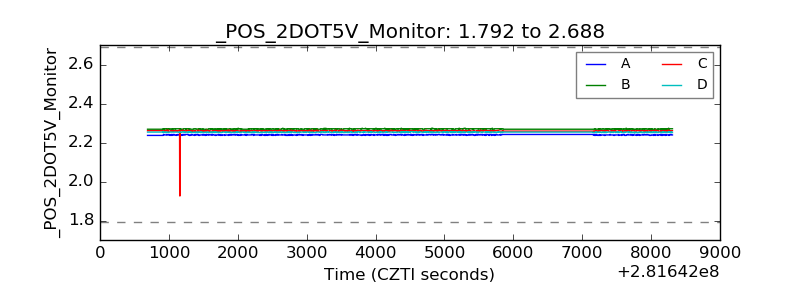 |
| +5 Volts monitor |  |
| _ROLL_ROT | 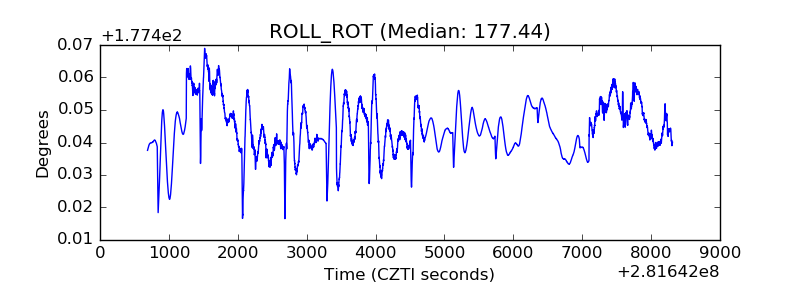 |
| _Roll_DEC |  |
| _Roll_RA |  |
| Veto Counter | 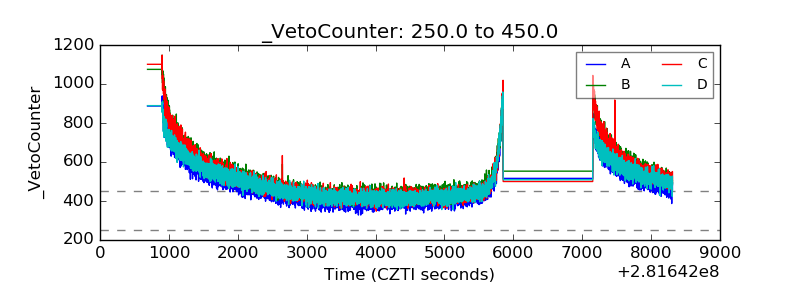 |