| Param | Original file | Final file |
|---|---|---|
| Filename | modeM0/AS1A05_185T04_9000002548_17225cztM0_level2.evt | modeM0/AS1A05_185T04_9000002548_17225cztM0_level2_quad_clean.evt |
| Size (bytes) | 447,079,680 | 92,845,440 |
| Size | 426.4 MB | 88.5 MB |
| Events in quadrant A | 3,041,540 | 610,171 |
| Events in quadrant B | 3,185,489 | 616,509 |
| Events in quadrant C | 3,609,267 | 576,786 |
| Events in quadrant D | 3,278,534 | 571,616 |
| Mode SS | |||
|---|---|---|---|
| Quadrant | BADHDUFLAG | Total packets | Discarded packets |
| A | 0 | 128 | 0 |
| B | 0 | 128 | 0 |
| C | 0 | 128 | 0 |
| D | 0 | 128 | 0 |
| Mode M9 | |||
|---|---|---|---|
| Quadrant | BADHDUFLAG | Total packets | Discarded packets |
| A | 0 | 21 | 0 |
| B | 0 | 22 | 0 |
| C | 0 | 22 | 0 |
| D | 0 | 22 | 0 |
| Mode M0 | |||
|---|---|---|---|
| Quadrant | BADHDUFLAG | Total packets | Discarded packets |
| A | 0 | 13036 | 2 |
| B | 0 | 13427 | 2 |
| C | 0 | 14782 | 2 |
| D | 0 | 13955 | 2 |
| Quadrant | Total seconds | Saturated seconds | Saturation percentage |
|---|---|---|---|
| A | 6252 | 37 | 0.591811% |
| B | 6252 | 37 | 0.591811% |
| C | 6252 | 103 | 1.647473% |
| D | 6251 | 88 | 1.407775% |
Noise dominated data is calculated using 1-second bins in cleaned event files. If a bin has >2000 counts, and if more than 50% of those come from <1% of pixels, then it is considered to be noise-dominated and hence unusable.
| Quadrant | # 1 sec bins | Bins with >0 counts | Bins with >2000 counts | High rate bins dominated by noise | Noise dominated (total time) | Noise dominated (detector-on time) | Marked lightcurve |
|---|---|---|---|---|---|---|---|
| A | 7557 | 6253 | 0 | 0 | 0.00% | 0.00% | 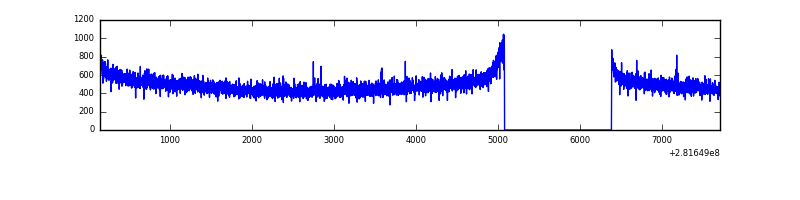 |
| B | 7557 | 6253 | 1 | 1 | 0.01% | 0.02% | 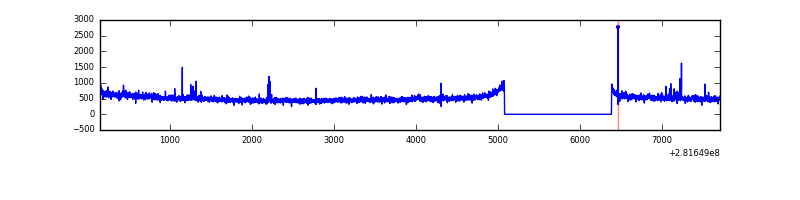 |
| C | 7557 | 6253 | 0 | 0 | 0.00% | 0.00% | 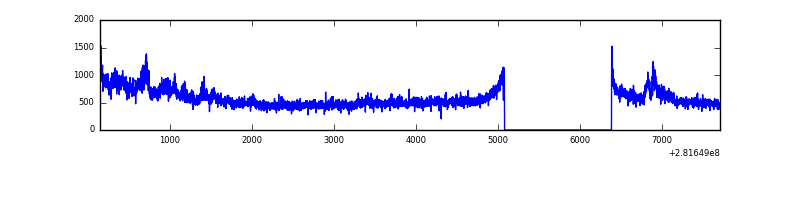 |
| D | 7556 | 6252 | 42 | 42 | 0.56% | 0.67% | 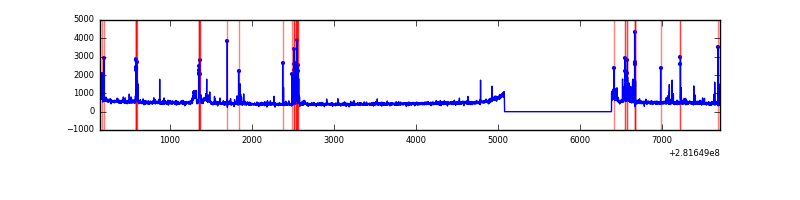 |
Top three noisy pixels from each quadrant. If the there are fewer than three noisy pixels in the level2.evt file, extra rows are filled as -1
| Pixel properties | Quadrant properties | ||||||
|---|---|---|---|---|---|---|---|
| Quadrant | DetID | PixID | Counts | Sigma | Mean | Median | Sigma |
| A | 0 | 226 | 7519 | 42.76 | 789 | 773 | 157.7 |
| A | 0 | 23 | 6484 | 36.2 | 789 | 773 | 157.7 |
| A | 12 | 194 | 5817 | 31.97 | 789 | 773 | 157.7 |
| B | 0 | 189 | 23699 | 155.32 | 791 | 770 | 147.6 |
| B | 0 | 219 | 22203 | 145.19 | 791 | 770 | 147.6 |
| B | 0 | 198 | 20826 | 135.86 | 791 | 770 | 147.6 |
| C | 3 | 233 | 529687 | 2979.09 | 759 | 763 | 177.5 |
| C | 14 | 238 | 117855 | 659.51 | 759 | 763 | 177.5 |
| C | 13 | 61 | 5480 | 26.57 | 759 | 763 | 177.5 |
| D | 10 | 70 | 158543 | 849.11 | 768 | 746 | 185.8 |
| D | 1 | 52 | 90666 | 483.86 | 768 | 746 | 185.8 |
| D | 13 | 189 | 56202 | 298.41 | 768 | 746 | 185.8 |
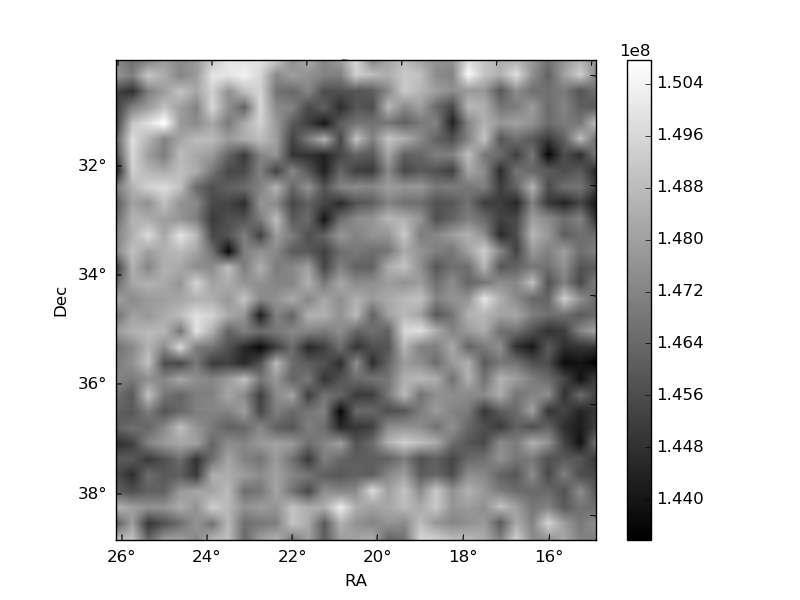
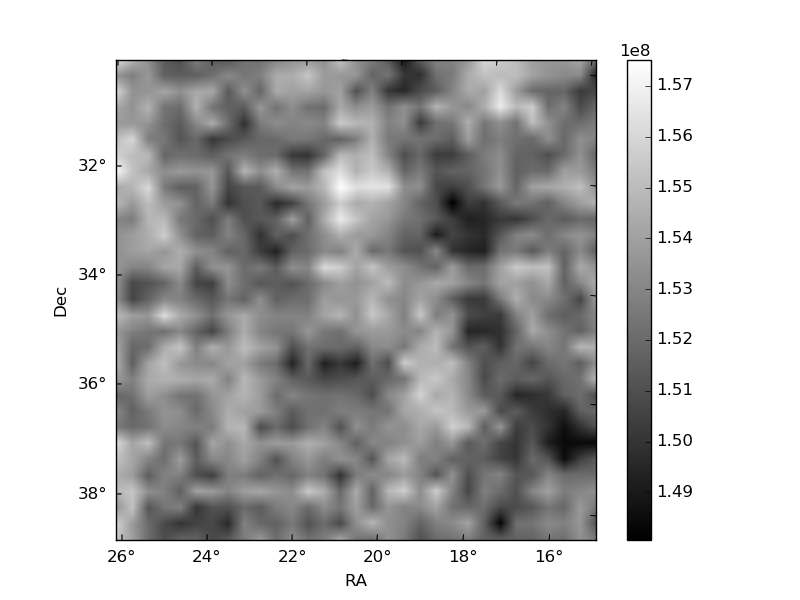
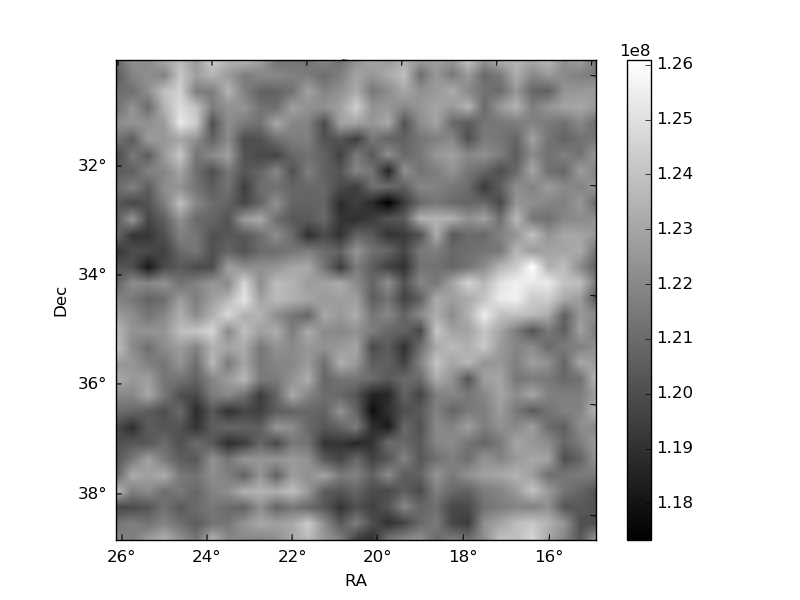
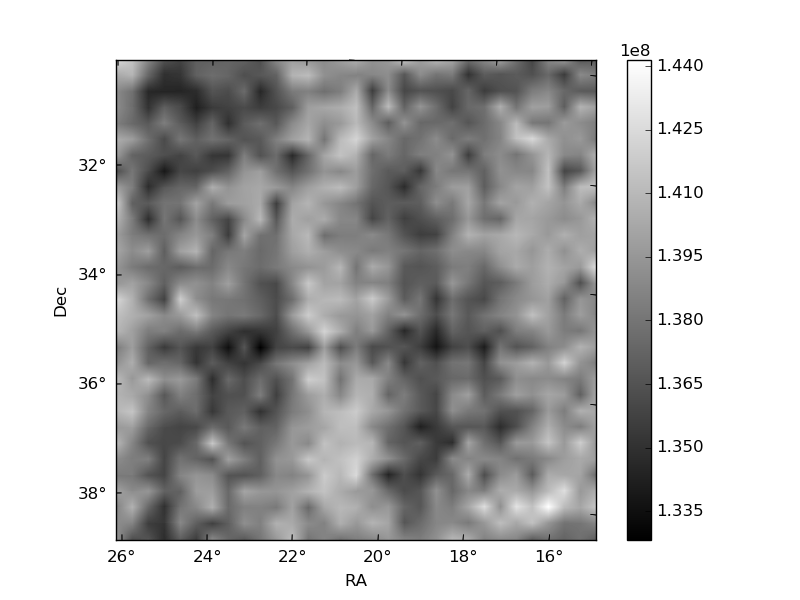
Histogram calculated using DETX and DETY for each event in the final _common_clean file
| Quadrant A | 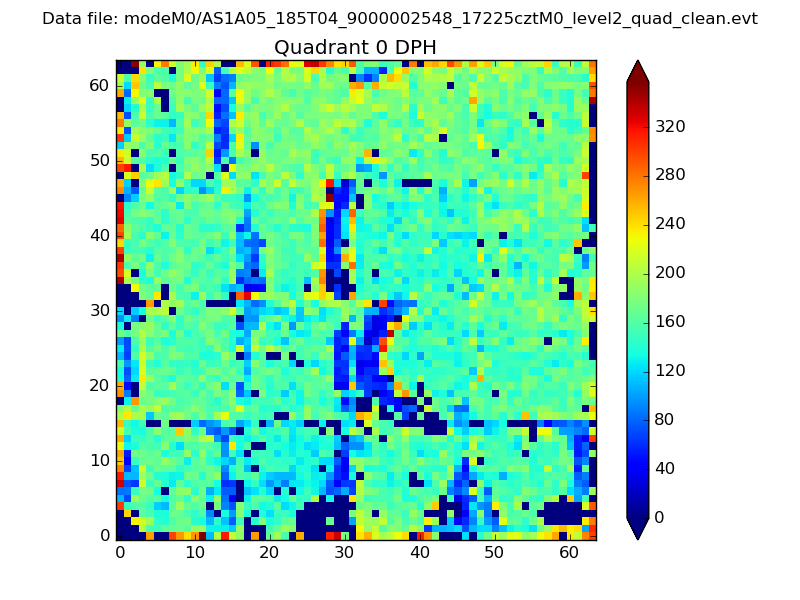 |
 |
Quadrant B |
|---|---|---|---|
| Quadrant D |  |
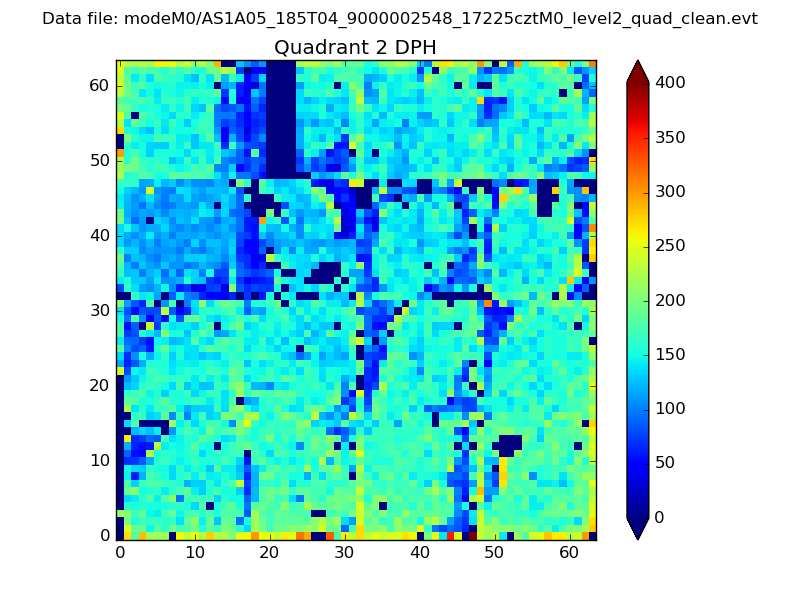 |
Quadrant C |
| Plot type | Count rate plots | Images |
|---|---|---|
| Comparison with Poisson distribution Blue bars denote a histogram of data divided into 1 sec bins. Red curve is a Poisson curve with rate = median count rate of data. |
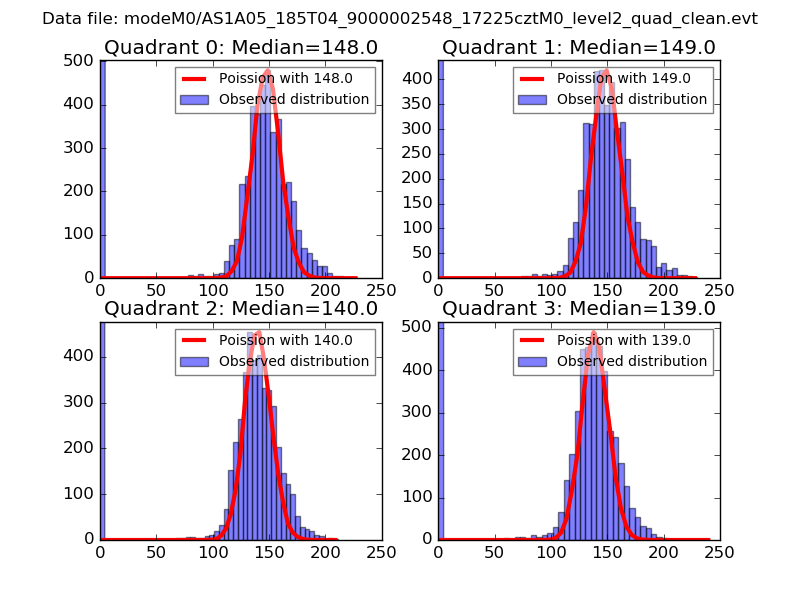 |
 |
| Quadrant-wise count rates Data is divided into 100 sec bins |
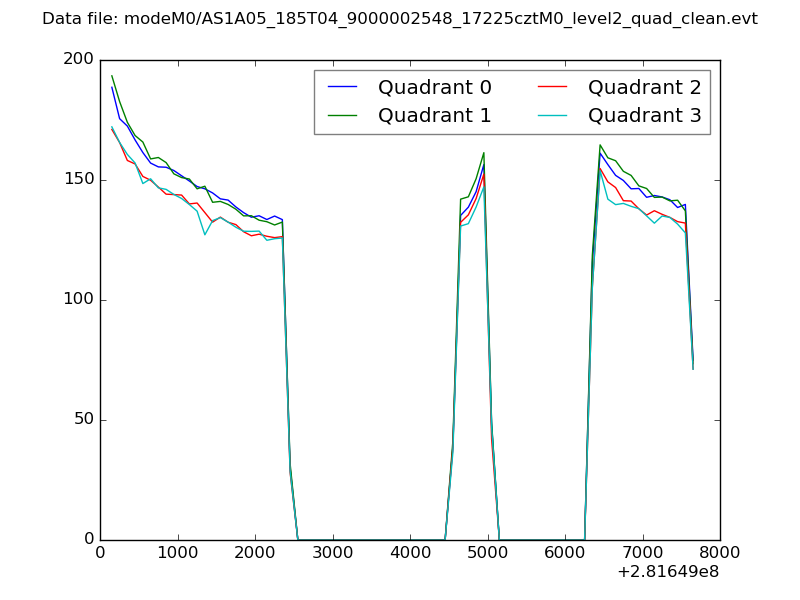 |
|
| Module-wise count rates for Quadrant A Data is divided into 100 sec bins |
 |
 |
| Module-wise count rates for Quadrant B Data is divided into 100 sec bins |
 |
 |
| Module-wise count rates for Quadrant C Data is divided into 100 sec bins |
 |
 |
| Module-wise count rates for Quadrant D Data is divided into 100 sec bins |
 |
 |
| Parameter | Plot |
|---|---|
| CZT HV Monitor |  |
| D_VDD | 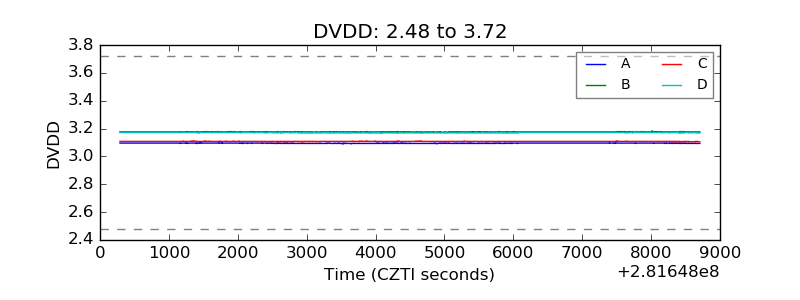 |
| Temperature 1 | 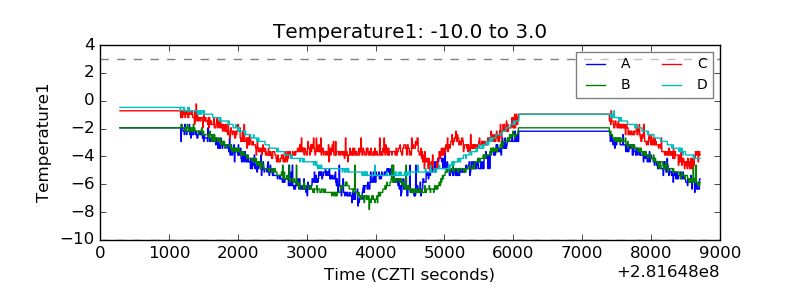 |
| Veto HV Monitor | 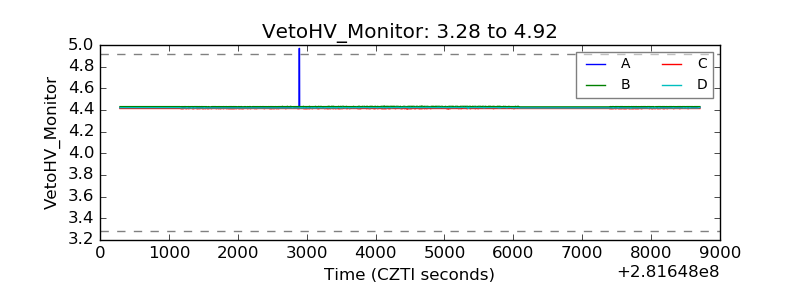 |
| Veto LLD | 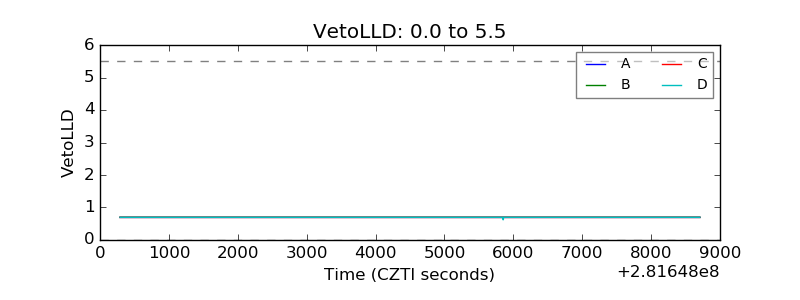 |
| Alpha Counter | 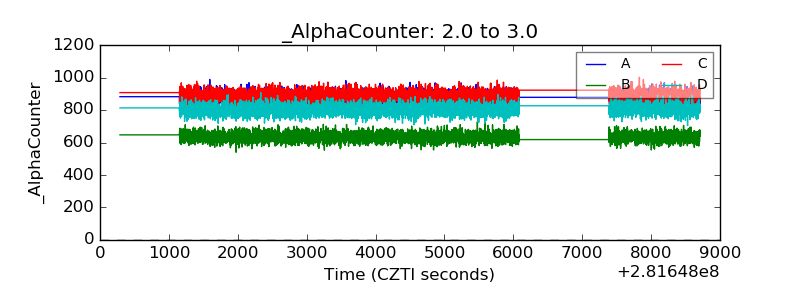 |
| _CPM_Rate | 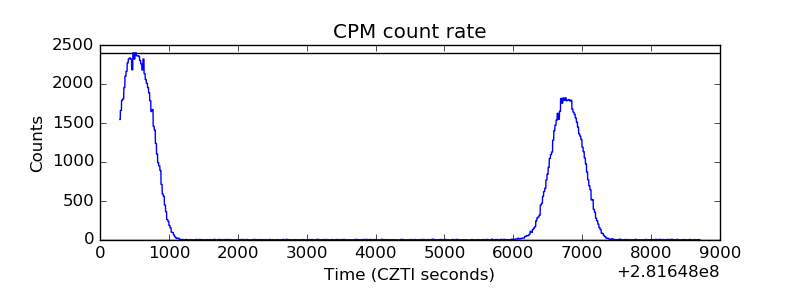 |
| CZT Counter | 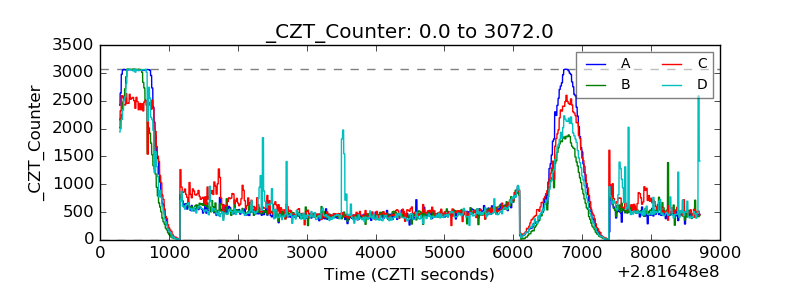 |
| +2.5 Volts monitor |  |
| +5 Volts monitor | 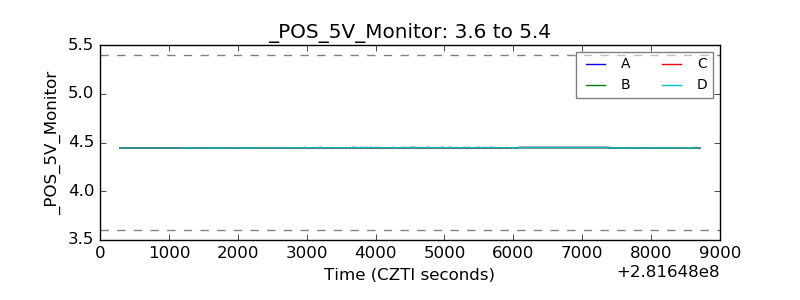 |
| _ROLL_ROT | 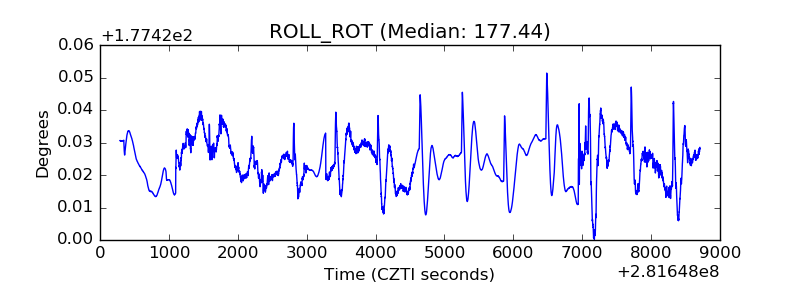 |
| _Roll_DEC | 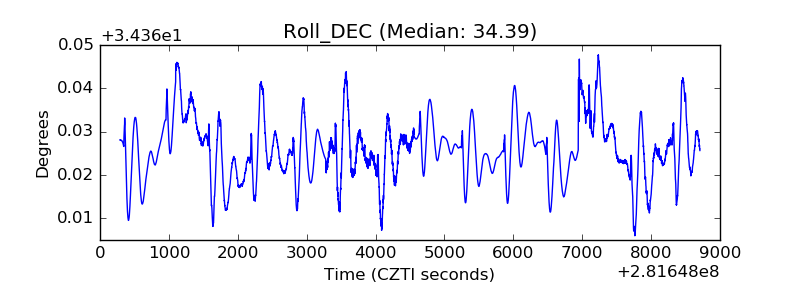 |
| _Roll_RA | 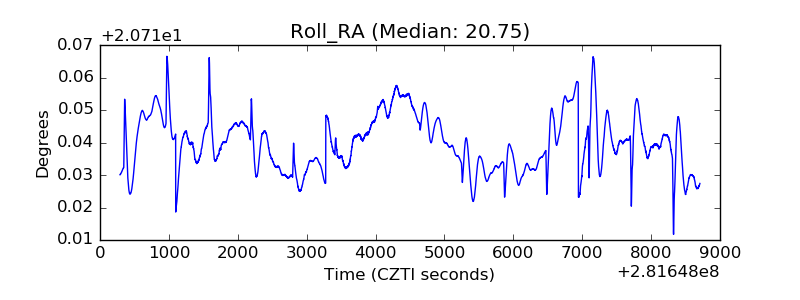 |
| Veto Counter | 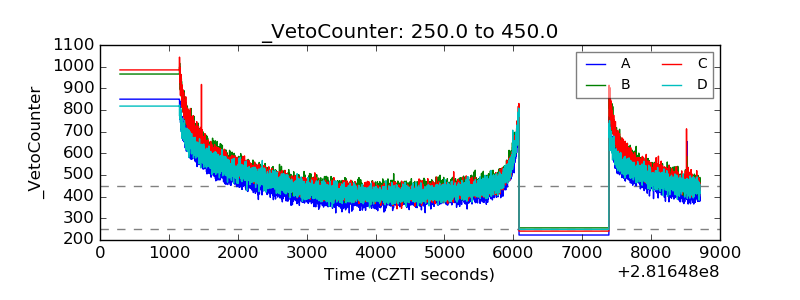 |