| Param | Original file | Final file |
|---|---|---|
| Filename | modeM0/AS1A05_185T04_9000002548_17227cztM0_level2.evt | modeM0/AS1A05_185T04_9000002548_17227cztM0_level2_quad_clean.evt |
| Size (bytes) | 489,084,480 | 93,597,120 |
| Size | 466.4 MB | 89.3 MB |
| Events in quadrant A | 3,237,003 | 605,855 |
| Events in quadrant B | 3,582,549 | 604,839 |
| Events in quadrant C | 3,925,823 | 573,633 |
| Events in quadrant D | 3,594,309 | 565,827 |
| Mode SS | |||
|---|---|---|---|
| Quadrant | BADHDUFLAG | Total packets | Discarded packets |
| A | 0 | 142 | 0 |
| B | 0 | 142 | 0 |
| C | 0 | 142 | 0 |
| D | 0 | 142 | 0 |
| Mode M9 | |||
|---|---|---|---|
| Quadrant | BADHDUFLAG | Total packets | Discarded packets |
| A | 0 | 21 | 0 |
| B | 0 | 21 | 0 |
| C | 0 | 21 | 0 |
| D | 0 | 21 | 0 |
| Mode M0 | |||
|---|---|---|---|
| Quadrant | BADHDUFLAG | Total packets | Discarded packets |
| A | 0 | 14363 | 3 |
| B | 0 | 15313 | 2 |
| C | 0 | 16087 | 2 |
| D | 0 | 15764 | 2 |
| Quadrant | Total seconds | Saturated seconds | Saturation percentage |
|---|---|---|---|
| A | 6954 | 40 | 0.575209% |
| B | 6955 | 121 | 1.739756% |
| C | 6955 | 160 | 2.300503% |
| D | 6955 | 121 | 1.739756% |
Noise dominated data is calculated using 1-second bins in cleaned event files. If a bin has >2000 counts, and if more than 50% of those come from <1% of pixels, then it is considered to be noise-dominated and hence unusable.
| Quadrant | # 1 sec bins | Bins with >0 counts | Bins with >2000 counts | High rate bins dominated by noise | Noise dominated (total time) | Noise dominated (detector-on time) | Marked lightcurve |
|---|---|---|---|---|---|---|---|
| A | 8984 | 6956 | 0 | 0 | 0.00% | 0.00% | 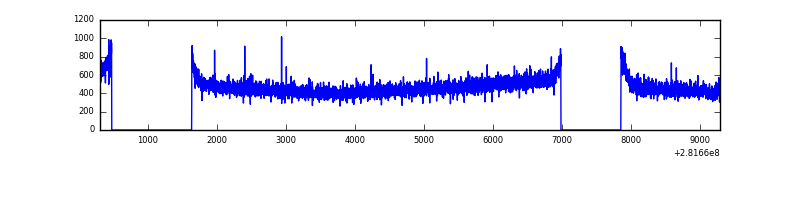 |
| B | 8985 | 6957 | 17 | 17 | 0.19% | 0.24% | 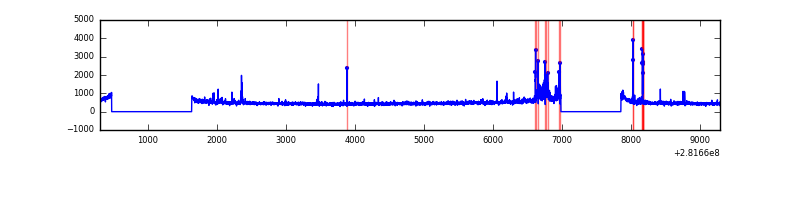 |
| C | 8985 | 6957 | 0 | 0 | 0.00% | 0.00% | 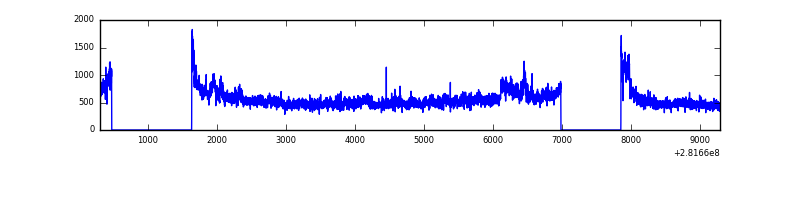 |
| D | 8985 | 6957 | 71 | 71 | 0.79% | 1.02% | 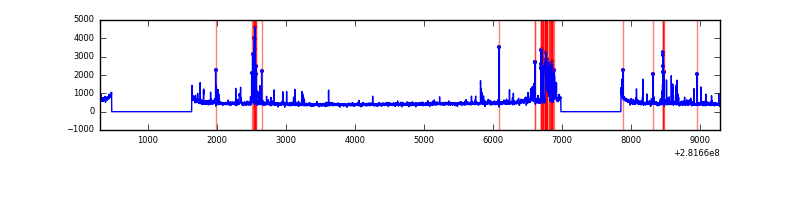 |
Top three noisy pixels from each quadrant. If the there are fewer than three noisy pixels in the level2.evt file, extra rows are filled as -1
| Pixel properties | Quadrant properties | ||||||
|---|---|---|---|---|---|---|---|
| Quadrant | DetID | PixID | Counts | Sigma | Mean | Median | Sigma |
| A | 0 | 226 | 7356 | 38.37 | 841 | 822 | 170.3 |
| A | 12 | 194 | 6101 | 31.0 | 841 | 822 | 170.3 |
| A | 3 | 137 | 6051 | 30.7 | 841 | 822 | 170.3 |
| B | 7 | 220 | 89573 | 554.7 | 840 | 819 | 160.0 |
| B | 0 | 189 | 82801 | 512.37 | 840 | 819 | 160.0 |
| B | 0 | 229 | 43337 | 265.73 | 840 | 819 | 160.0 |
| C | 3 | 233 | 659439 | 3456.59 | 806 | 811 | 190.5 |
| C | 14 | 238 | 122721 | 639.8 | 806 | 811 | 190.5 |
| C | 13 | 61 | 5682 | 25.56 | 806 | 811 | 190.5 |
| D | 13 | 189 | 157416 | 788.79 | 815 | 790 | 198.6 |
| D | 7 | 38 | 141853 | 710.42 | 815 | 790 | 198.6 |
| D | 10 | 70 | 132761 | 664.63 | 815 | 790 | 198.6 |
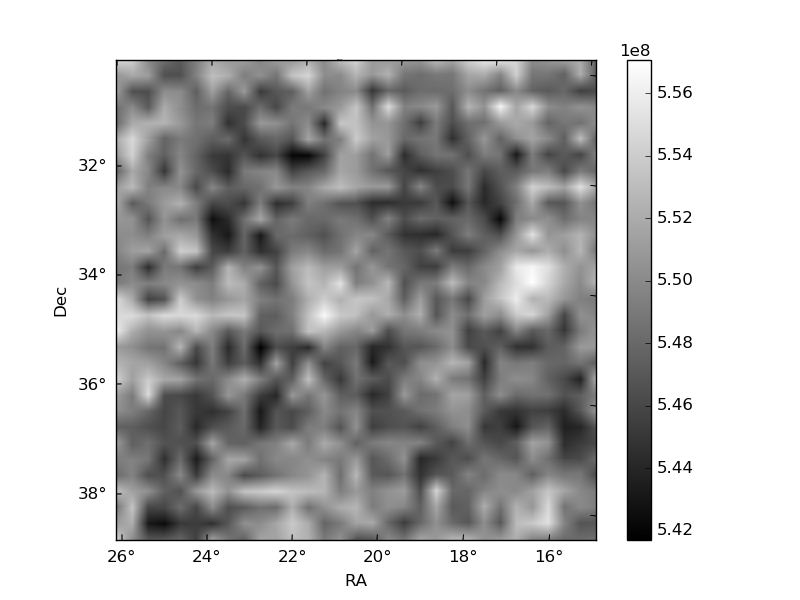
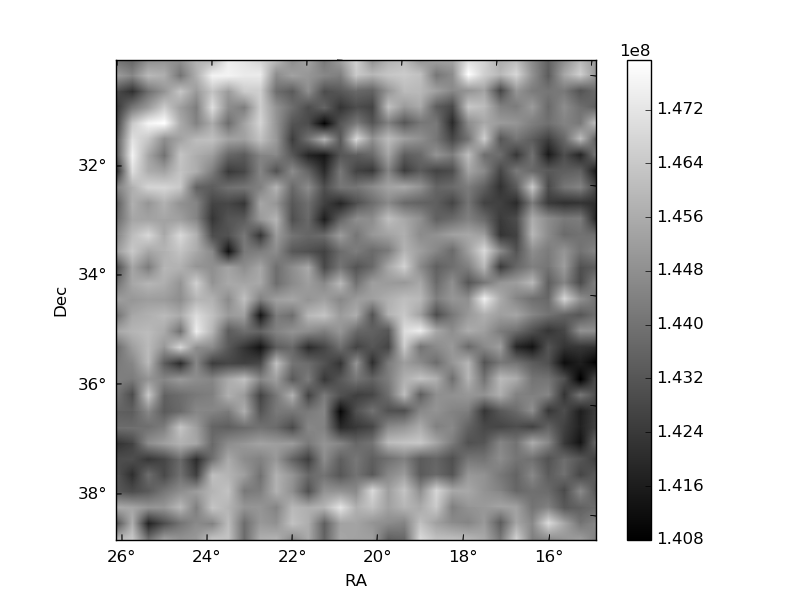
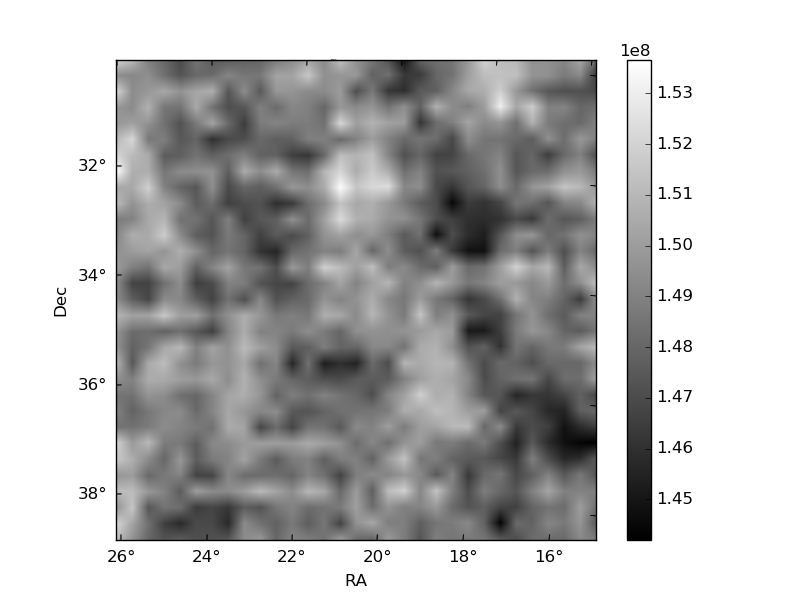
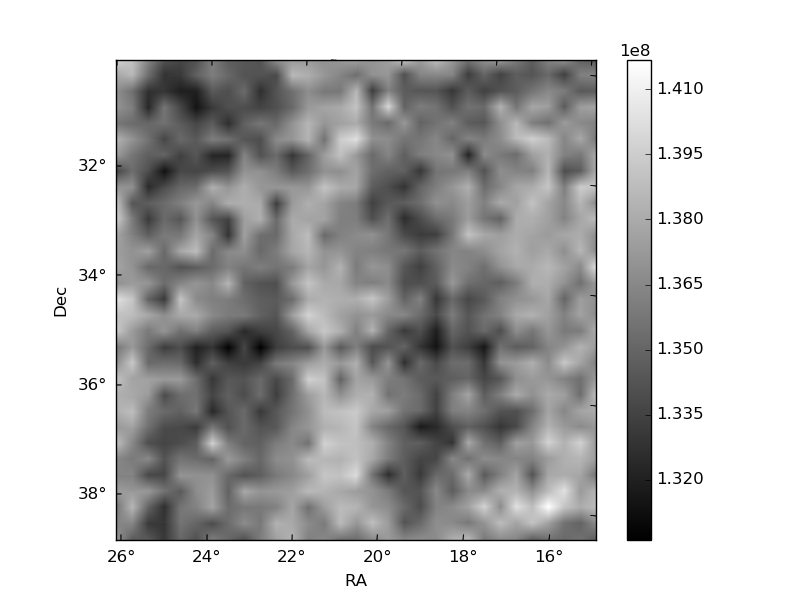
Histogram calculated using DETX and DETY for each event in the final _common_clean file
| Quadrant A | 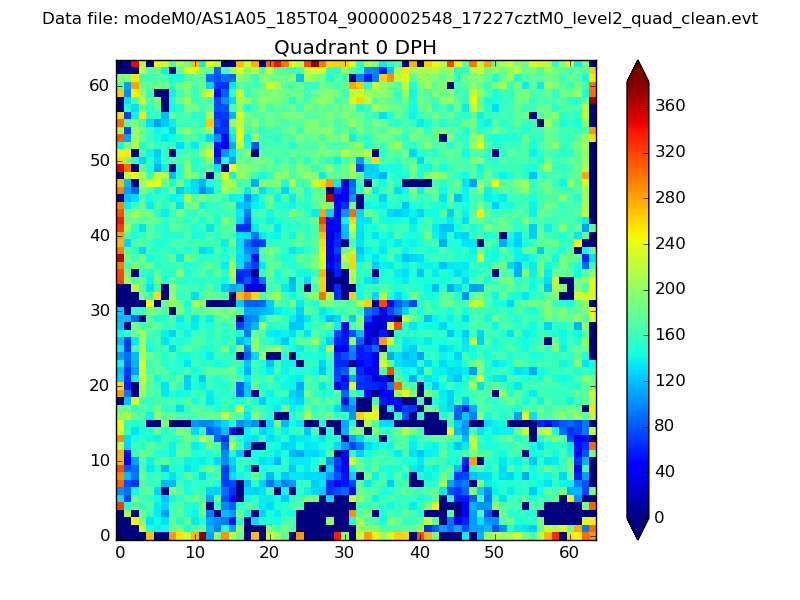 |
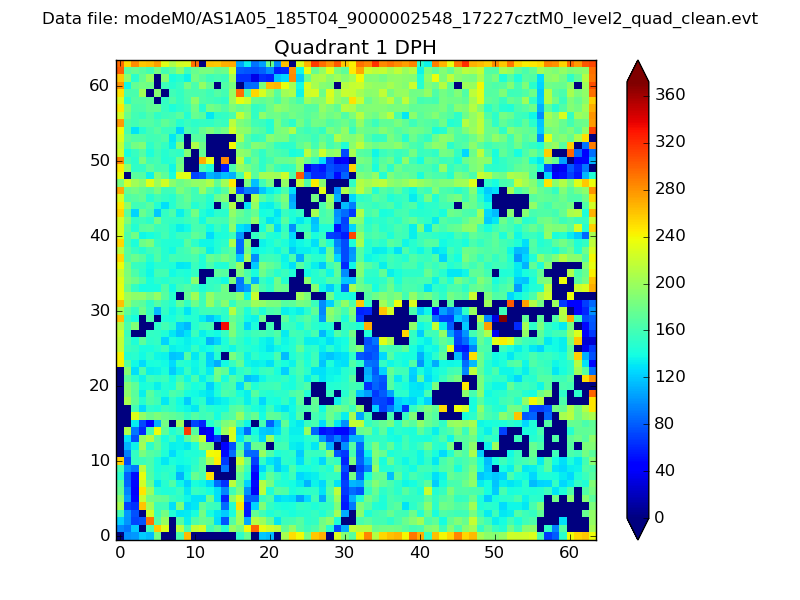 |
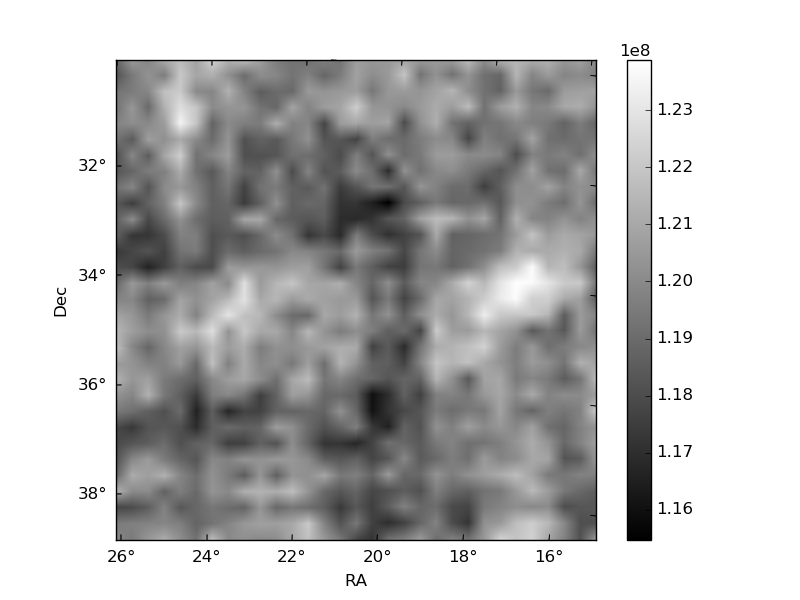
Quadrant B |
|---|---|---|---|
| Quadrant D | 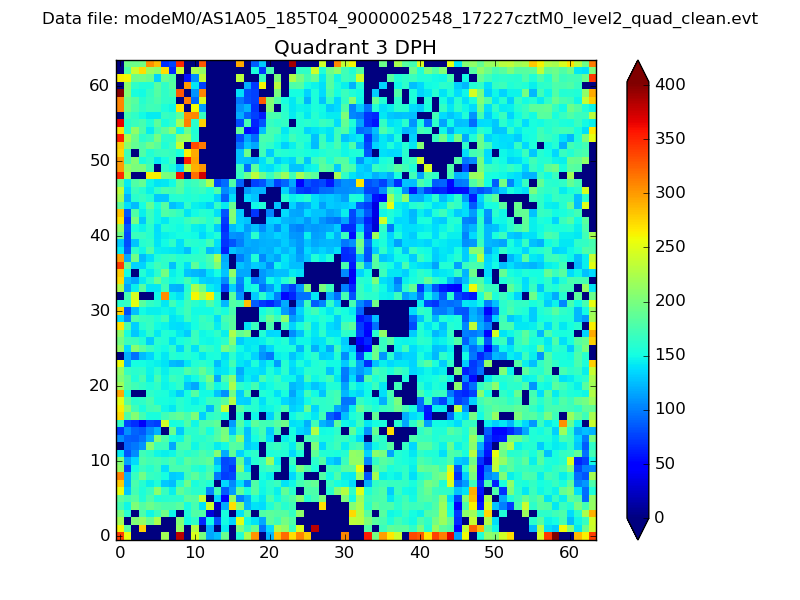 |
 |
Quadrant C |
| Plot type | Count rate plots | Images |
|---|---|---|
| Comparison with Poisson distribution Blue bars denote a histogram of data divided into 1 sec bins. Red curve is a Poisson curve with rate = median count rate of data. |
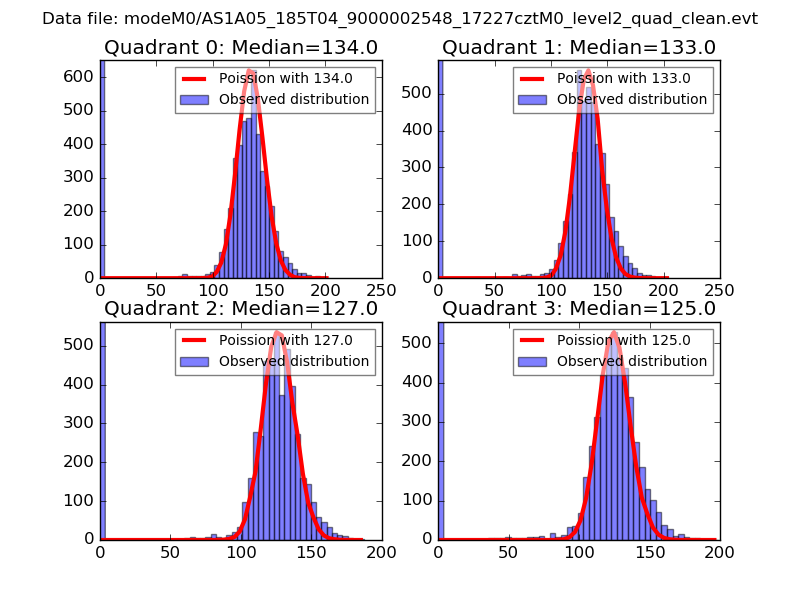 |
 |
| Quadrant-wise count rates Data is divided into 100 sec bins |
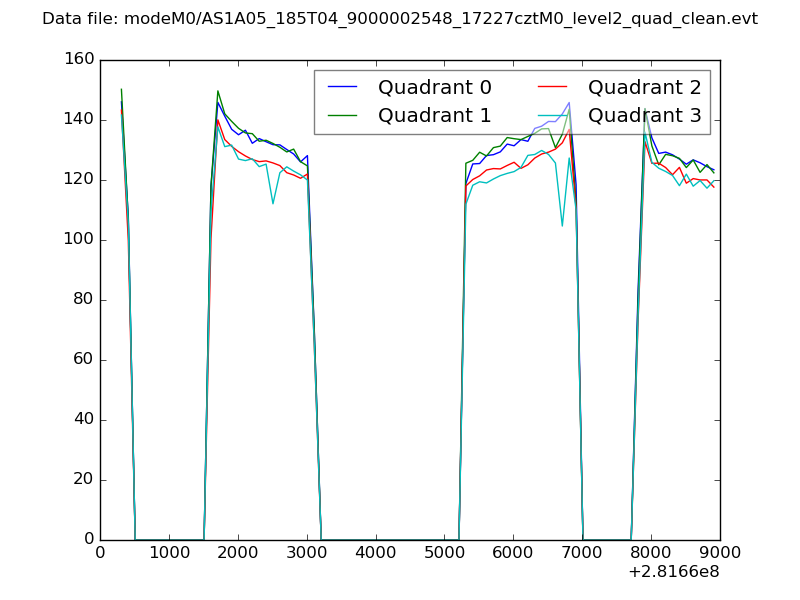 |
|
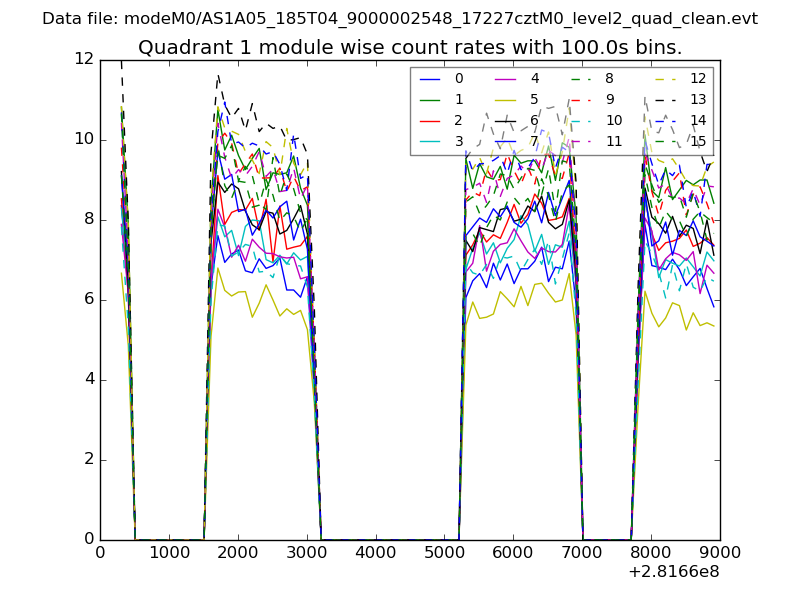
| Module-wise count rates for Quadrant A Data is divided into 100 sec bins |
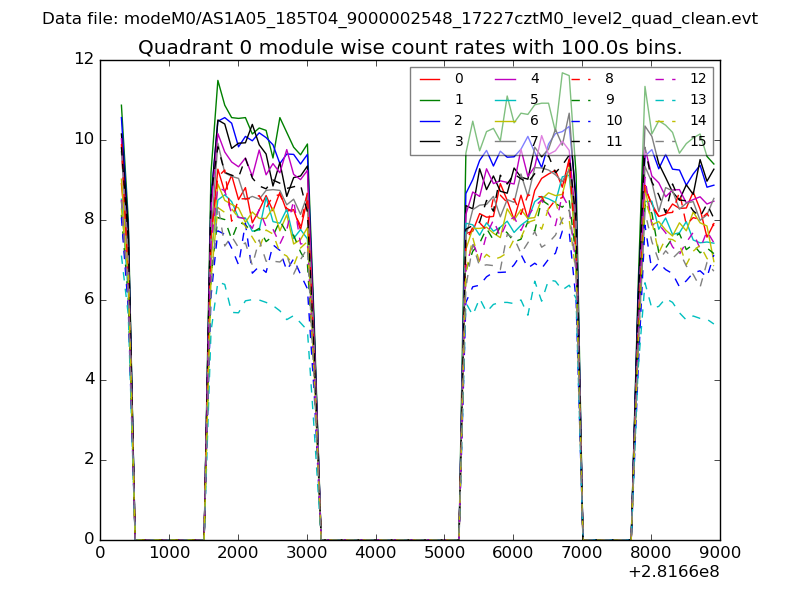 |
 |
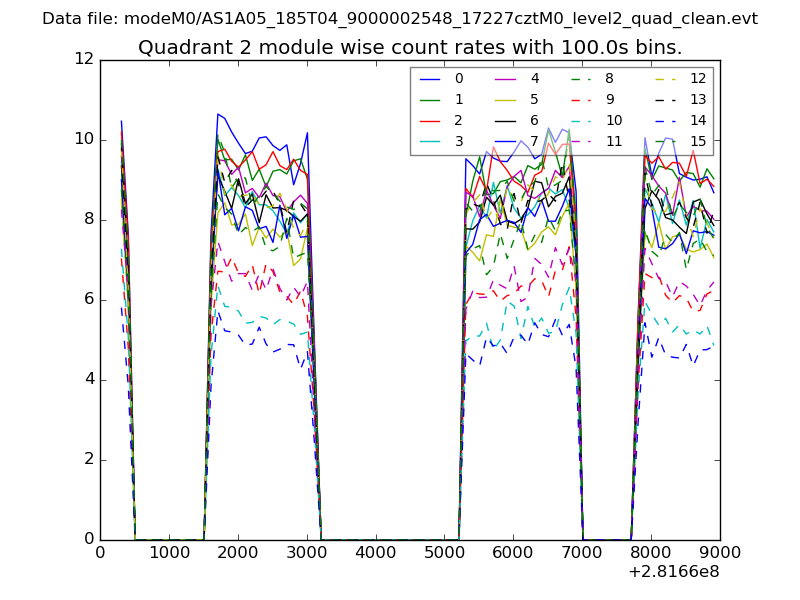
| Module-wise count rates for Quadrant B Data is divided into 100 sec bins |
 |
 |
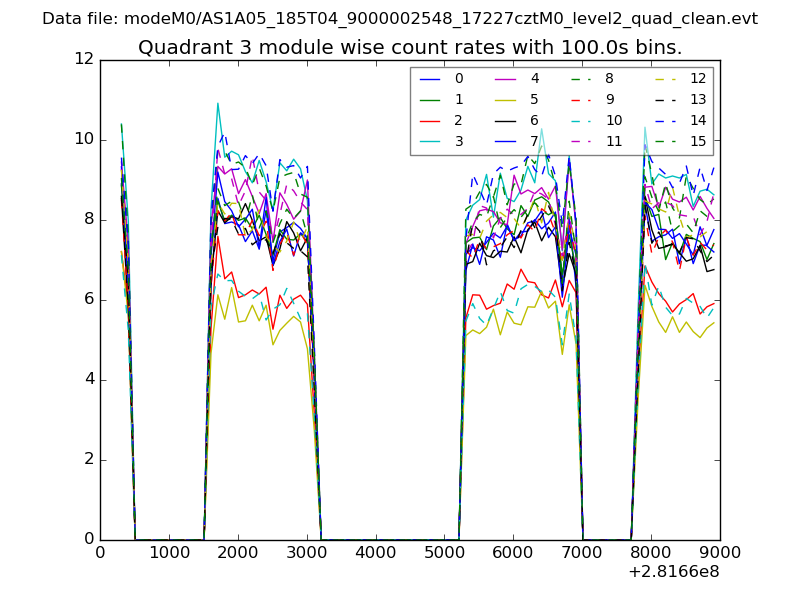
| Module-wise count rates for Quadrant C Data is divided into 100 sec bins |
 |
 |
| Module-wise count rates for Quadrant D Data is divided into 100 sec bins |
 |
 |
| Parameter | Plot |
|---|---|
| CZT HV Monitor | 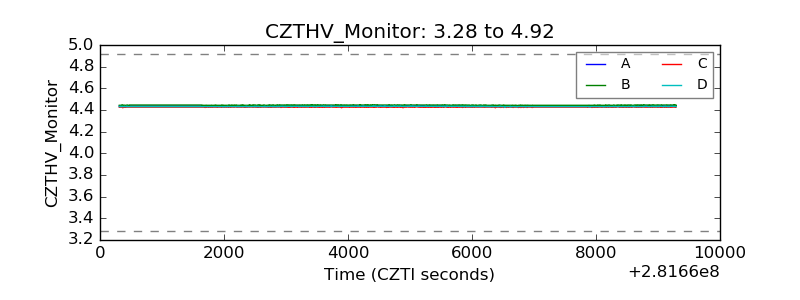 |
| D_VDD | 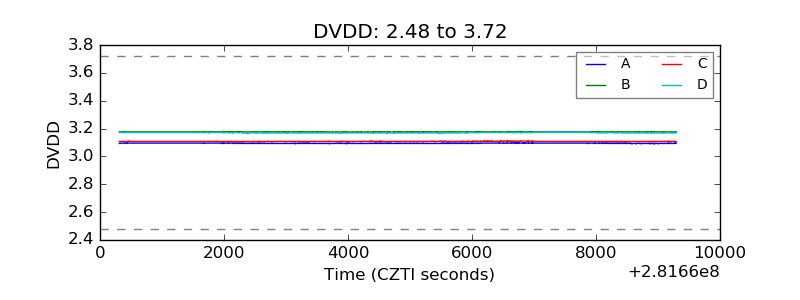 |
| Temperature 1 | 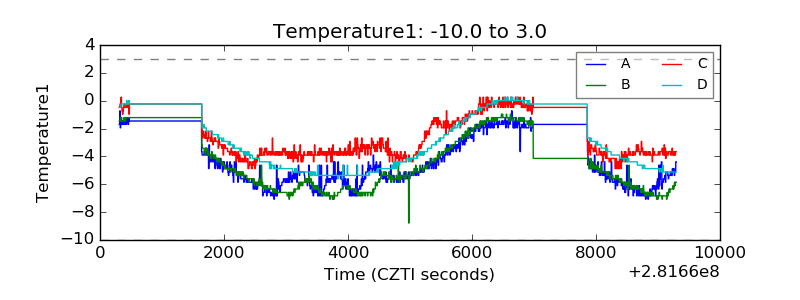 |
| Veto HV Monitor | 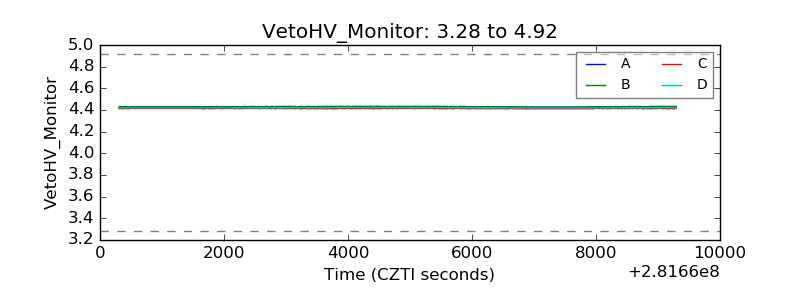 |
| Veto LLD | 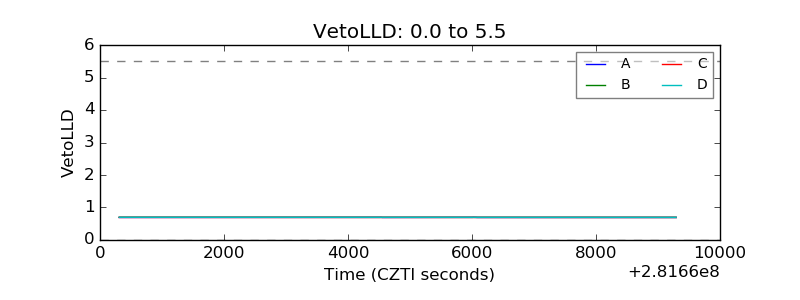 |
| Alpha Counter | 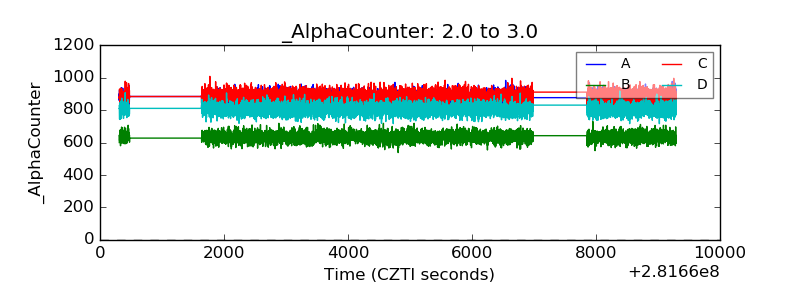 |
| _CPM_Rate | 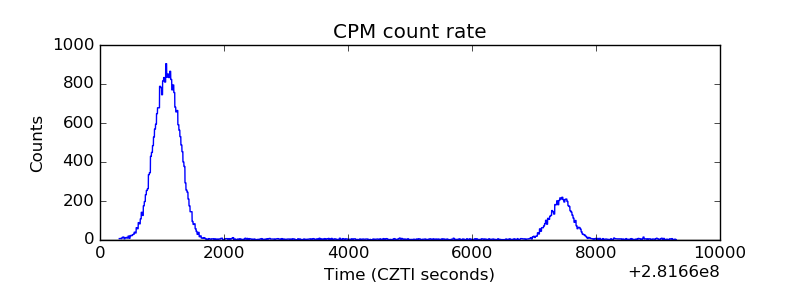 |
| CZT Counter |  |
| +2.5 Volts monitor |  |
| +5 Volts monitor | 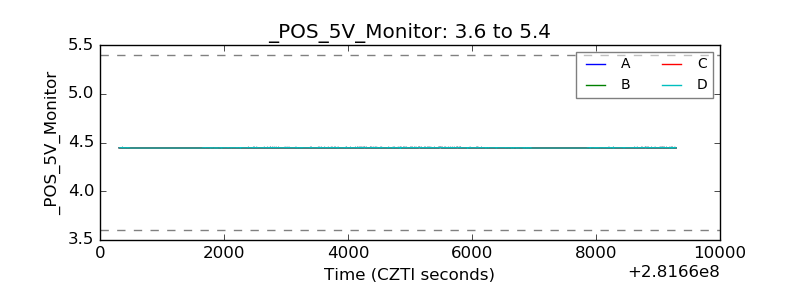 |
| _ROLL_ROT | 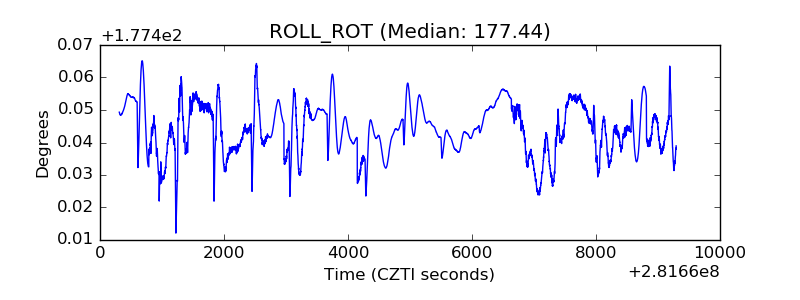 |
| _Roll_DEC | 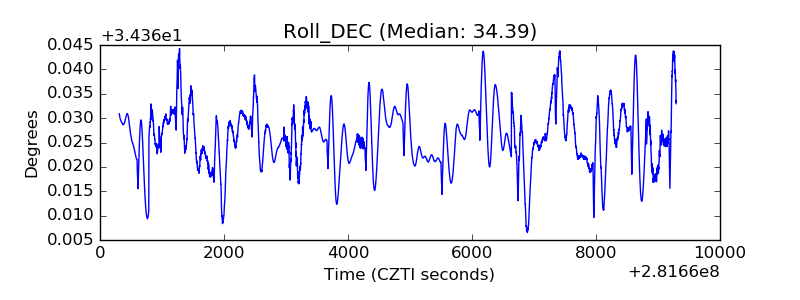 |
| _Roll_RA | 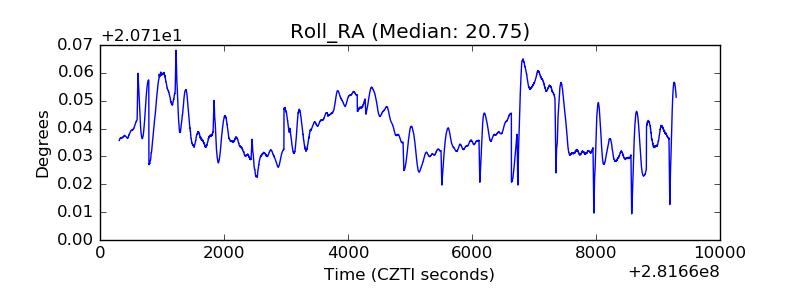 |
| Veto Counter | 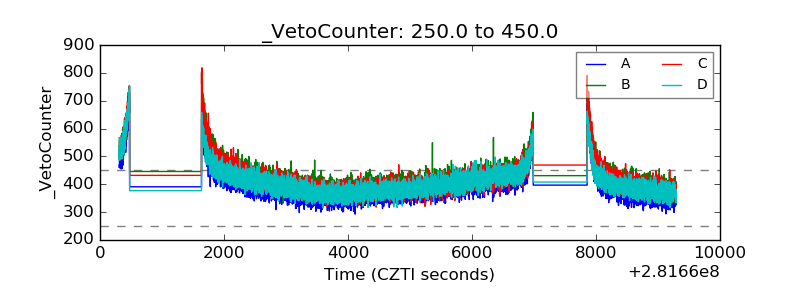 |