| Param | Original file | Final file |
|---|---|---|
| Filename | modeM0/AS1A05_185T04_9000002548_17229cztM0_level2.evt | modeM0/AS1A05_185T04_9000002548_17229cztM0_level2_quad_clean.evt |
| Size (bytes) | 617,258,880 | 103,069,440 |
| Size | 588.7 MB | 98.3 MB |
| Events in quadrant A | 4,194,679 | 652,392 |
| Events in quadrant B | 4,600,003 | 648,266 |
| Events in quadrant C | 4,195,808 | 624,835 |
| Events in quadrant D | 5,120,869 | 599,247 |
| Mode SS | |||
|---|---|---|---|
| Quadrant | BADHDUFLAG | Total packets | Discarded packets |
| A | 0 | 176 | 0 |
| B | 0 | 176 | 0 |
| C | 0 | 176 | 0 |
| D | 0 | 176 | 0 |
| Mode M9 | |||
|---|---|---|---|
| Quadrant | BADHDUFLAG | Total packets | Discarded packets |
| A | 0 | 8 | 0 |
| B | 0 | 8 | 0 |
| C | 0 | 8 | 0 |
| D | 0 | 8 | 0 |
| Mode M0 | |||
|---|---|---|---|
| Quadrant | BADHDUFLAG | Total packets | Discarded packets |
| A | 0 | 18294 | 2 |
| B | 0 | 19563 | 2 |
| C | 0 | 17871 | 2 |
| D | 0 | 21531 | 2 |
| Quadrant | Total seconds | Saturated seconds | Saturation percentage |
|---|---|---|---|
| A | 8585 | 85 | 0.990099% |
| B | 8586 | 174 | 2.026555% |
| C | 8586 | 120 | 1.397624% |
| D | 8586 | 417 | 4.856744% |
Noise dominated data is calculated using 1-second bins in cleaned event files. If a bin has >2000 counts, and if more than 50% of those come from <1% of pixels, then it is considered to be noise-dominated and hence unusable.
| Quadrant | # 1 sec bins | Bins with >0 counts | Bins with >2000 counts | High rate bins dominated by noise | Noise dominated (total time) | Noise dominated (detector-on time) | Marked lightcurve |
|---|---|---|---|---|---|---|---|
| A | 9415 | 8587 | 7 | 7 | 0.07% | 0.08% | 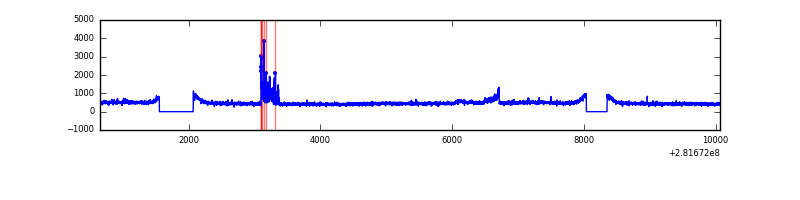 |
| B | 9416 | 8588 | 25 | 25 | 0.27% | 0.29% | 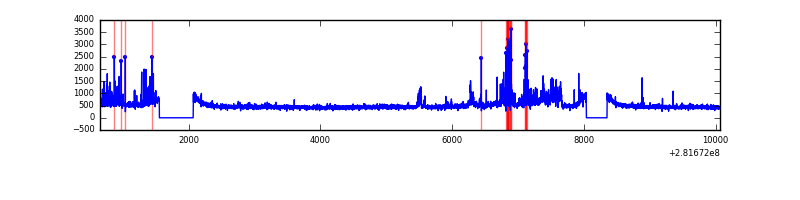 |
| C | 9416 | 8588 | 1 | 1 | 0.01% | 0.01% | 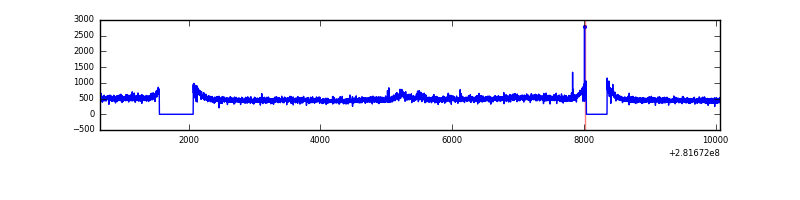 |
| D | 9416 | 8588 | 188 | 188 | 2.00% | 2.19% | 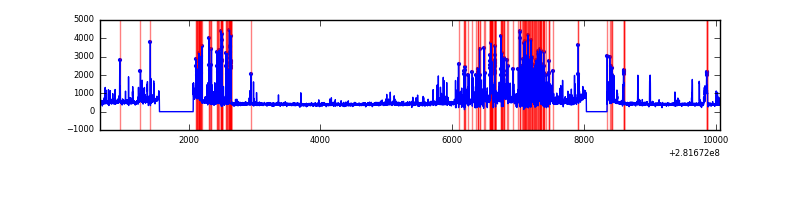 |
Top three noisy pixels from each quadrant. If the there are fewer than three noisy pixels in the level2.evt file, extra rows are filled as -1
| Pixel properties | Quadrant properties | ||||||
|---|---|---|---|---|---|---|---|
| Quadrant | DetID | PixID | Counts | Sigma | Mean | Median | Sigma |
| A | 0 | 23 | 212987 | 1007.36 | 1031 | 1007 | 210.4 |
| A | 0 | 226 | 21831 | 98.96 | 1031 | 1007 | 210.4 |
| A | 3 | 137 | 7675 | 31.69 | 1031 | 1007 | 210.4 |
| B | 0 | 189 | 205198 | 1025.89 | 1030 | 1003 | 199.0 |
| B | 7 | 220 | 146125 | 729.1 | 1030 | 1003 | 199.0 |
| B | 4 | 216 | 86955 | 431.83 | 1030 | 1003 | 199.0 |
| C | 3 | 233 | 170988 | 725.37 | 993 | 999 | 234.3 |
| C | 14 | 238 | 150008 | 635.84 | 993 | 999 | 234.3 |
| C | 5 | 112 | 7435 | 27.46 | 993 | 999 | 234.3 |
| D | 1 | 52 | 681425 | 2816.06 | 988 | 959 | 241.6 |
| D | 10 | 70 | 291235 | 1201.29 | 988 | 959 | 241.6 |
| D | 10 | 199 | 149293 | 613.87 | 988 | 959 | 241.6 |
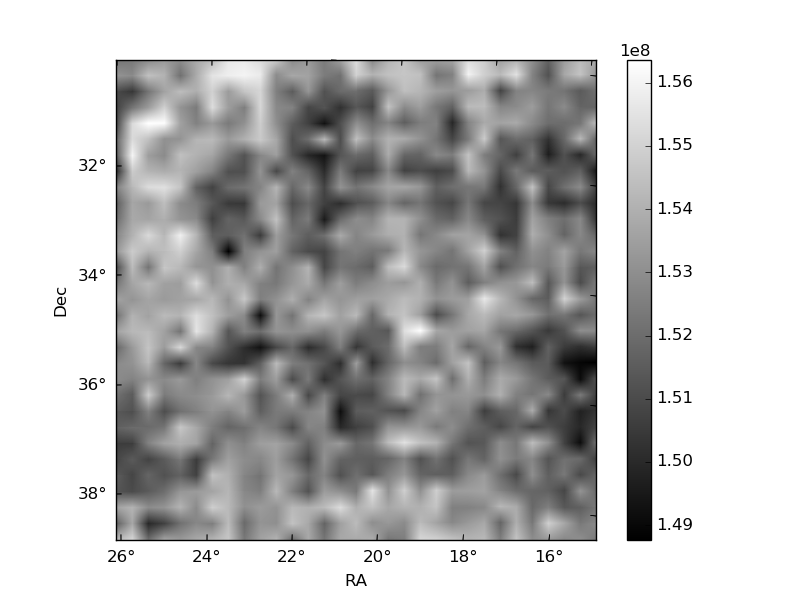
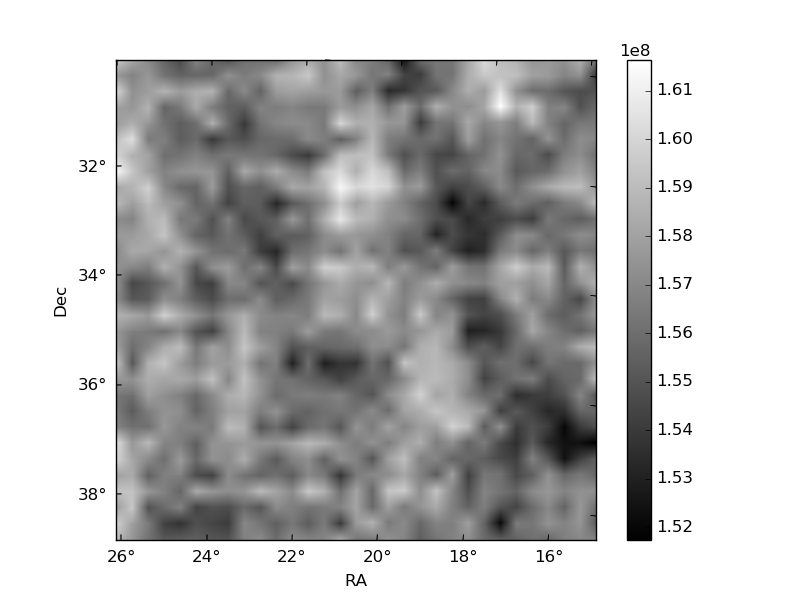
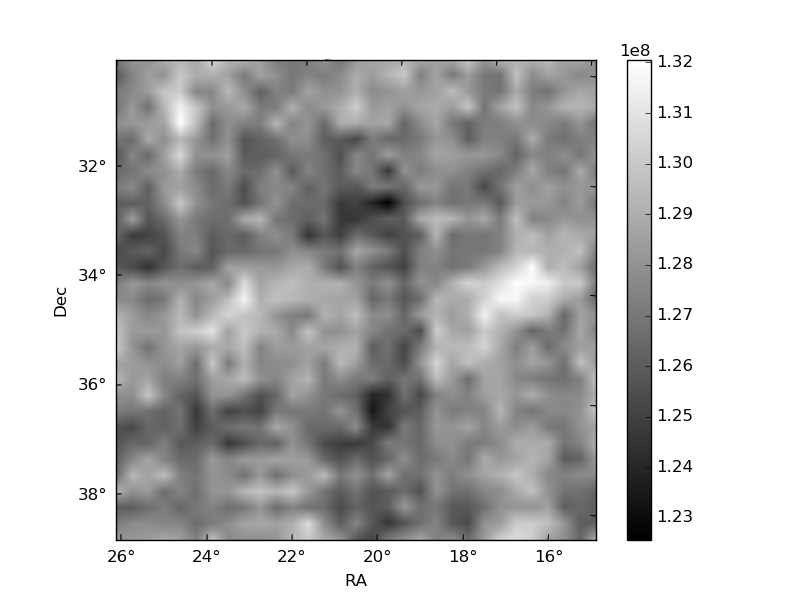
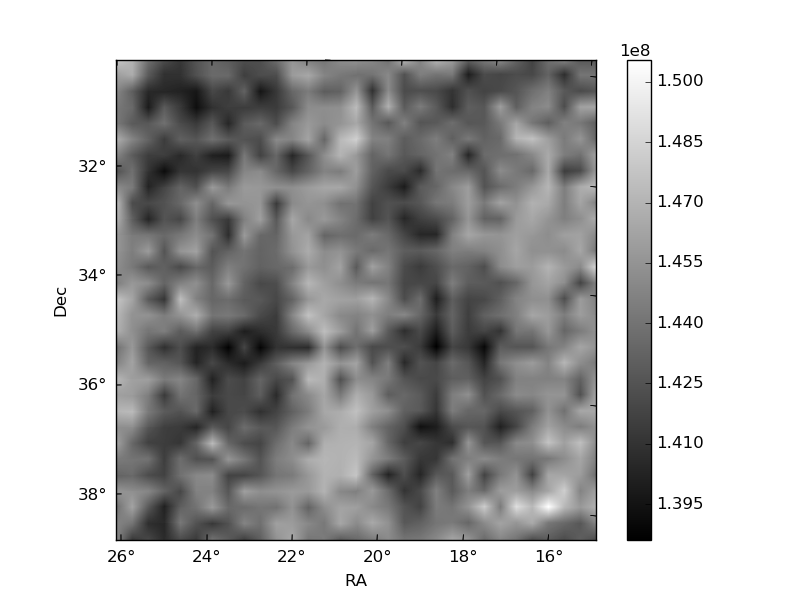
Histogram calculated using DETX and DETY for each event in the final _common_clean file
| Quadrant A | 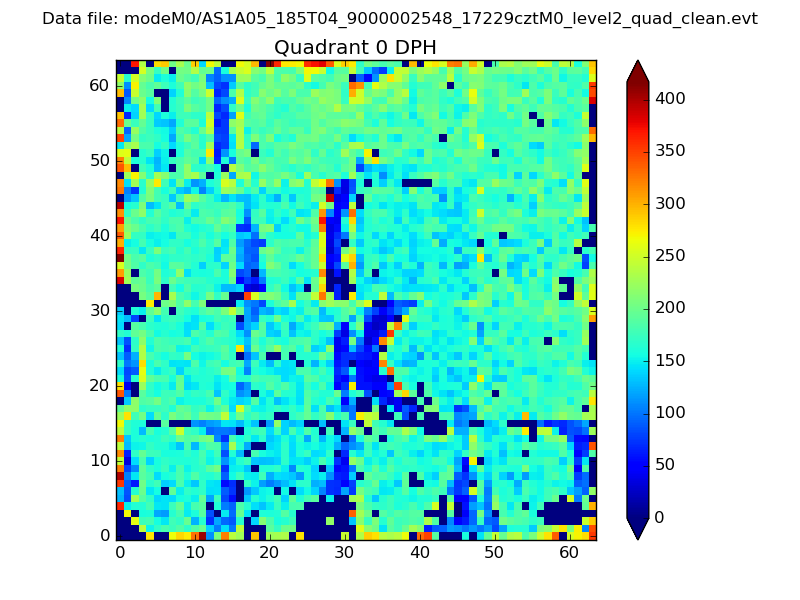 |
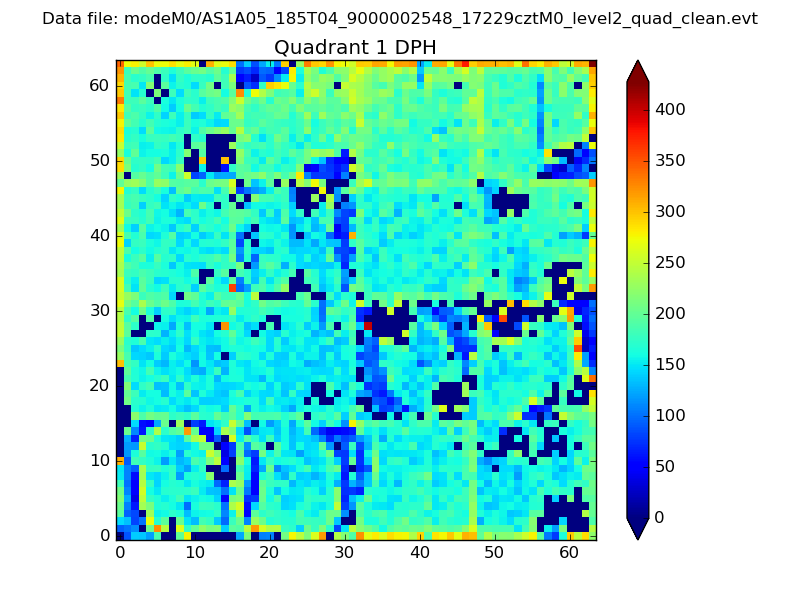 |
Quadrant B |
|---|---|---|---|
| Quadrant D |  |
 |
Quadrant C |
| Plot type | Count rate plots | Images |
|---|---|---|
| Comparison with Poisson distribution Blue bars denote a histogram of data divided into 1 sec bins. Red curve is a Poisson curve with rate = median count rate of data. |
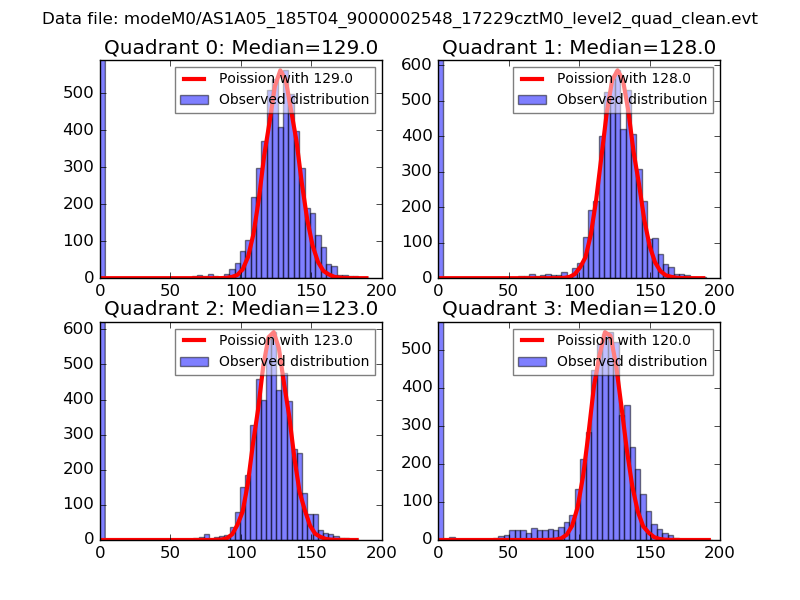 |
 |
| Quadrant-wise count rates Data is divided into 100 sec bins |
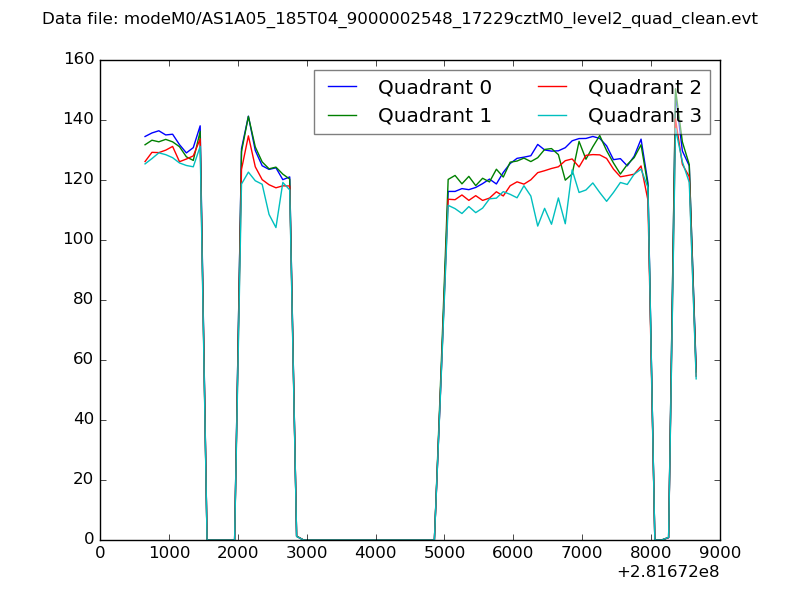 |
|
| Module-wise count rates for Quadrant A Data is divided into 100 sec bins |
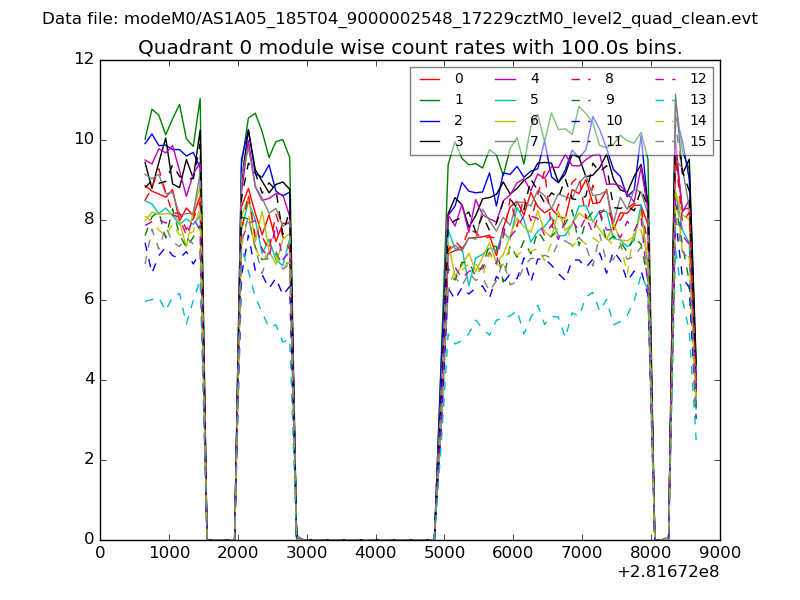 |
 |
| Module-wise count rates for Quadrant B Data is divided into 100 sec bins |
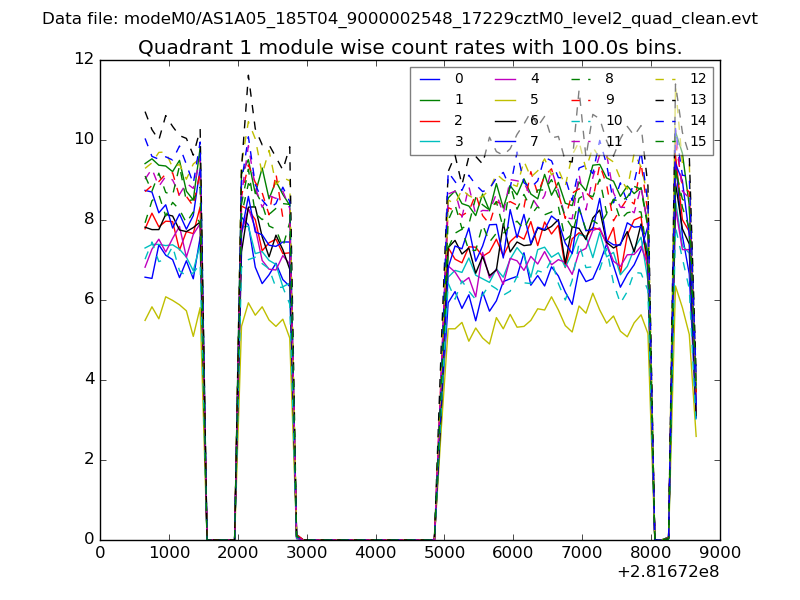 |
 |
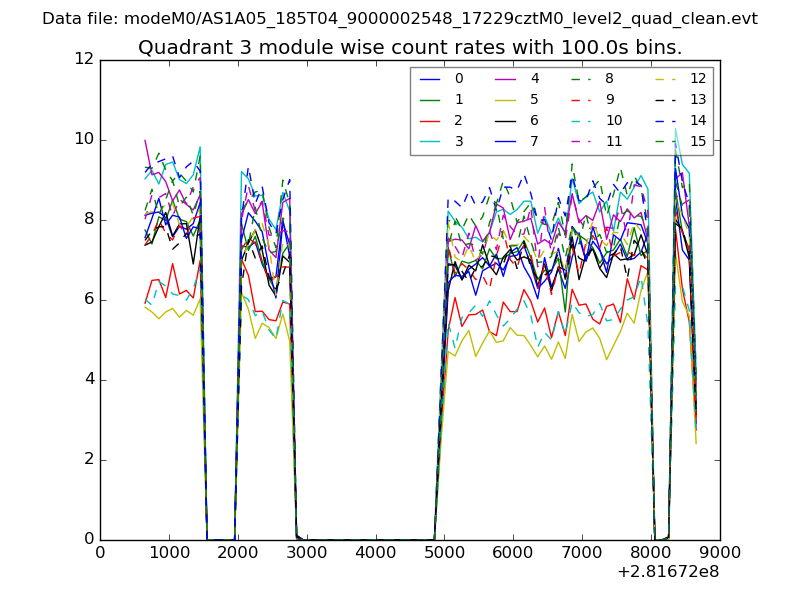
| Module-wise count rates for Quadrant C Data is divided into 100 sec bins |
 |
 |
| Module-wise count rates for Quadrant D Data is divided into 100 sec bins |
 |
 |
| Parameter | Plot |
|---|---|
| CZT HV Monitor | 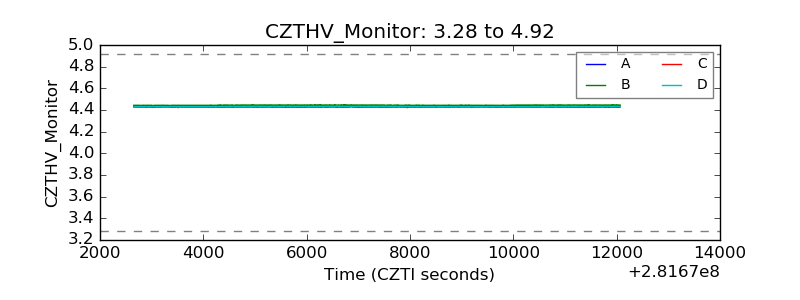 |
| D_VDD | 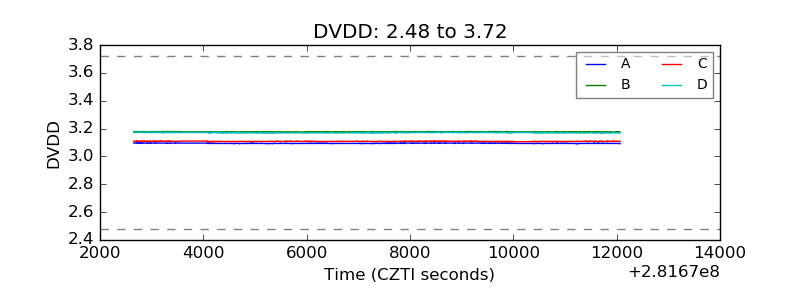 |
| Temperature 1 | 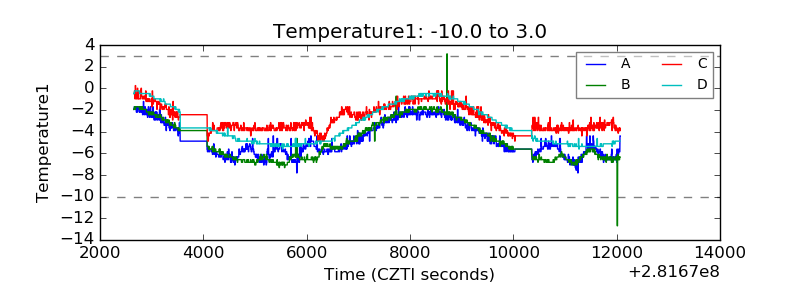 |
| Veto HV Monitor | 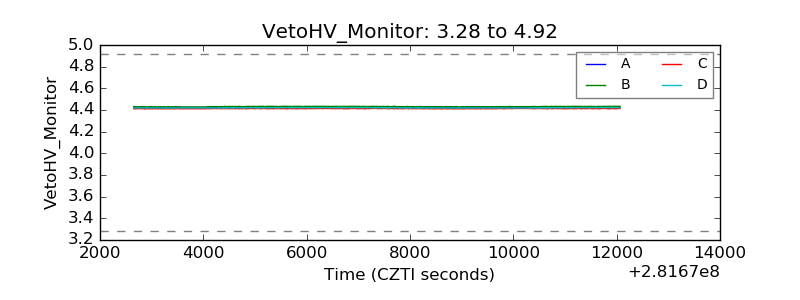 |
| Veto LLD | 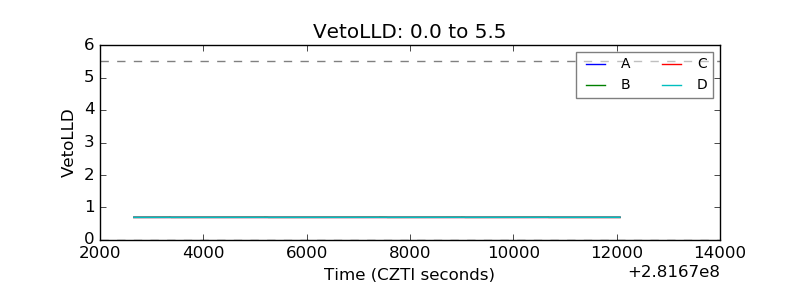 |
| Alpha Counter | 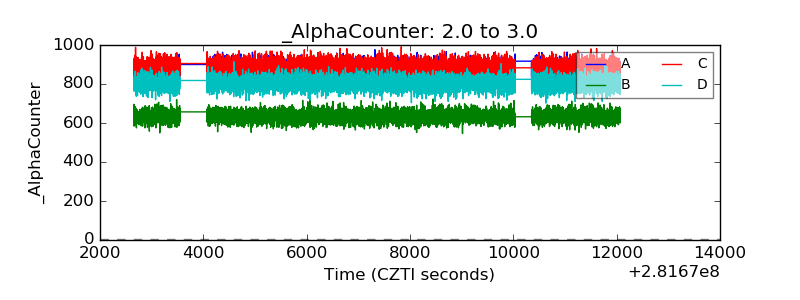 |
| _CPM_Rate | 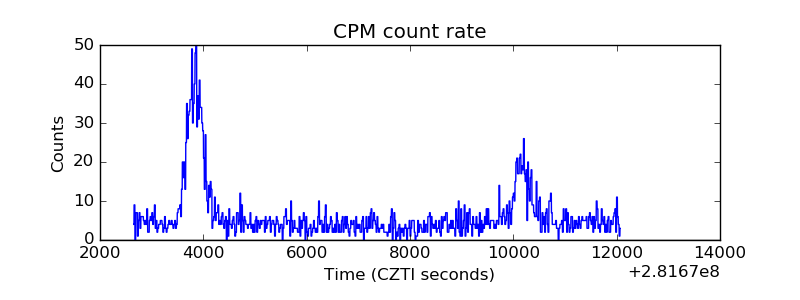 |
| CZT Counter | 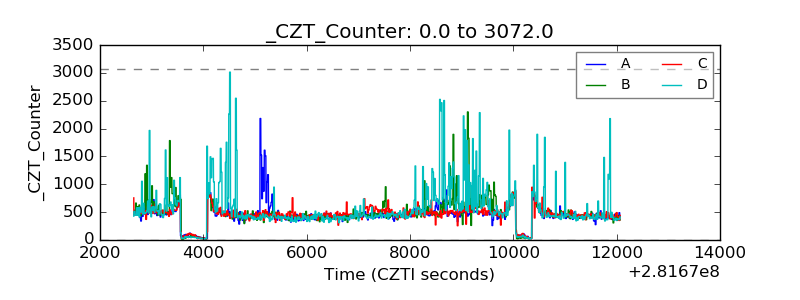 |
| +2.5 Volts monitor |  |
| +5 Volts monitor |  |
| _ROLL_ROT | 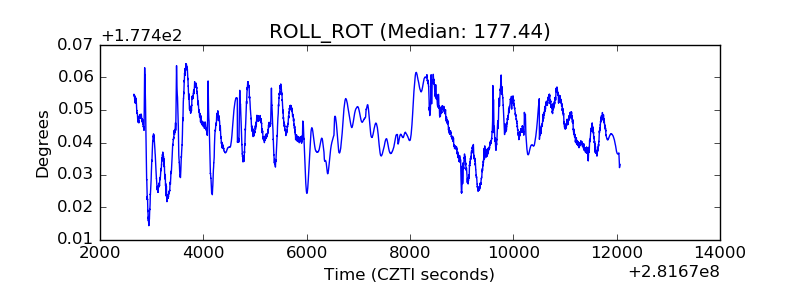 |
| _Roll_DEC | 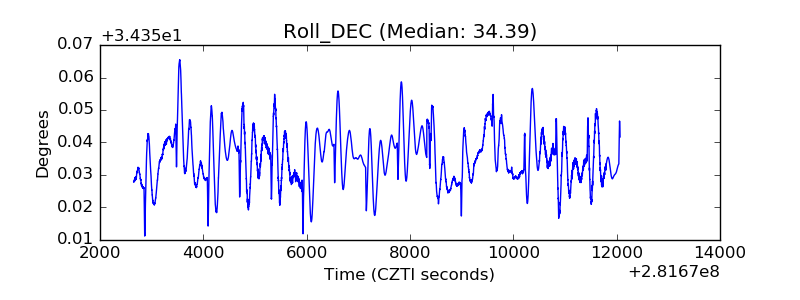 |
| _Roll_RA | 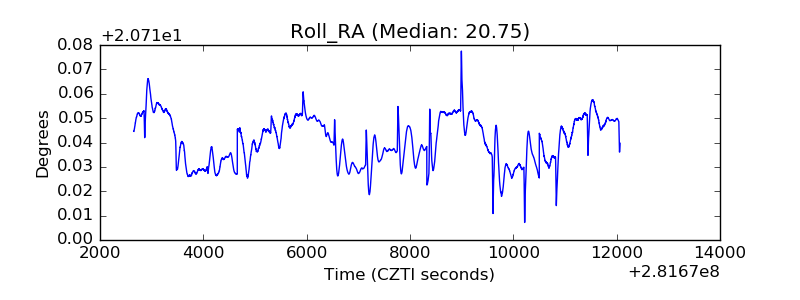 |
| Veto Counter | 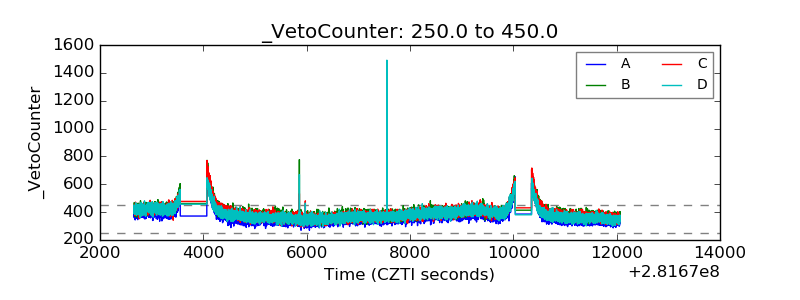 |