| Param | Original file | Final file |
|---|---|---|
| Filename | modeM0/AS1A05_185T04_9000002548_17230cztM0_level2.evt | modeM0/AS1A05_185T04_9000002548_17230cztM0_level2_quad_clean.evt |
| Size (bytes) | 552,827,520 | 89,303,040 |
| Size | 527.2 MB | 85.2 MB |
| Events in quadrant A | 3,710,308 | 548,711 |
| Events in quadrant B | 3,985,640 | 548,799 |
| Events in quadrant C | 3,803,984 | 528,296 |
| Events in quadrant D | 4,698,436 | 521,200 |
| Mode SS | |||
|---|---|---|---|
| Quadrant | BADHDUFLAG | Total packets | Discarded packets |
| A | 0 | 166 | 0 |
| B | 0 | 166 | 0 |
| C | 0 | 166 | 0 |
| D | 0 | 166 | 0 |
| Mode M9 | |||
|---|---|---|---|
| Quadrant | BADHDUFLAG | Total packets | Discarded packets |
| A | 0 | 6 | 0 |
| B | 0 | 6 | 0 |
| C | 0 | 6 | 0 |
| D | 0 | 6 | 0 |
| Mode M0 | |||
|---|---|---|---|
| Quadrant | BADHDUFLAG | Total packets | Discarded packets |
| A | 0 | 16488 | 2 |
| B | 0 | 17131 | 2 |
| C | 0 | 16601 | 2 |
| D | 0 | 19740 | 2 |
| Quadrant | Total seconds | Saturated seconds | Saturation percentage |
|---|---|---|---|
| A | 8006 | 125 | 1.561329% |
| B | 8006 | 176 | 2.198351% |
| C | 8006 | 165 | 2.060954% |
| D | 8007 | 179 | 2.235544% |
Noise dominated data is calculated using 1-second bins in cleaned event files. If a bin has >2000 counts, and if more than 50% of those come from <1% of pixels, then it is considered to be noise-dominated and hence unusable.
| Quadrant | # 1 sec bins | Bins with >0 counts | Bins with >2000 counts | High rate bins dominated by noise | Noise dominated (total time) | Noise dominated (detector-on time) | Marked lightcurve |
|---|---|---|---|---|---|---|---|
| A | 8671 | 8008 | 0 | 0 | 0.00% | 0.00% | 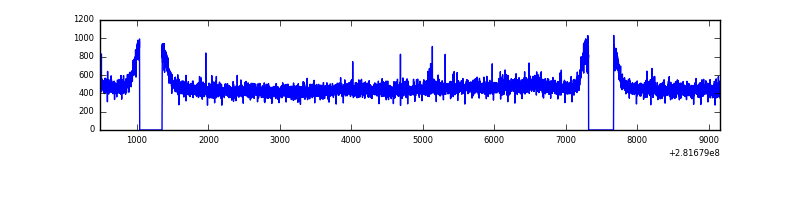 |
| B | 8671 | 8007 | 2 | 2 | 0.02% | 0.02% | 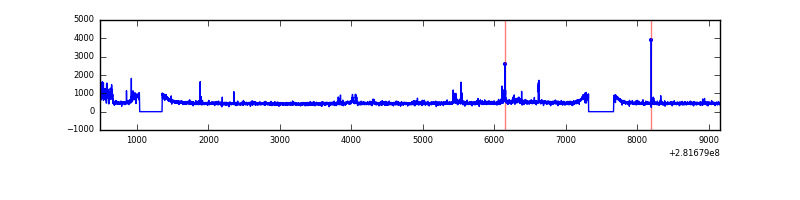 |
| C | 8671 | 8008 | 1 | 1 | 0.01% | 0.01% | 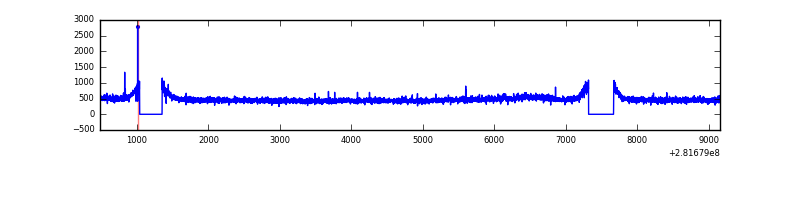 |
| D | 8672 | 8009 | 68 | 68 | 0.78% | 0.85% | 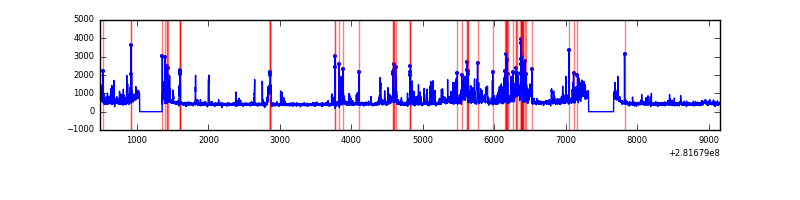 |
Top three noisy pixels from each quadrant. If the there are fewer than three noisy pixels in the level2.evt file, extra rows are filled as -1
| Pixel properties | Quadrant properties | ||||||
|---|---|---|---|---|---|---|---|
| Quadrant | DetID | PixID | Counts | Sigma | Mean | Median | Sigma |
| A | 0 | 226 | 8733 | 39.53 | 962 | 939 | 197.1 |
| A | 0 | 23 | 7565 | 33.61 | 962 | 939 | 197.1 |
| A | 3 | 137 | 7371 | 32.62 | 962 | 939 | 197.1 |
| B | 0 | 189 | 109613 | 576.97 | 963 | 936 | 188.4 |
| B | 0 | 197 | 36924 | 191.06 | 963 | 936 | 188.4 |
| B | 12 | 6 | 26633 | 136.43 | 963 | 936 | 188.4 |
| C | 14 | 238 | 140207 | 630.91 | 927 | 931 | 220.8 |
| C | 3 | 233 | 43301 | 191.93 | 927 | 931 | 220.8 |
| C | 5 | 112 | 7043 | 27.69 | 927 | 931 | 220.8 |
| D | 5 | 222 | 613412 | 2684.18 | 934 | 905 | 228.2 |
| D | 1 | 52 | 316673 | 1383.79 | 934 | 905 | 228.2 |
| D | 13 | 189 | 125310 | 545.18 | 934 | 905 | 228.2 |
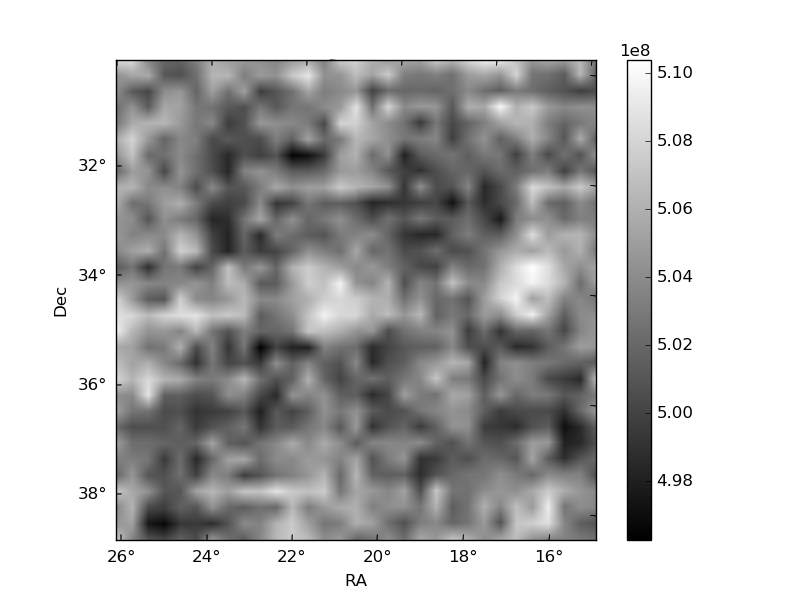
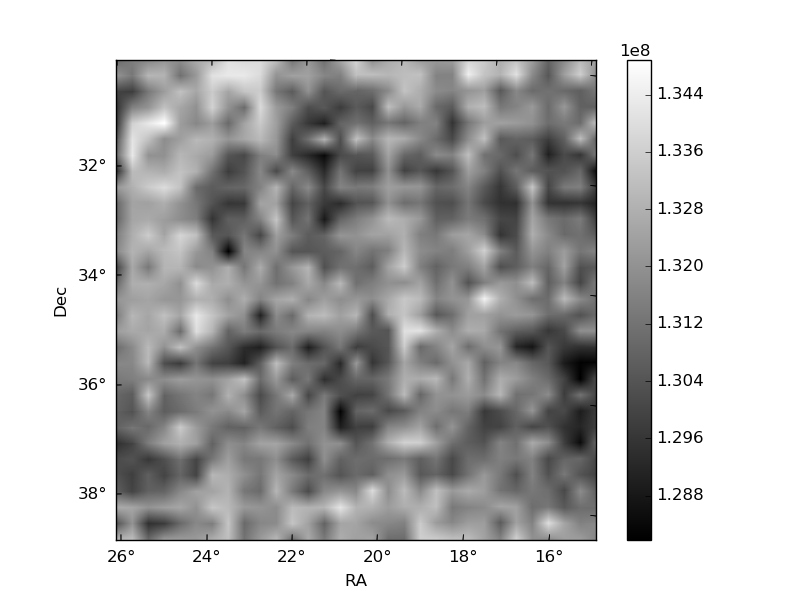
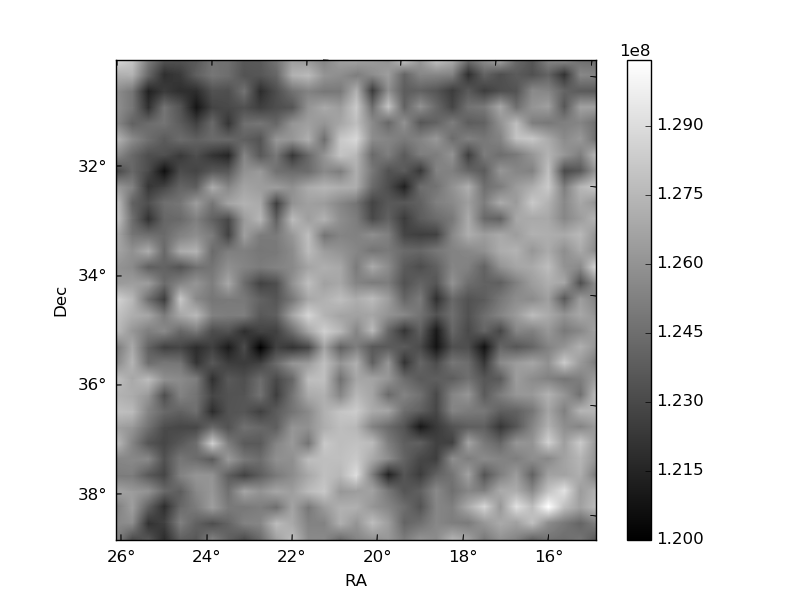
Histogram calculated using DETX and DETY for each event in the final _common_clean file
| Quadrant A | 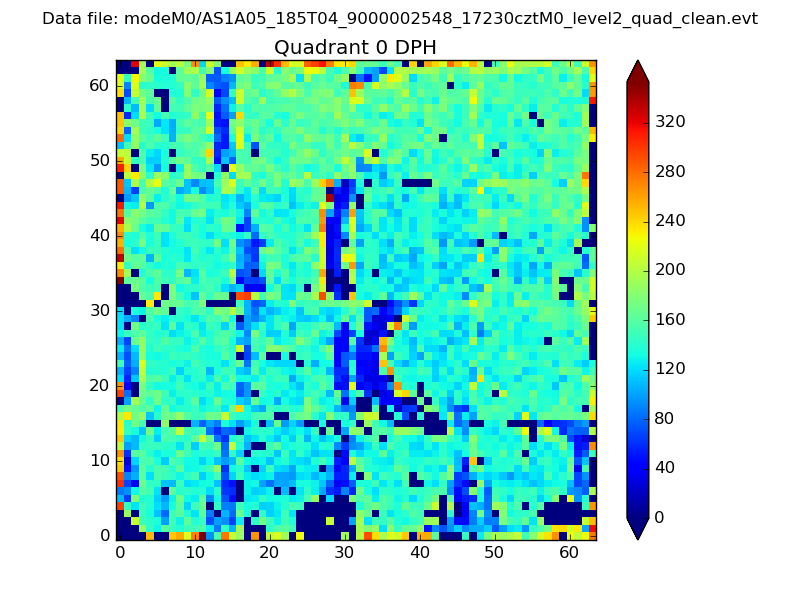 |
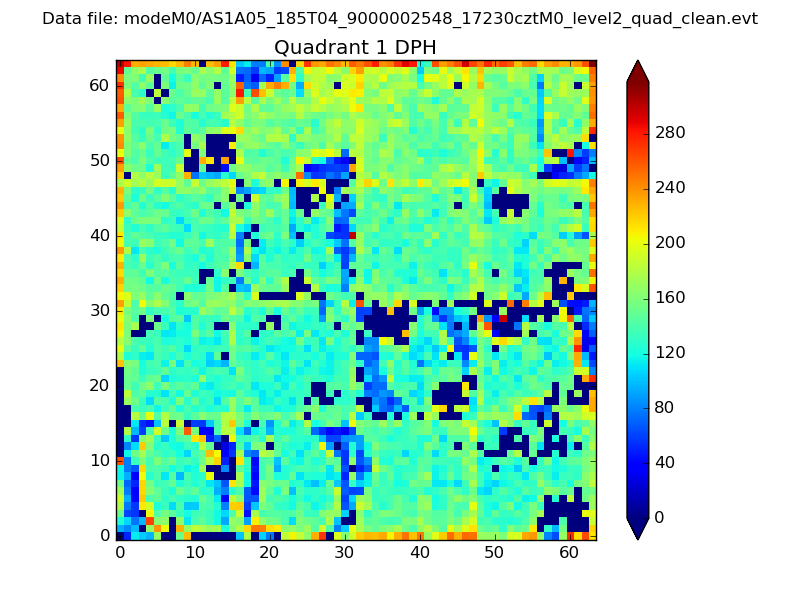 |
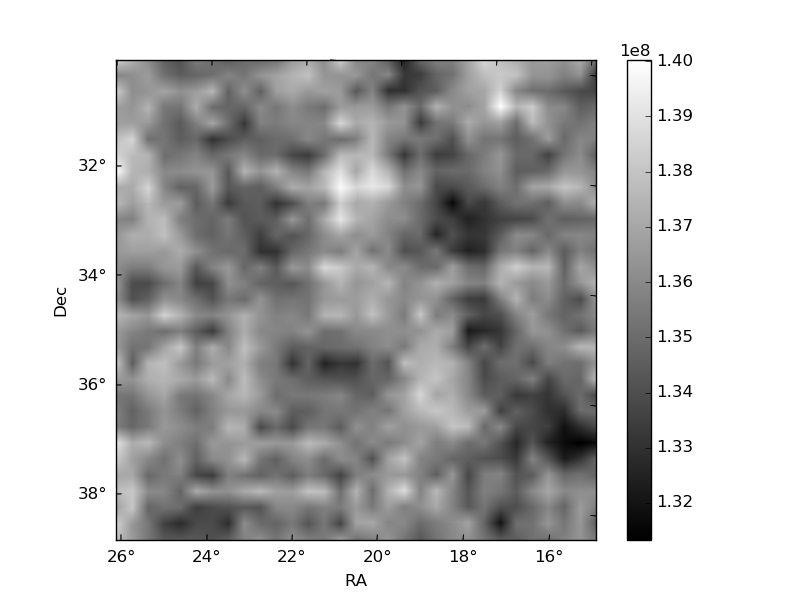
Quadrant B |
|---|---|---|---|
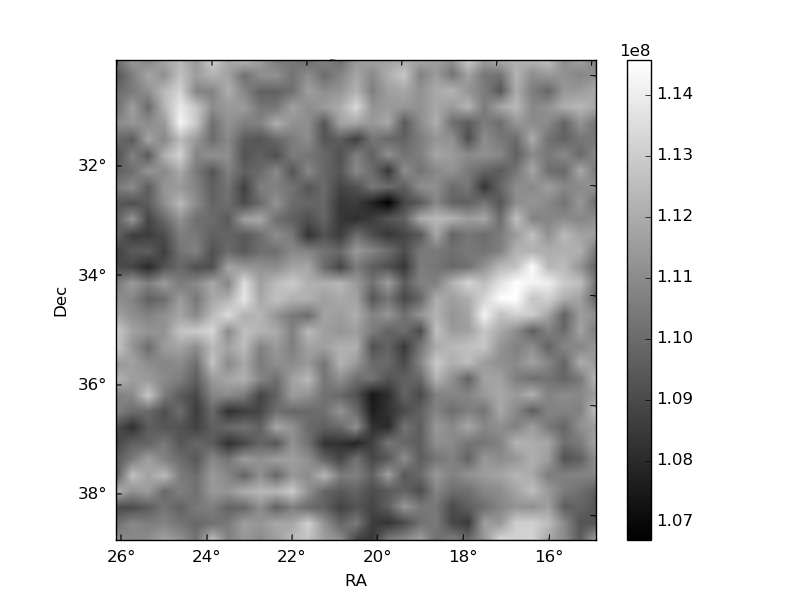
| Quadrant D | 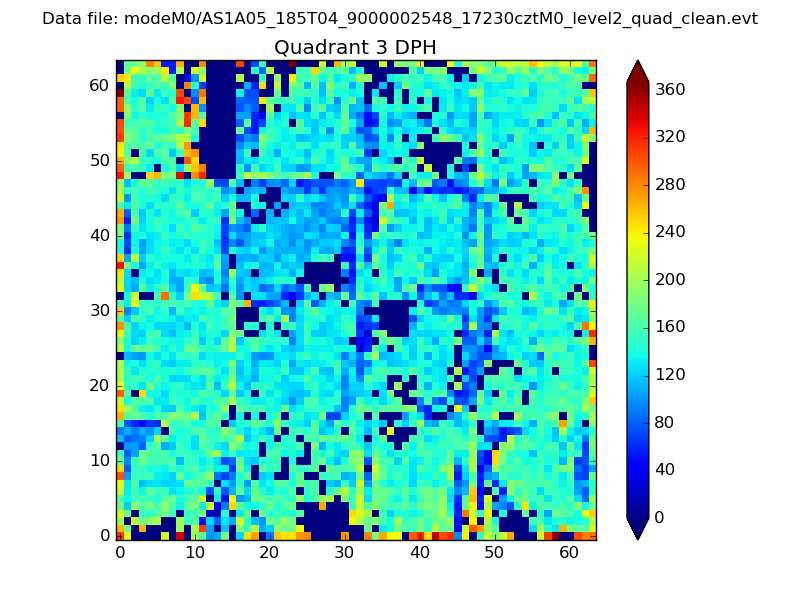 |
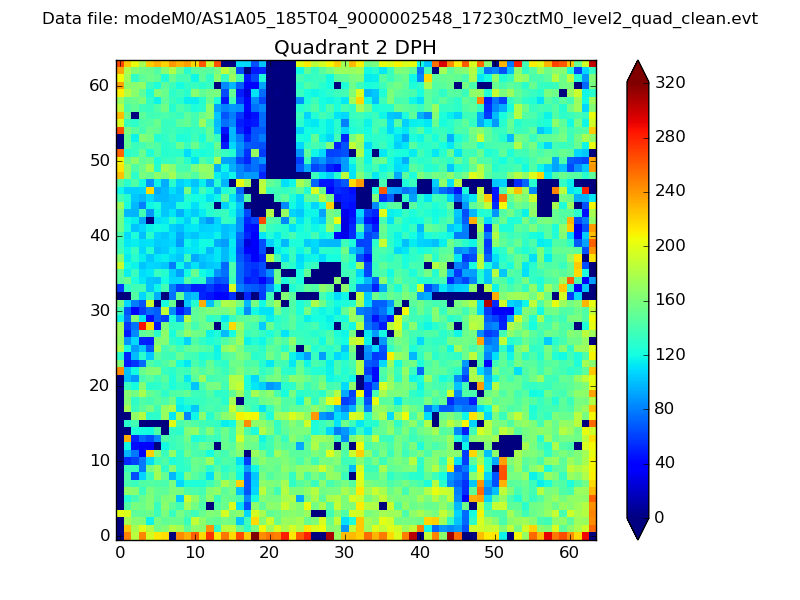 |
Quadrant C |
| Plot type | Count rate plots | Images |
|---|---|---|
| Comparison with Poisson distribution Blue bars denote a histogram of data divided into 1 sec bins. Red curve is a Poisson curve with rate = median count rate of data. |
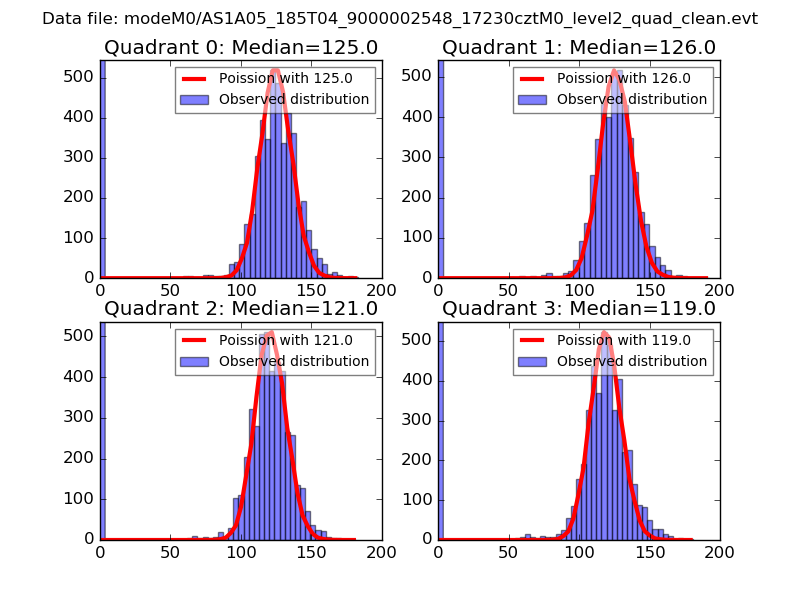 |
 |
| Quadrant-wise count rates Data is divided into 100 sec bins |
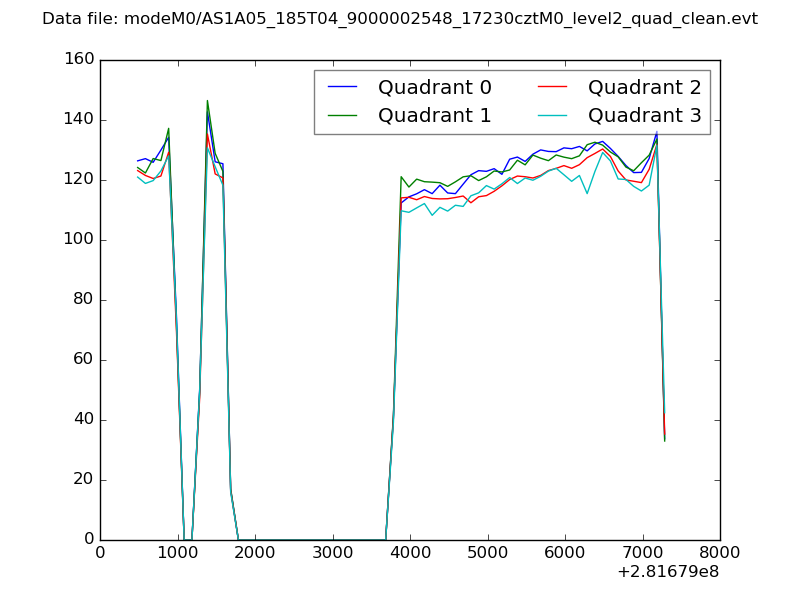 |
|
| Module-wise count rates for Quadrant A Data is divided into 100 sec bins |
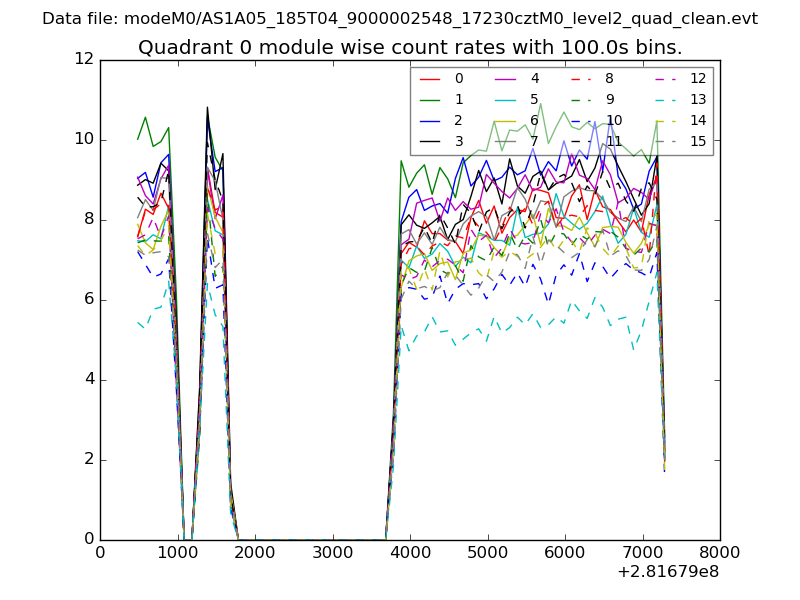 |
 |
| Module-wise count rates for Quadrant B Data is divided into 100 sec bins |
 |
 |
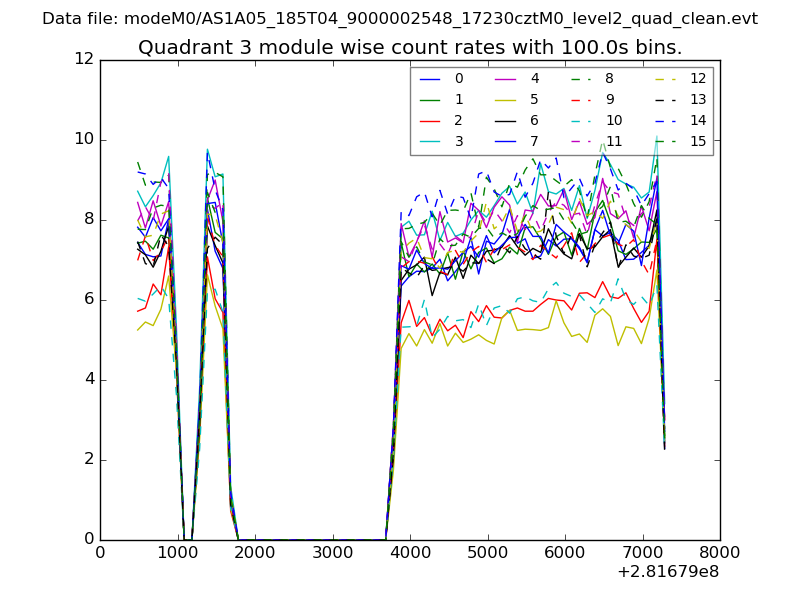
| Module-wise count rates for Quadrant C Data is divided into 100 sec bins |
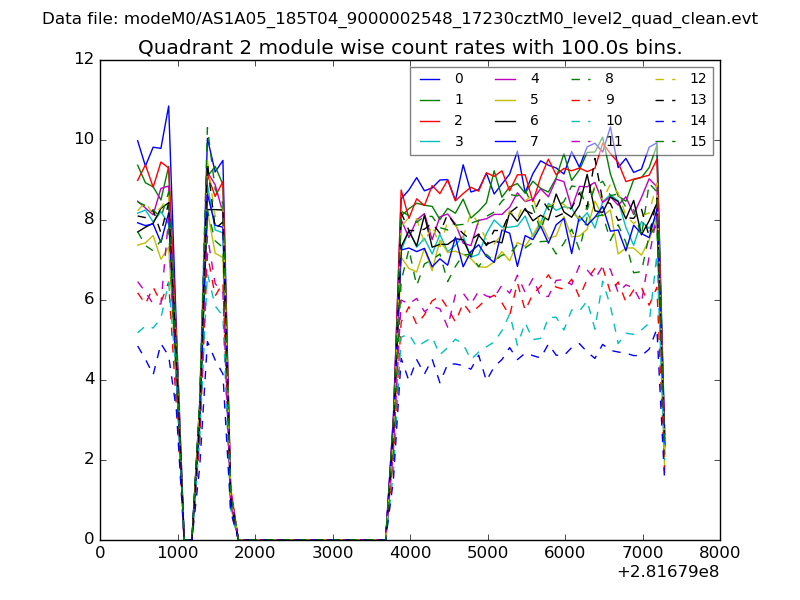 |
 |
| Module-wise count rates for Quadrant D Data is divided into 100 sec bins |
 |
 |
| Parameter | Plot |
|---|---|
| CZT HV Monitor | 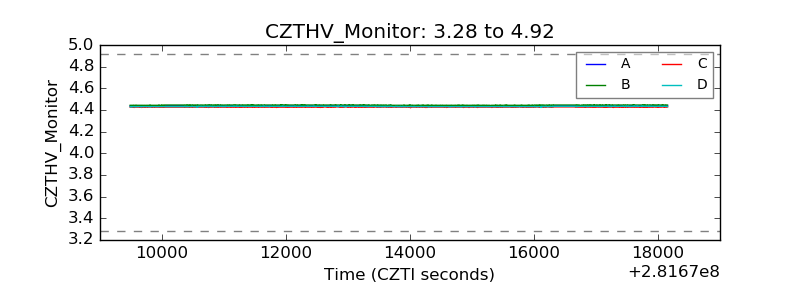 |
| D_VDD | 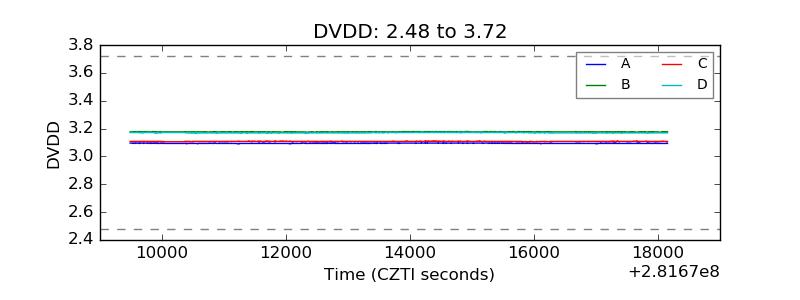 |
| Temperature 1 | 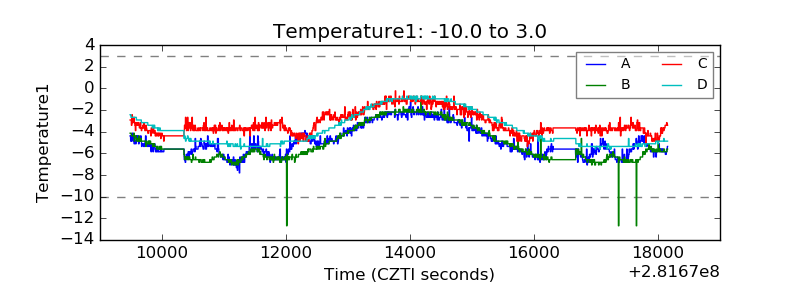 |
| Veto HV Monitor | 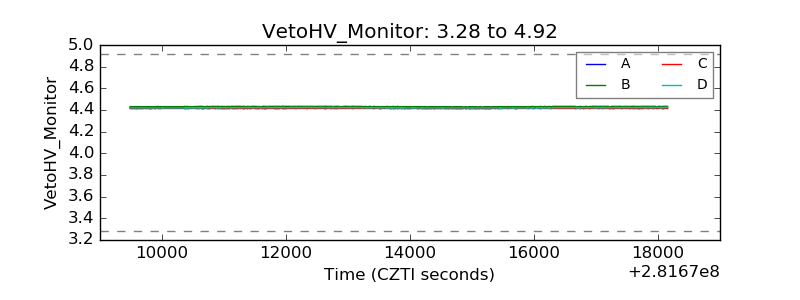 |
| Veto LLD | 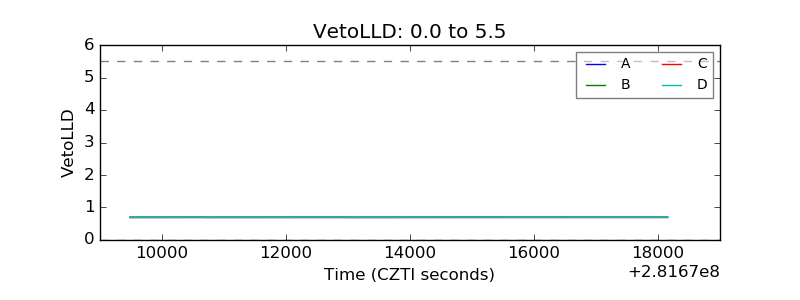 |
| Alpha Counter | 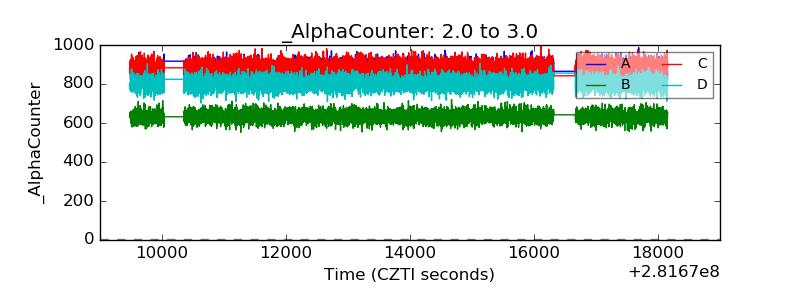 |
| _CPM_Rate | 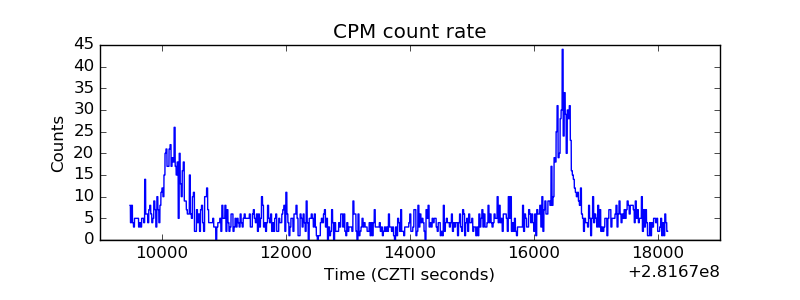 |
| CZT Counter | 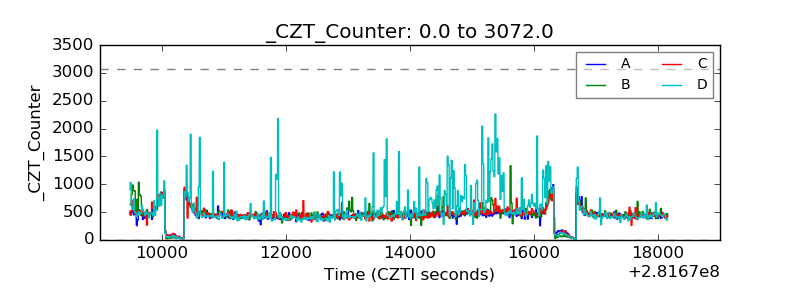 |
| +2.5 Volts monitor |  |
| +5 Volts monitor |  |
| _ROLL_ROT | 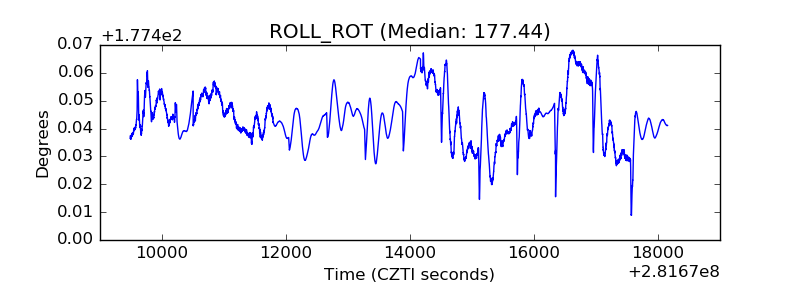 |
| _Roll_DEC | 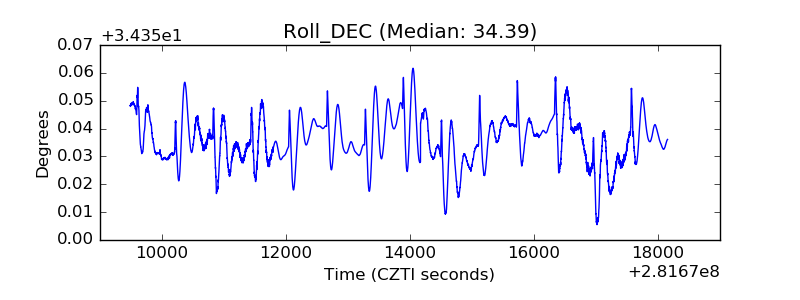 |
| _Roll_RA | 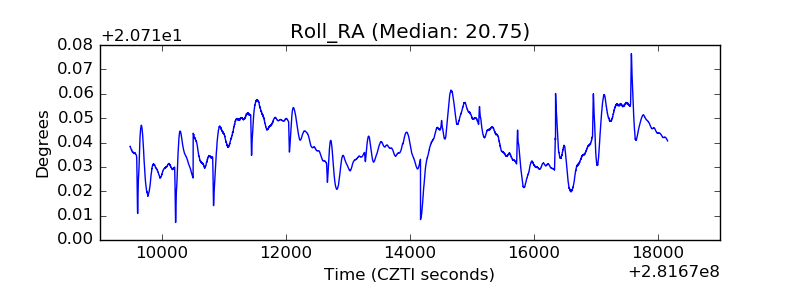 |
| Veto Counter | 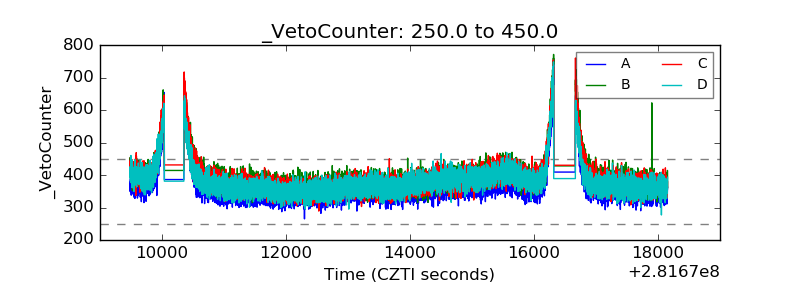 |