| Param | Original file | Final file |
|---|---|---|
| Filename | modeM0/AS1A05_185T04_9000002548_17233cztM0_level2.evt | modeM0/AS1A05_185T04_9000002548_17233cztM0_level2_quad_clean.evt |
| Size (bytes) | 757,031,040 | 143,202,240 |
| Size | 722.0 MB | 136.6 MB |
| Events in quadrant A | 5,258,113 | 905,789 |
| Events in quadrant B | 5,467,362 | 905,092 |
| Events in quadrant C | 5,396,588 | 869,555 |
| Events in quadrant D | 6,021,726 | 857,589 |
| Mode SS | |||
|---|---|---|---|
| Quadrant | BADHDUFLAG | Total packets | Discarded packets |
| A | 0 | 236 | 0 |
| B | 0 | 236 | 0 |
| C | 0 | 236 | 0 |
| D | 0 | 236 | 0 |
| Mode M9 | |||
|---|---|---|---|
| Quadrant | BADHDUFLAG | Total packets | Discarded packets |
| A | 0 | 15 | 0 |
| B | 0 | 15 | 0 |
| C | 0 | 15 | 0 |
| D | 0 | 15 | 0 |
| Mode M0 | |||
|---|---|---|---|
| Quadrant | BADHDUFLAG | Total packets | Discarded packets |
| A | 0 | 23538 | 2 |
| B | 0 | 23810 | 2 |
| C | 0 | 23593 | 3 |
| D | 0 | 25999 | 2 |
| Quadrant | Total seconds | Saturated seconds | Saturation percentage |
|---|---|---|---|
| A | 11554 | 164 | 1.419422% |
| B | 11554 | 207 | 1.791587% |
| C | 11553 | 200 | 1.731152% |
| D | 11553 | 250 | 2.163940% |
Noise dominated data is calculated using 1-second bins in cleaned event files. If a bin has >2000 counts, and if more than 50% of those come from <1% of pixels, then it is considered to be noise-dominated and hence unusable.
| Quadrant | # 1 sec bins | Bins with >0 counts | Bins with >2000 counts | High rate bins dominated by noise | Noise dominated (total time) | Noise dominated (detector-on time) | Marked lightcurve |
|---|---|---|---|---|---|---|---|
| A | 13089 | 11557 | 0 | 0 | 0.00% | 0.00% | 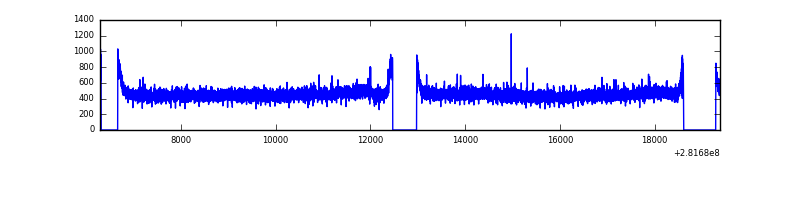 |
| B | 13089 | 11556 | 2 | 2 | 0.02% | 0.02% | 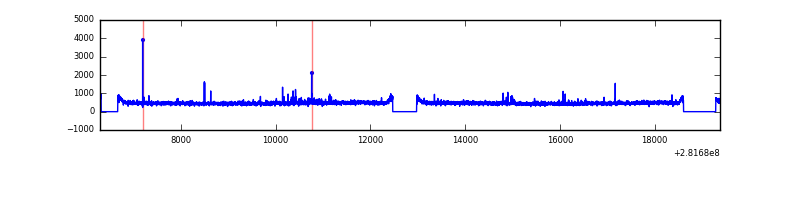 |
| C | 13088 | 11556 | 0 | 0 | 0.00% | 0.00% | 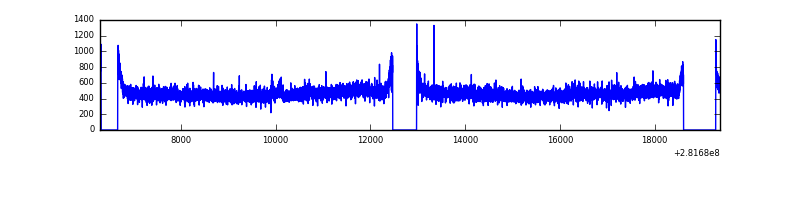 |
| D | 13088 | 11556 | 97 | 97 | 0.74% | 0.84% | 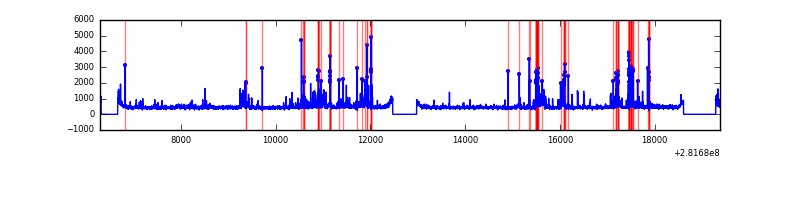 |
Top three noisy pixels from each quadrant. If the there are fewer than three noisy pixels in the level2.evt file, extra rows are filled as -1
| Pixel properties | Quadrant properties | ||||||
|---|---|---|---|---|---|---|---|
| Quadrant | DetID | PixID | Counts | Sigma | Mean | Median | Sigma |
| A | 0 | 23 | 20007 | 66.99 | 1362 | 1331 | 278.8 |
| A | 0 | 226 | 12847 | 41.31 | 1362 | 1331 | 278.8 |
| A | 3 | 137 | 10154 | 31.65 | 1362 | 1331 | 278.8 |
| B | 6 | 36 | 41886 | 152.83 | 1362 | 1324 | 265.4 |
| B | 0 | 189 | 32839 | 118.74 | 1362 | 1324 | 265.4 |
| B | 12 | 111 | 32016 | 115.64 | 1362 | 1324 | 265.4 |
| C | 14 | 238 | 199513 | 646.42 | 1309 | 1317 | 306.6 |
| C | 3 | 233 | 87749 | 281.9 | 1309 | 1317 | 306.6 |
| C | 13 | 61 | 9487 | 26.65 | 1309 | 1317 | 306.6 |
| D | 13 | 189 | 278526 | 857.0 | 1327 | 1287 | 323.5 |
| D | 9 | 65 | 180948 | 555.37 | 1327 | 1287 | 323.5 |
| D | 10 | 70 | 159238 | 488.26 | 1327 | 1287 | 323.5 |
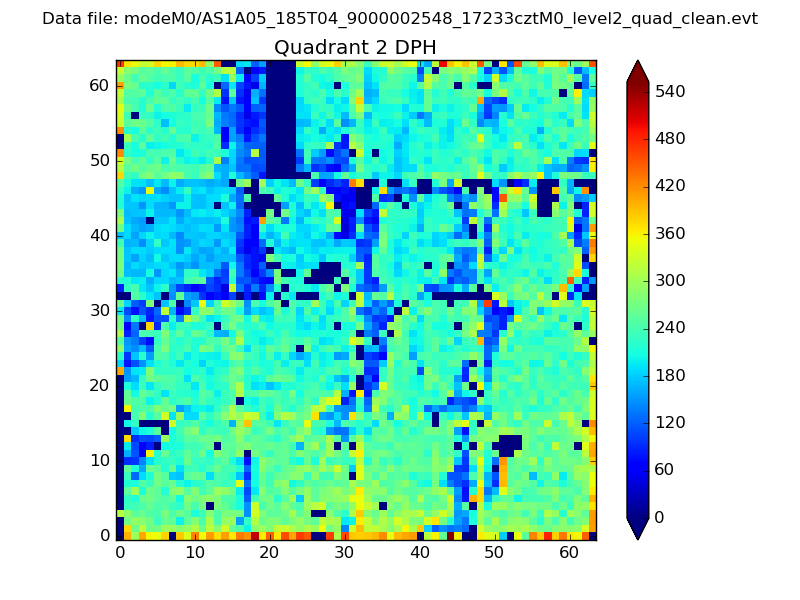
Histogram calculated using DETX and DETY for each event in the final _common_clean file
| Quadrant A | 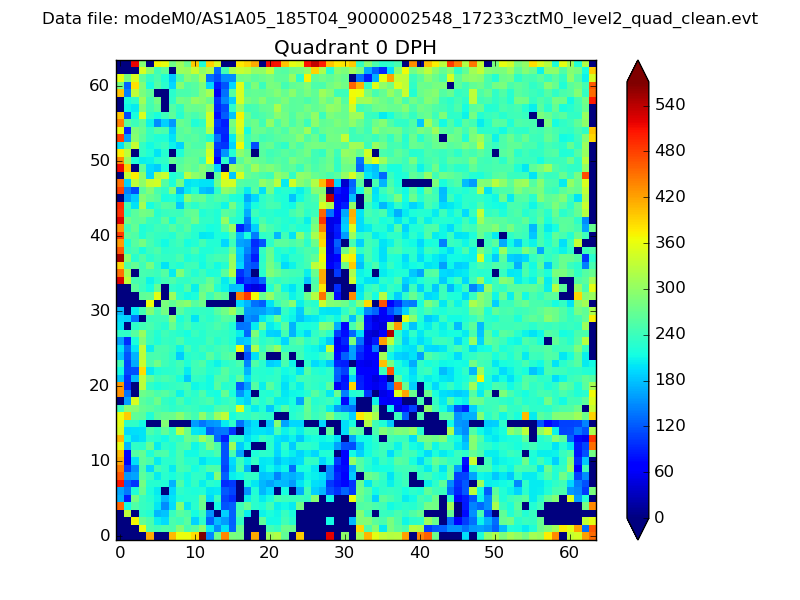 |
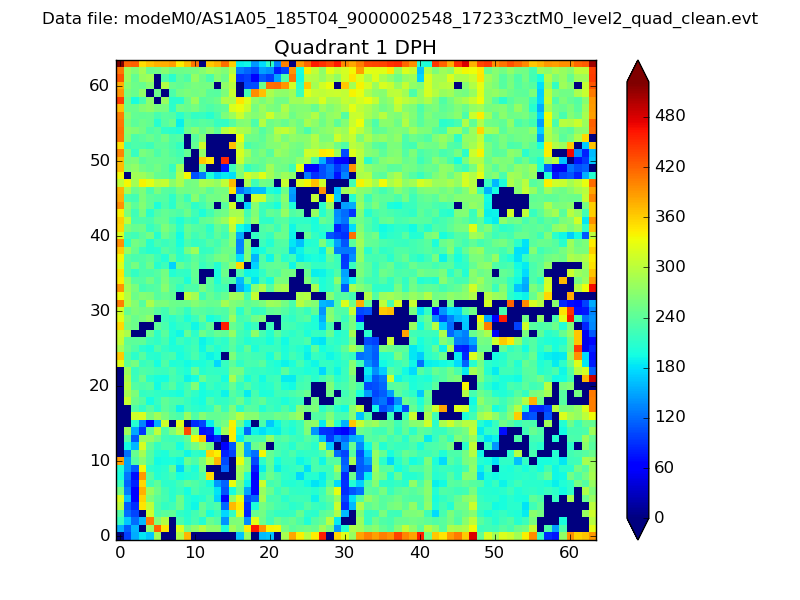 |
Quadrant B |
|---|---|---|---|
| Quadrant D | 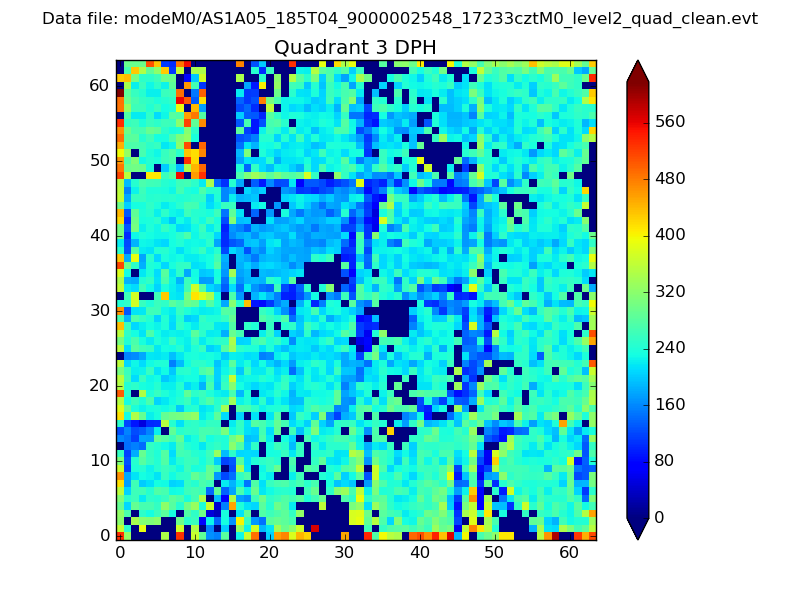 |
 |
Quadrant C |
| Plot type | Count rate plots | Images |
|---|---|---|
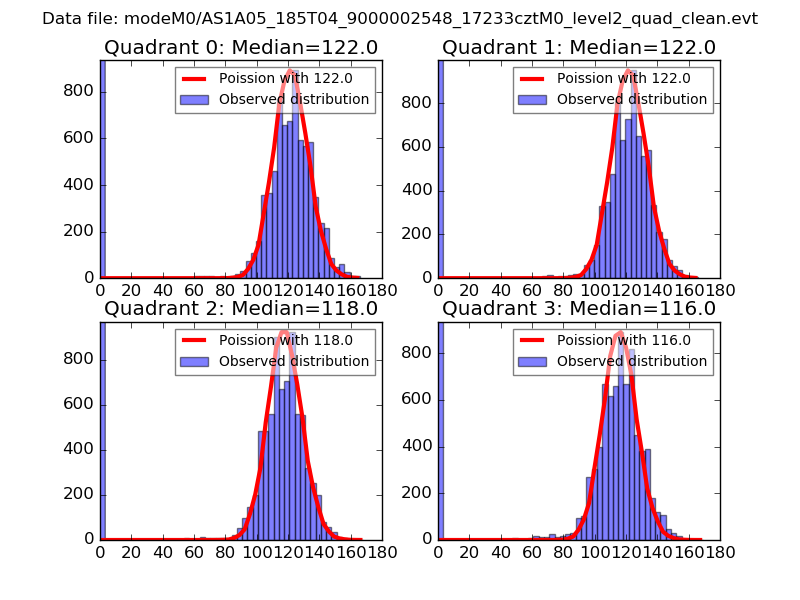
| Comparison with Poisson distribution Blue bars denote a histogram of data divided into 1 sec bins. Red curve is a Poisson curve with rate = median count rate of data. |
 |
 |
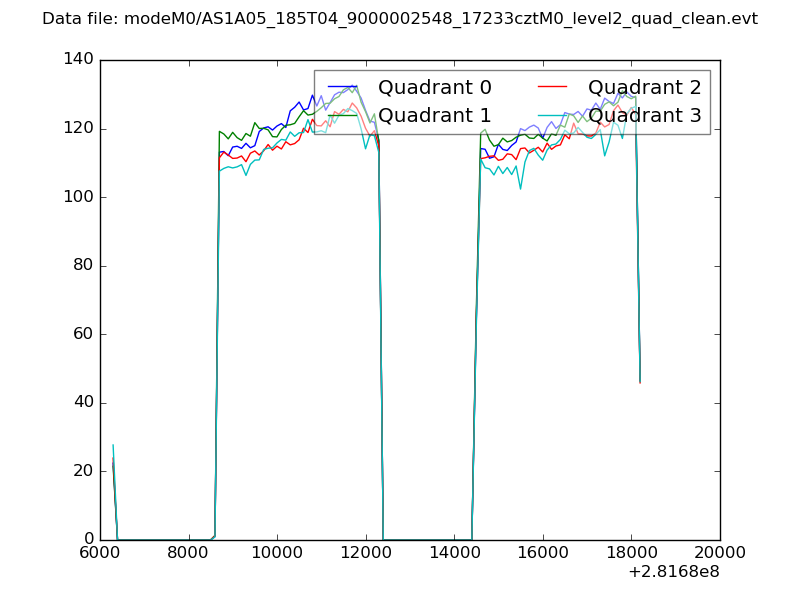
| Quadrant-wise count rates Data is divided into 100 sec bins |
 |
|
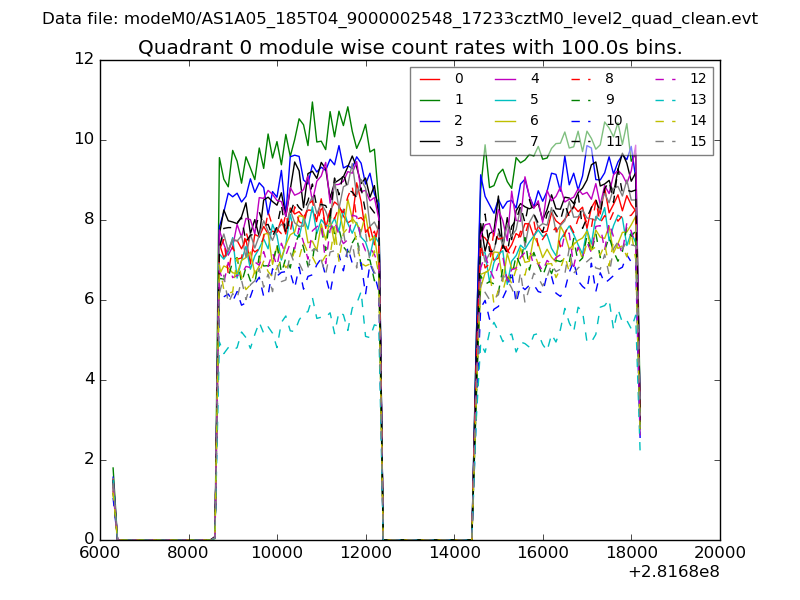
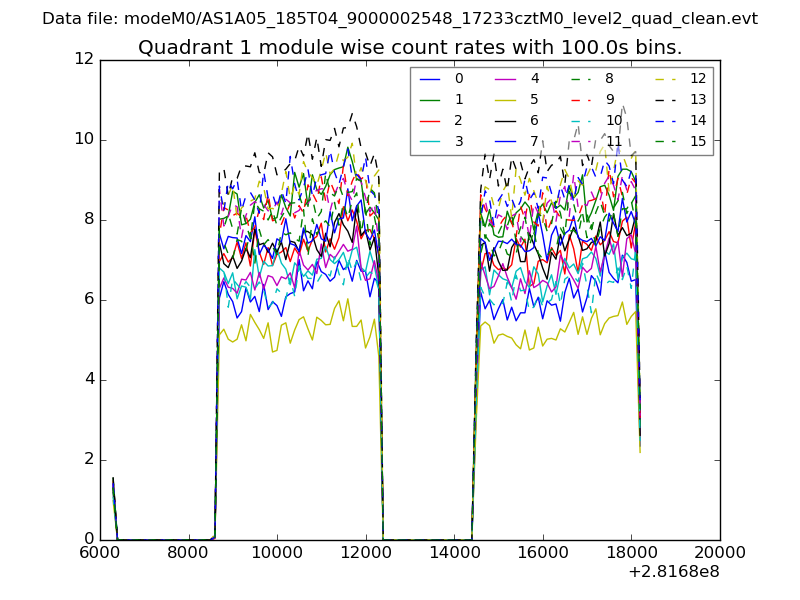
| Module-wise count rates for Quadrant A Data is divided into 100 sec bins |
 |
 |
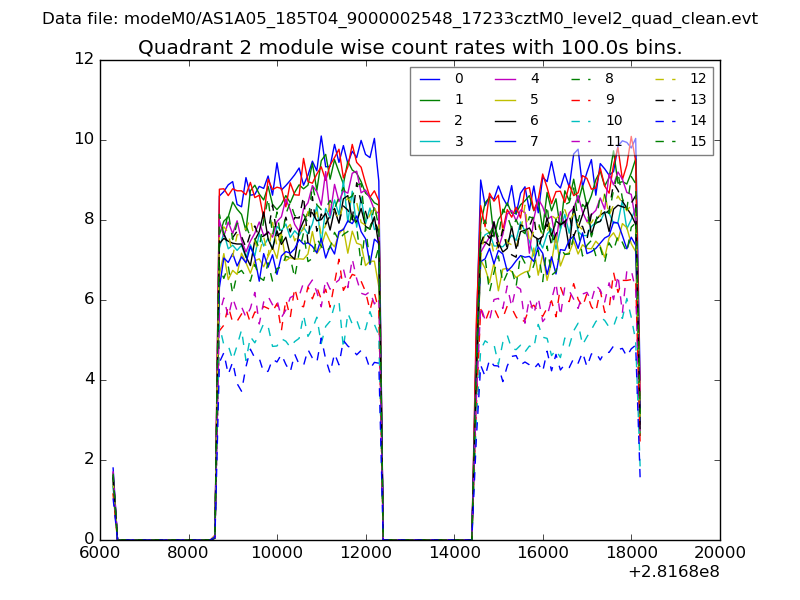
| Module-wise count rates for Quadrant B Data is divided into 100 sec bins |
 |
 |
| Module-wise count rates for Quadrant C Data is divided into 100 sec bins |
 |
 |
| Module-wise count rates for Quadrant D Data is divided into 100 sec bins |
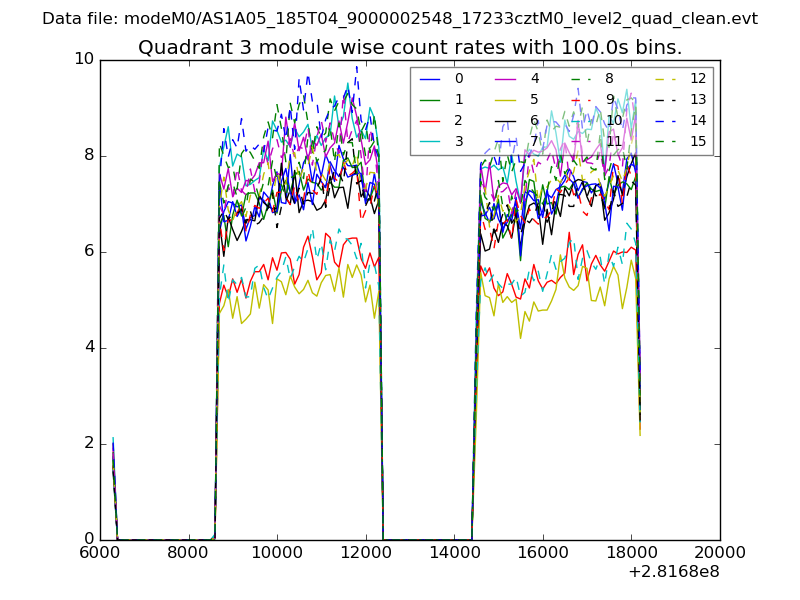 |
 |
| Parameter | Plot |
|---|---|
| CZT HV Monitor | 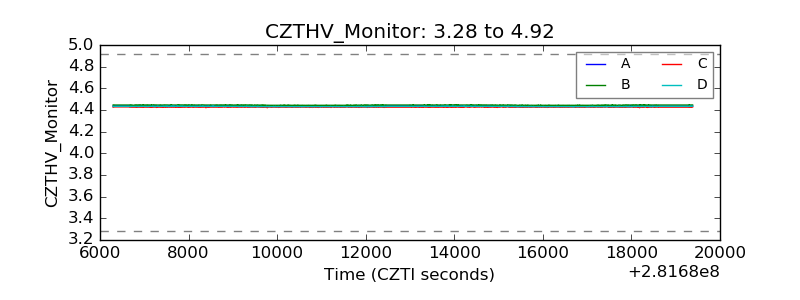 |
| D_VDD | 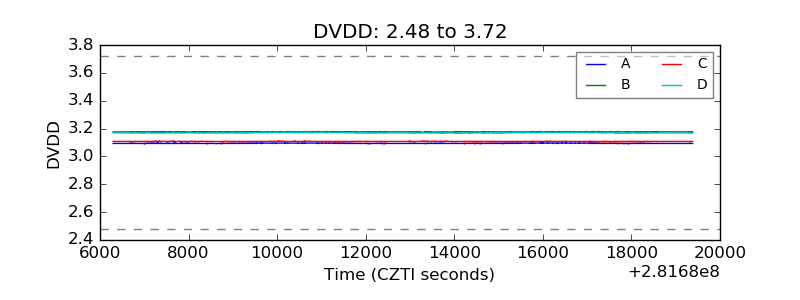 |
| Temperature 1 | 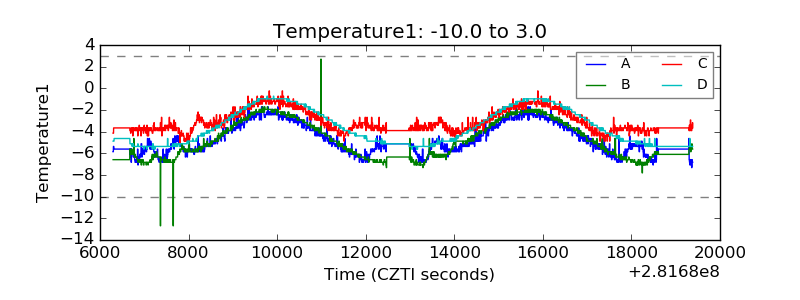 |
| Veto HV Monitor | 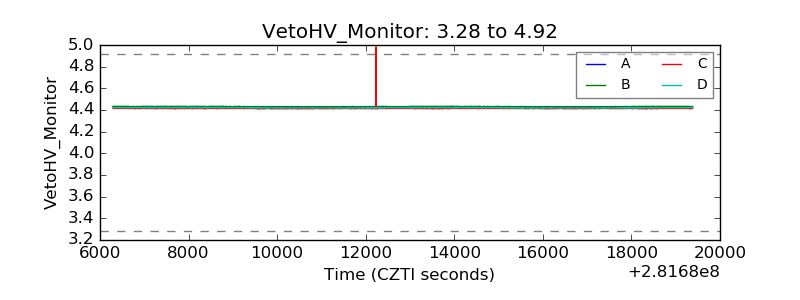 |
| Veto LLD | 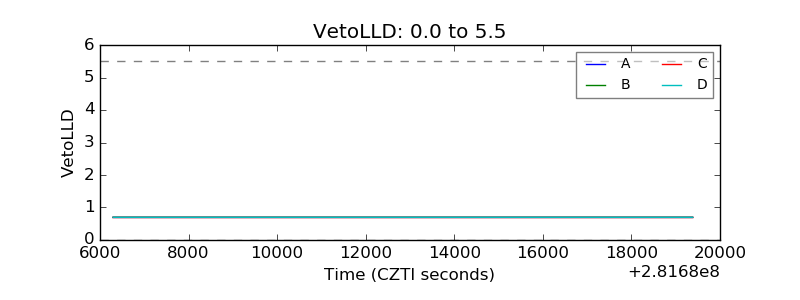 |
| Alpha Counter | 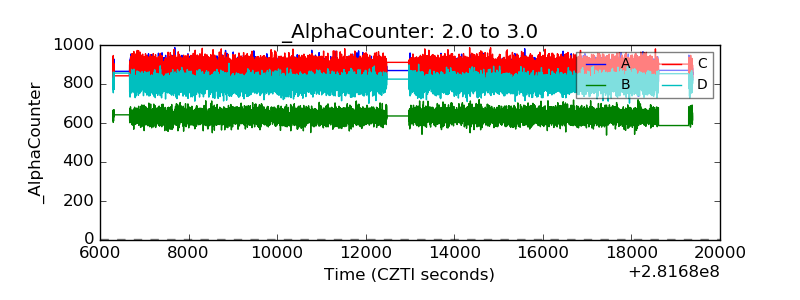 |
| _CPM_Rate | 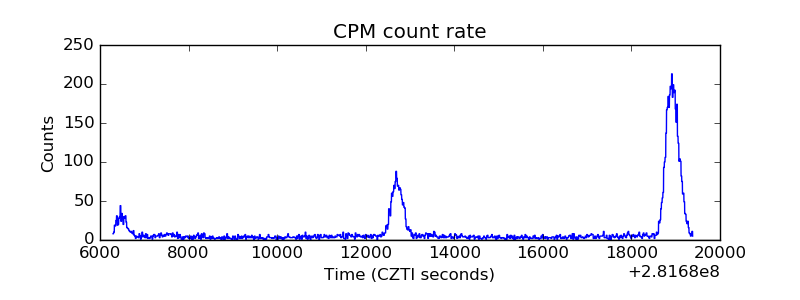 |
| CZT Counter | 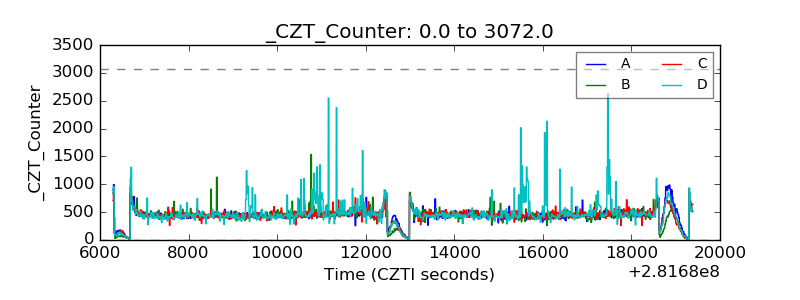 |
| +2.5 Volts monitor |  |
| +5 Volts monitor |  |
| _ROLL_ROT | 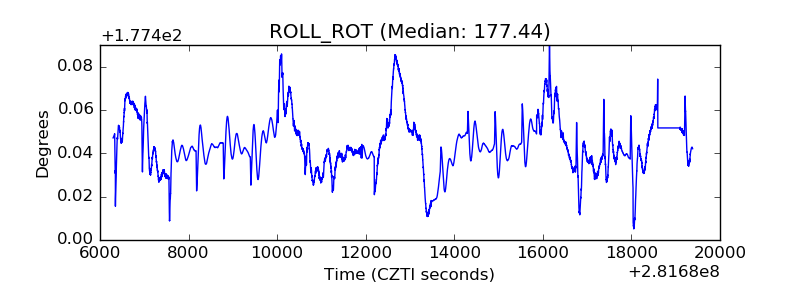 |
| _Roll_DEC | 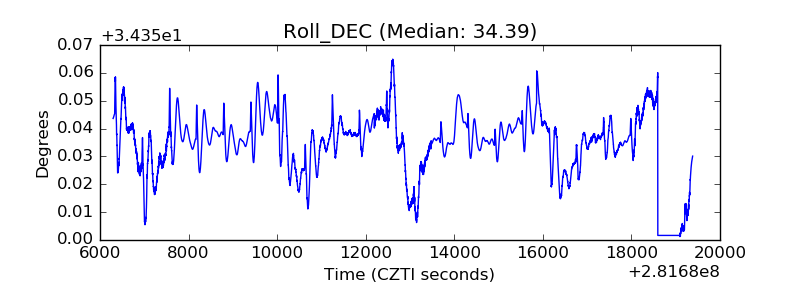 |
| _Roll_RA | 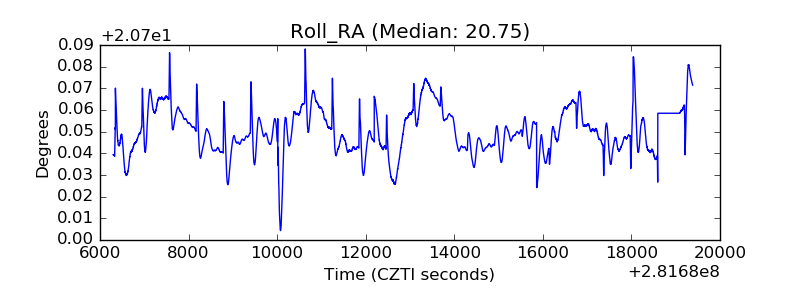 |
| Veto Counter | 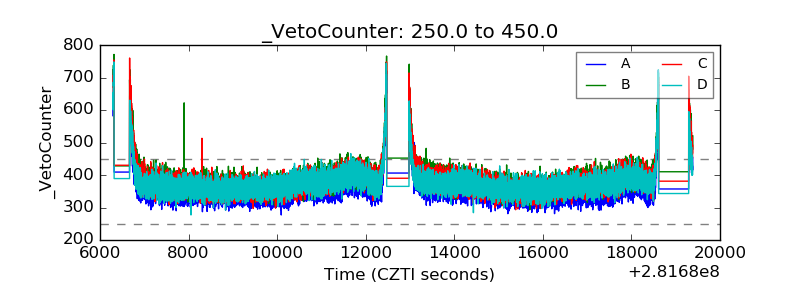 |