| Param | Original file | Final file |
|---|---|---|
| Filename | modeM0/AS1T03_063T01_9000002550cztM0_level2.fits | modeM0/AS1T03_063T01_9000002550cztM0_level2_quad_clean.evt |
| Size (bytes) | 658,944,000 | 628,522,560 |
| Size | 628.4 MB | 599.4 MB |
| Events in quadrant A | 4,055,310 | 3,762,177 |
| Events in quadrant B | 3,898,996 | 3,777,464 |
| Events in quadrant C | 3,949,344 | 3,586,346 |
| Events in quadrant D | 3,438,092 | 3,294,344 |
| Mode M9 | |||
|---|---|---|---|
| Quadrant | BADHDUFLAG | Total packets | Discarded packets |
| A | 0 | 110 | 0 |
| B | 0 | 110 | 0 |
| C | 0 | 110 | 0 |
| D | 0 | 110 | 0 |
| Mode SS | |||
|---|---|---|---|
| Quadrant | BADHDUFLAG | Total packets | Discarded packets |
| A | 0 | 1368 | 0 |
| B | 0 | 1368 | 0 |
| C | 0 | 1368 | 0 |
| D | 0 | 1368 | 0 |
| Mode M0 | |||
|---|---|---|---|
| Quadrant | BADHDUFLAG | Total packets | Discarded packets |
| A | 0 | 141311 | 0 |
| B | 0 | 147603 | 0 |
| C | 0 | 142187 | 0 |
| D | 0 | 155931 | 0 |
| Quadrant | Total seconds | Saturated seconds | Saturation percentage |
|---|---|---|---|
| A | 67298 | 708 | 1.052037% |
| B | 67299 | 928 | 1.378921% |
| C | 67299 | 848 | 1.260048% |
| D | 67299 | 1308 | 1.943565% |
Noise dominated data is calculated using 1-second bins in cleaned event files. If a bin has >2000 counts, and if more than 50% of those come from <1% of pixels, then it is considered to be noise-dominated and hence unusable.
| Quadrant | # 1 sec bins | Bins with >0 counts | Bins with >2000 counts | High rate bins dominated by noise | Noise dominated (total time) | Noise dominated (detector-on time) | Marked lightcurve |
|---|---|---|---|---|---|---|---|
| A | 78270 | 67296 | 0 | 0 | 0.00% | 0.00% |  |
| B | 78270 | 67298 | 0 | 0 | 0.00% | 0.00% |  |
| C | 78270 | 67299 | 0 | 0 | 0.00% | 0.00% |  |
| D | 78270 | 67277 | 0 | 0 | 0.00% | 0.00% | 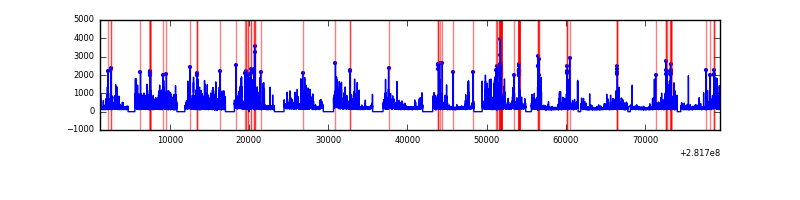 |
Top three noisy pixels from each quadrant. If the there are fewer than three noisy pixels in the level2.evt file, extra rows are filled as -1
| Pixel properties | Quadrant properties | ||||||
|---|---|---|---|---|---|---|---|
| Quadrant | DetID | PixID | Counts | Sigma | Mean | Median | Sigma |
| A | 0 | 29 | 3786 | 10.89 | 1054 | 988 | 256.9 |
| A | 7 | 110 | 3191 | 8.58 | 1054 | 988 | 256.9 |
| A | 9 | 19 | 3042 | 8.0 | 1054 | 988 | 256.9 |
| B | 2 | 9 | 3200 | 10.95 | 1030 | 983 | 202.5 |
| B | 2 | 8 | 2643 | 8.2 | 1030 | 983 | 202.5 |
| B | 5 | 128 | 2605 | 8.01 | 1030 | 983 | 202.5 |
| C | 12 | 241 | 2748 | 6.63 | 1044 | 975 | 267.6 |
| C | 2 | 191 | 2627 | 6.17 | 1044 | 975 | 267.6 |
| C | 3 | 158 | 2603 | 6.08 | 1044 | 975 | 267.6 |
| D | 6 | 231 | 2472 | 6.04 | 981 | 893 | 261.5 |
| D | 3 | 14 | 2464 | 6.01 | 981 | 893 | 261.5 |
| D | 7 | 3 | 2395 | 5.74 | 981 | 893 | 261.5 |
Histogram calculated using DETX and DETY for each event in the final _common_clean file
| Quadrant A | 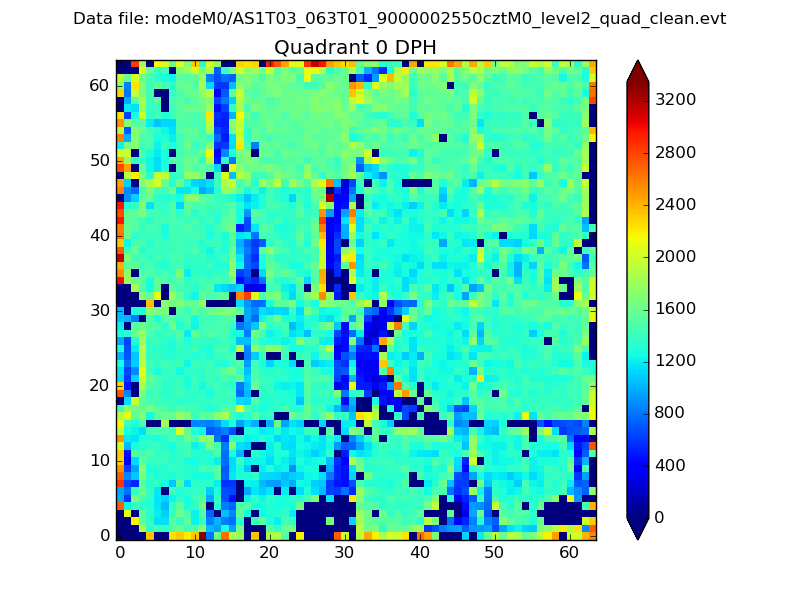 |
 |
Quadrant B |
|---|---|---|---|
| Quadrant D | 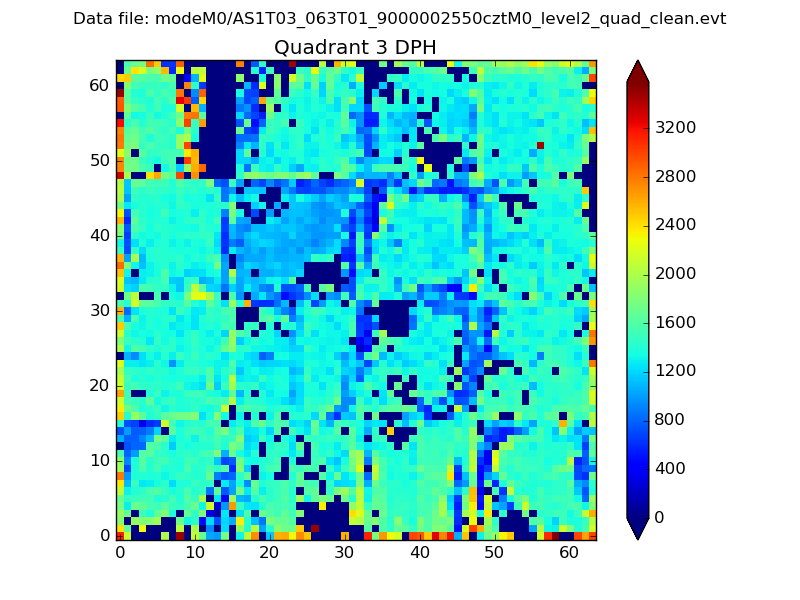 |
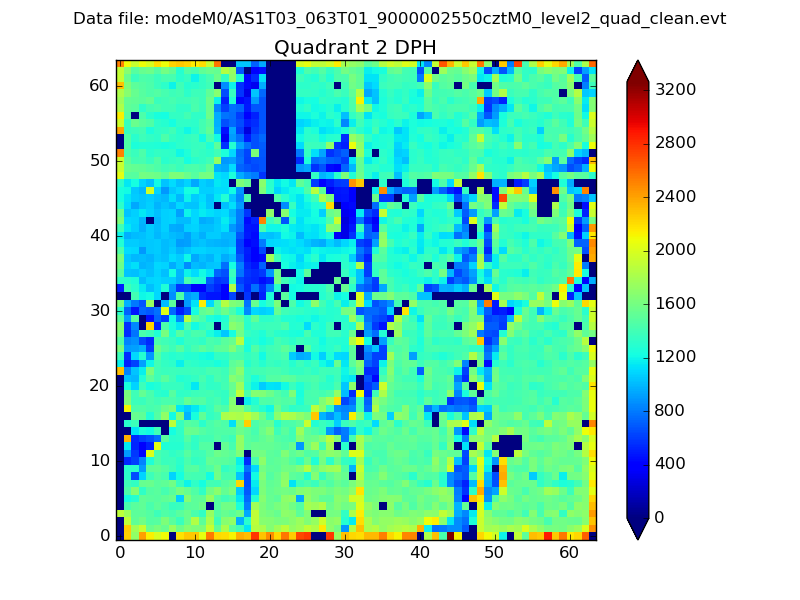 |
Quadrant C |
| Plot type | Count rate plots | Images |
|---|---|---|
| Comparison with Poisson distribution Blue bars denote a histogram of data divided into 1 sec bins. Red curve is a Poisson curve with rate = median count rate of data. |
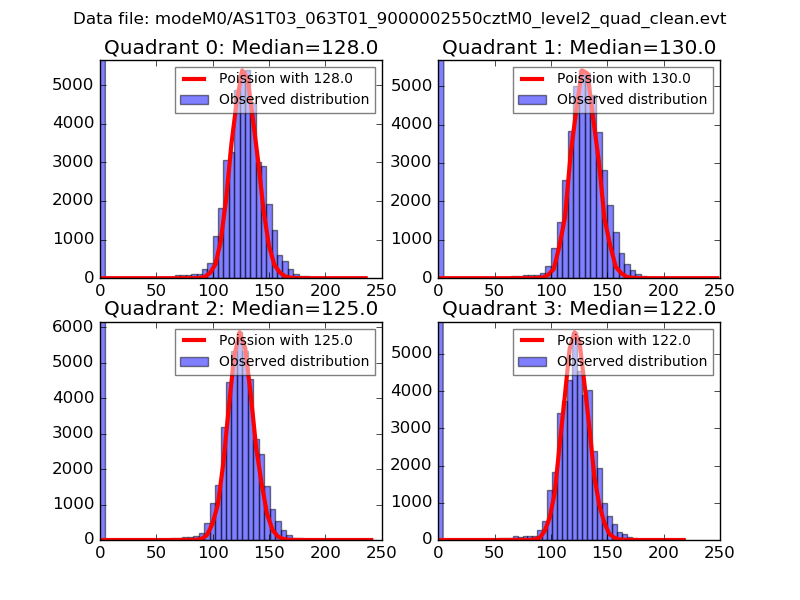 |
 |
| Quadrant-wise count rates Data is divided into 100 sec bins |
 |
|
| Module-wise count rates for Quadrant A Data is divided into 100 sec bins |
 |
 |
| Module-wise count rates for Quadrant B Data is divided into 100 sec bins |
 |
 |
| Module-wise count rates for Quadrant C Data is divided into 100 sec bins |
 |
 |
| Module-wise count rates for Quadrant D Data is divided into 100 sec bins |
 |
 |
| Parameter | Plot |
|---|---|
| CZT HV Monitor |  |
| D_VDD | 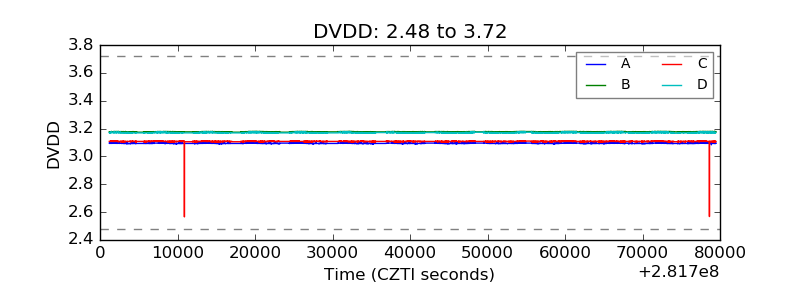 |
| Temperature 1 |  |
| Veto HV Monitor |  |
| Veto LLD | 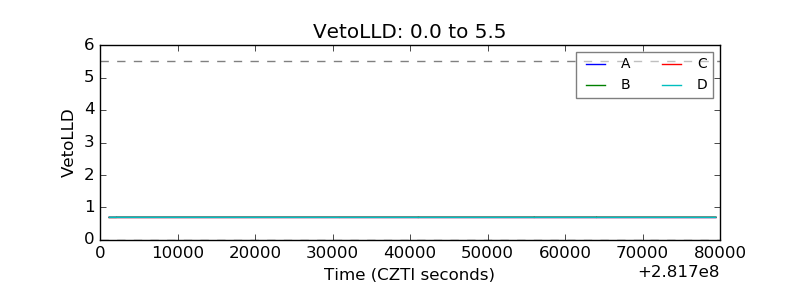 |
| Alpha Counter | 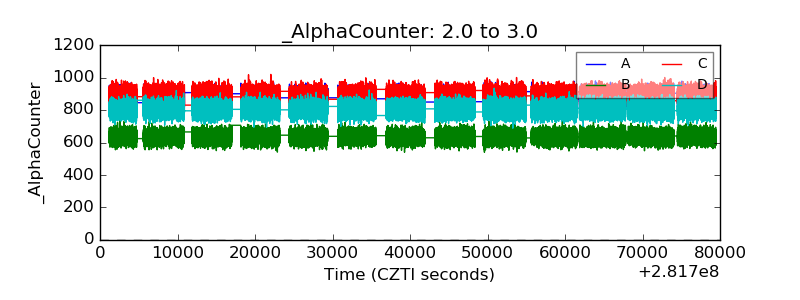 |
| _CPM_Rate | 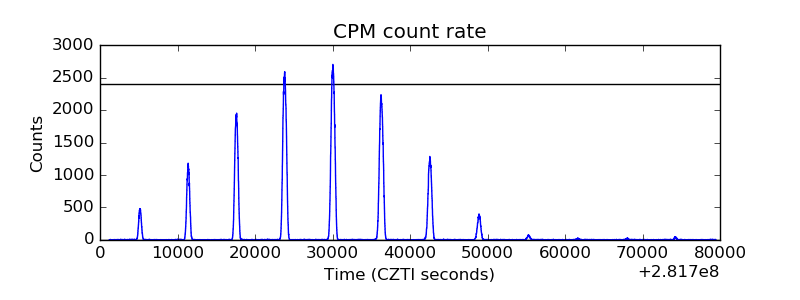 |
| CZT Counter |  |
| +2.5 Volts monitor | 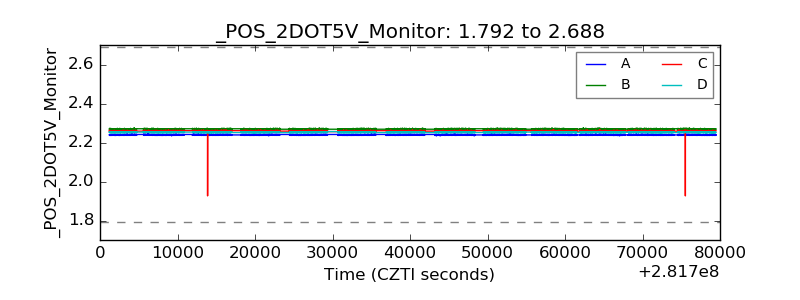 |
| +5 Volts monitor |  |
| _ROLL_ROT |  |
| _Roll_DEC |  |
| _Roll_RA | 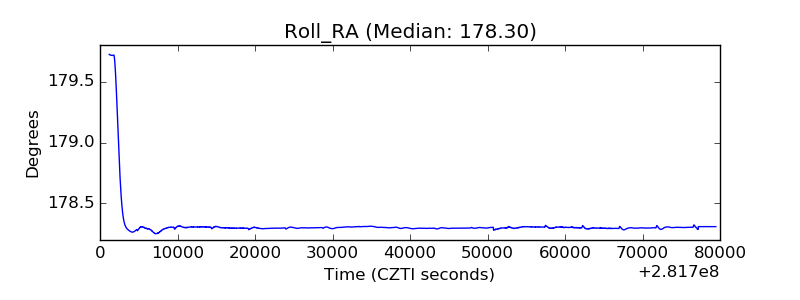 |
| Veto Counter | 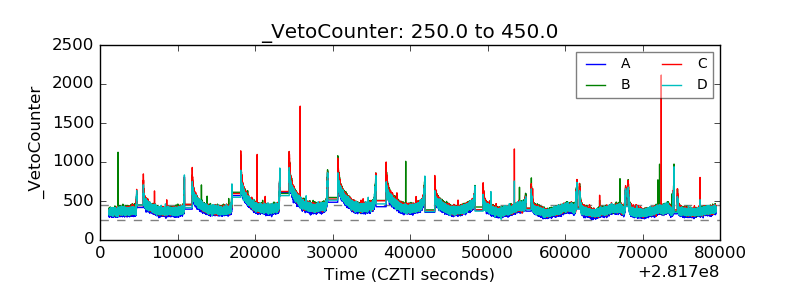 |