| Param | Original file | Final file |
|---|---|---|
| Filename | modeM0/AS1T03_063T01_9000002550_17236cztM0_level2.evt | modeM0/AS1T03_063T01_9000002550_17236cztM0_level2_quad_clean.evt |
| Size (bytes) | 501,220,800 | 66,199,680 |
| Size | 478.0 MB | 63.1 MB |
| Events in quadrant A | 3,394,979 | 393,398 |
| Events in quadrant B | 3,687,656 | 395,283 |
| Events in quadrant C | 3,539,961 | 378,835 |
| Events in quadrant D | 4,104,630 | 371,963 |
| Mode M9 | |||
|---|---|---|---|
| Quadrant | BADHDUFLAG | Total packets | Discarded packets |
| A | 0 | 13 | 0 |
| B | 0 | 14 | 0 |
| C | 0 | 14 | 0 |
| D | 0 | 14 | 0 |
| Mode SS | |||
|---|---|---|---|
| Quadrant | BADHDUFLAG | Total packets | Discarded packets |
| A | 0 | 136 | 0 |
| B | 0 | 136 | 0 |
| C | 0 | 136 | 0 |
| D | 0 | 136 | 0 |
| Mode M0 | |||
|---|---|---|---|
| Quadrant | BADHDUFLAG | Total packets | Discarded packets |
| A | 0 | 14294 | 2 |
| B | 0 | 15184 | 2 |
| C | 0 | 14699 | 2 |
| D | 0 | 16616 | 2 |
| Quadrant | Total seconds | Saturated seconds | Saturation percentage |
|---|---|---|---|
| A | 6664 | 68 | 1.020408% |
| B | 6664 | 81 | 1.215486% |
| C | 6664 | 67 | 1.005402% |
| D | 6664 | 101 | 1.515606% |
Noise dominated data is calculated using 1-second bins in cleaned event files. If a bin has >2000 counts, and if more than 50% of those come from <1% of pixels, then it is considered to be noise-dominated and hence unusable.
| Quadrant | # 1 sec bins | Bins with >0 counts | Bins with >2000 counts | High rate bins dominated by noise | Noise dominated (total time) | Noise dominated (detector-on time) | Marked lightcurve |
|---|---|---|---|---|---|---|---|
| A | 7794 | 6664 | 21 | 21 | 0.27% | 0.32% | 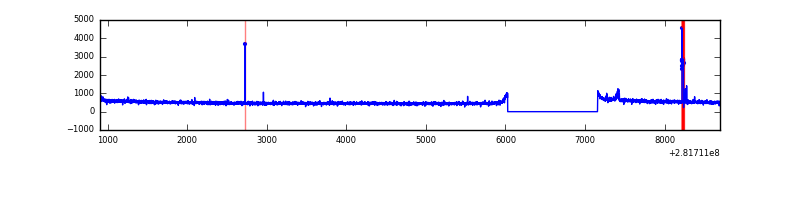 |
| B | 7794 | 6665 | 26 | 26 | 0.33% | 0.39% | 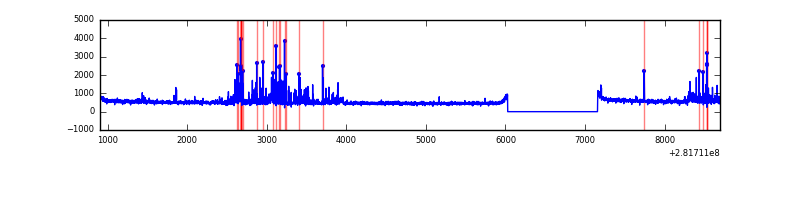 |
| C | 7794 | 6665 | 4 | 4 | 0.05% | 0.06% | 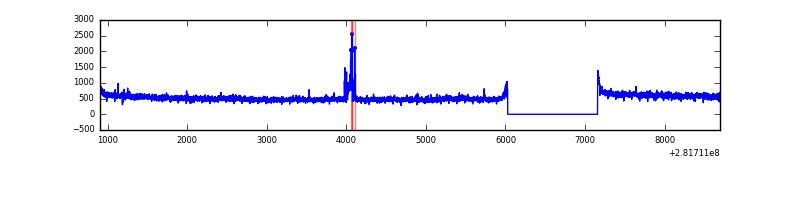 |
| D | 7794 | 6665 | 67 | 67 | 0.86% | 1.01% | 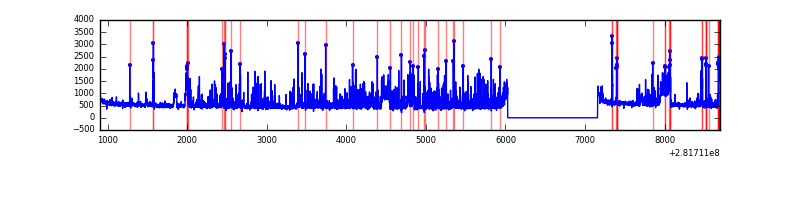 |
Top three noisy pixels from each quadrant. If the there are fewer than three noisy pixels in the level2.evt file, extra rows are filled as -1
| Pixel properties | Quadrant properties | ||||||
|---|---|---|---|---|---|---|---|
| Quadrant | DetID | PixID | Counts | Sigma | Mean | Median | Sigma |
| A | 15 | 174 | 87100 | 499.15 | 858 | 840 | 172.8 |
| A | 0 | 226 | 7874 | 40.7 | 858 | 840 | 172.8 |
| A | 0 | 23 | 7681 | 39.59 | 858 | 840 | 172.8 |
| B | 0 | 189 | 129146 | 797.74 | 851 | 833 | 160.8 |
| B | 7 | 220 | 119092 | 735.24 | 851 | 833 | 160.8 |
| B | 0 | 197 | 61293 | 375.89 | 851 | 833 | 160.8 |
| C | 3 | 233 | 129294 | 673.62 | 824 | 829 | 190.7 |
| C | 14 | 238 | 127940 | 666.52 | 824 | 829 | 190.7 |
| C | 5 | 112 | 63374 | 327.96 | 824 | 829 | 190.7 |
| D | 1 | 52 | 734578 | 3602.28 | 837 | 813 | 203.7 |
| D | 13 | 189 | 83605 | 406.45 | 837 | 813 | 203.7 |
| D | 10 | 70 | 34562 | 165.68 | 837 | 813 | 203.7 |
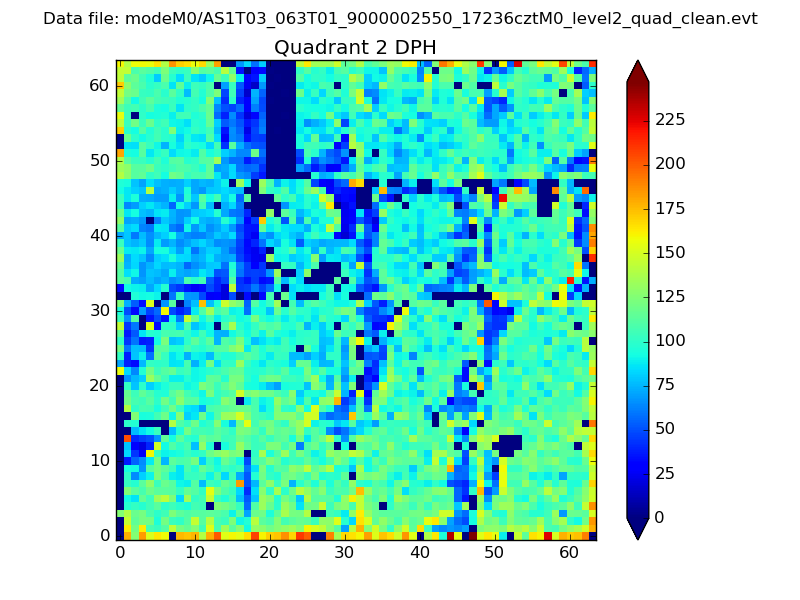
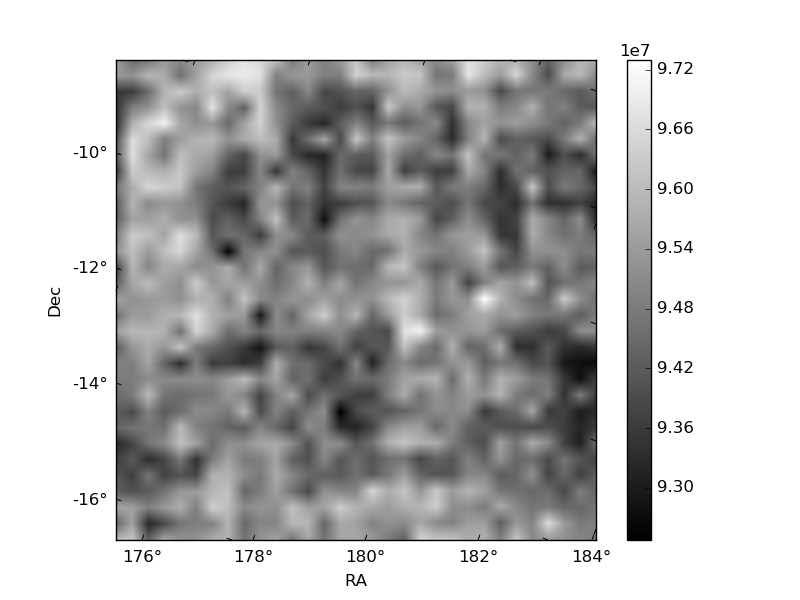
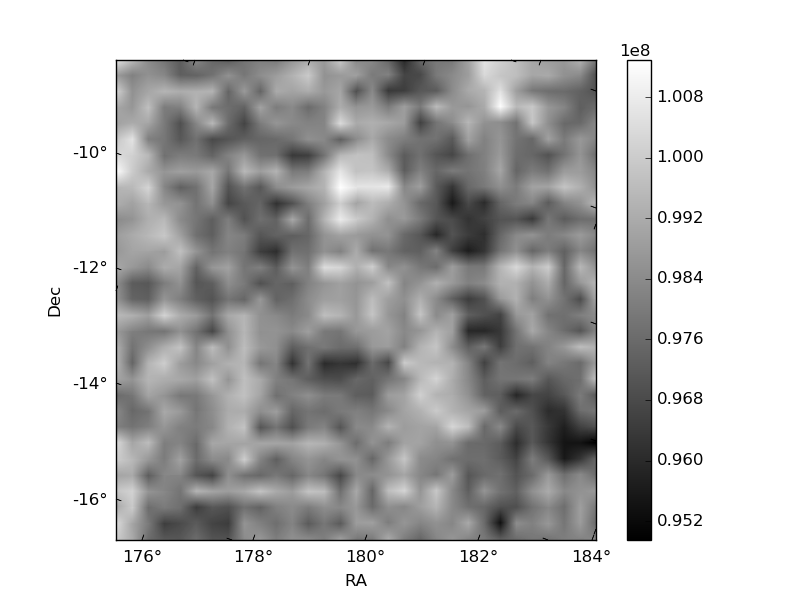
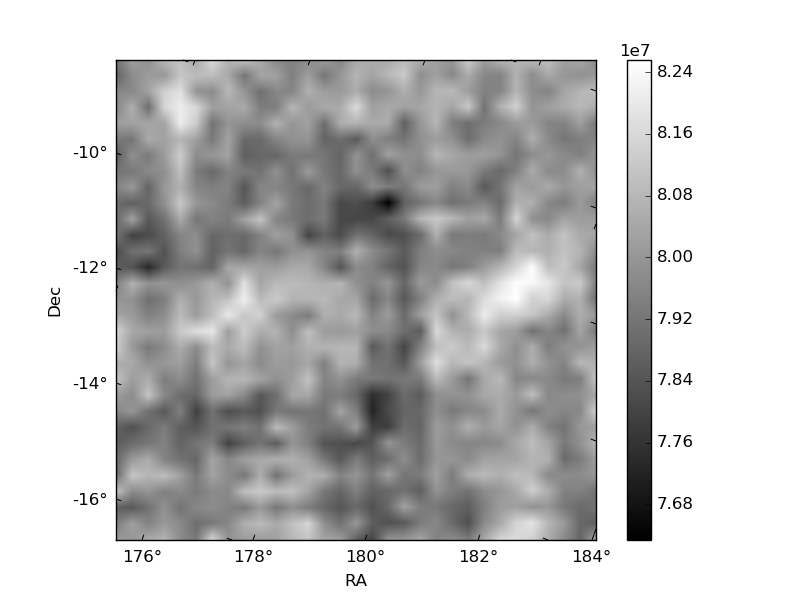
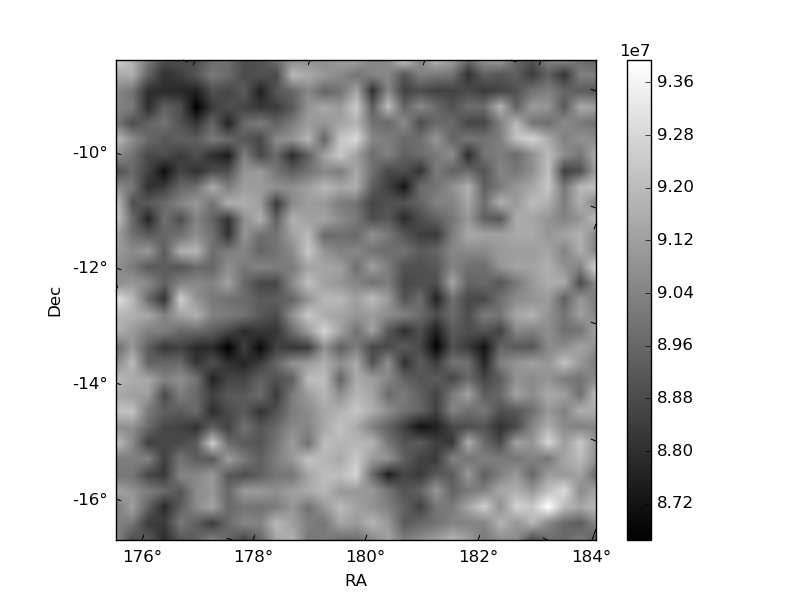
Histogram calculated using DETX and DETY for each event in the final _common_clean file
| Quadrant A | 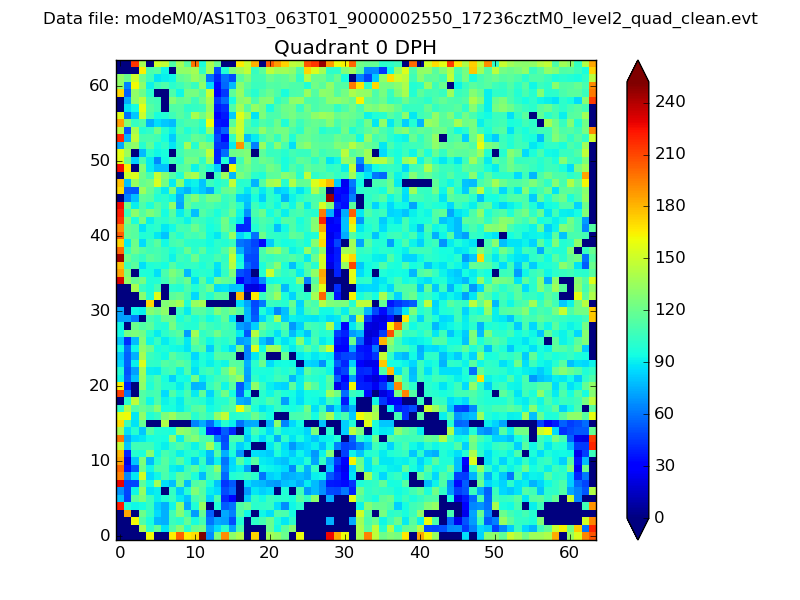 |
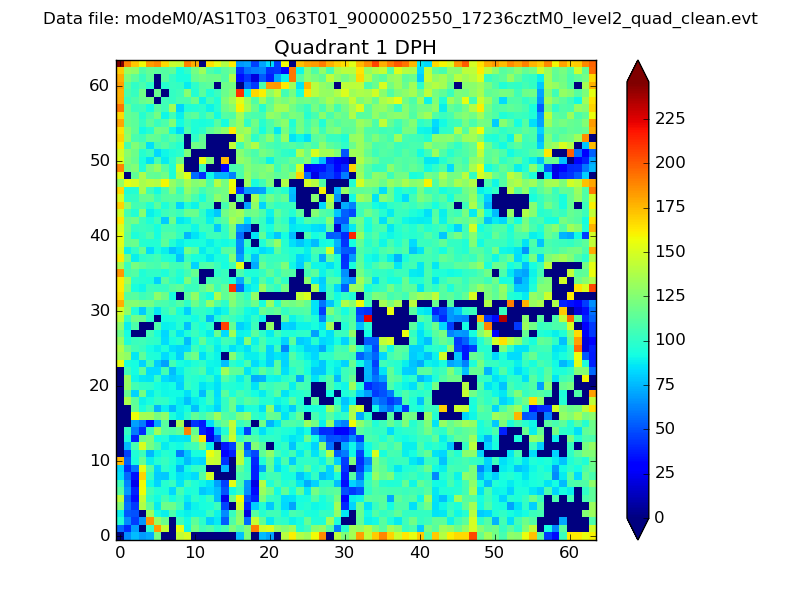 |
Quadrant B |
|---|---|---|---|
| Quadrant D | 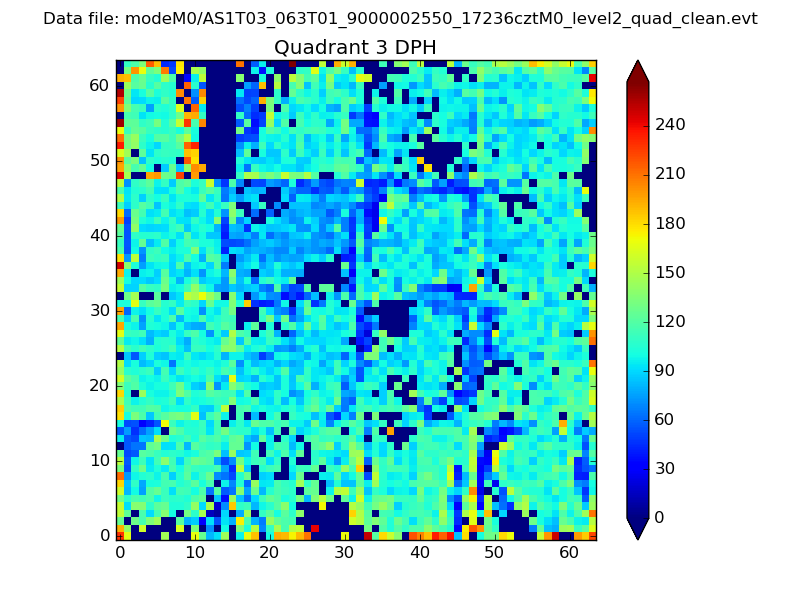 |
 |
Quadrant C |
| Plot type | Count rate plots | Images |
|---|---|---|
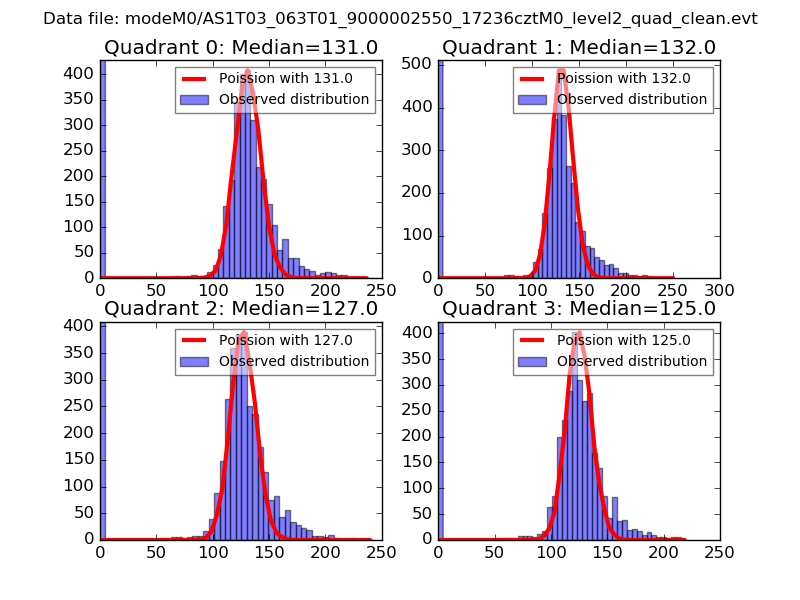
| Comparison with Poisson distribution Blue bars denote a histogram of data divided into 1 sec bins. Red curve is a Poisson curve with rate = median count rate of data. |
 |
 |
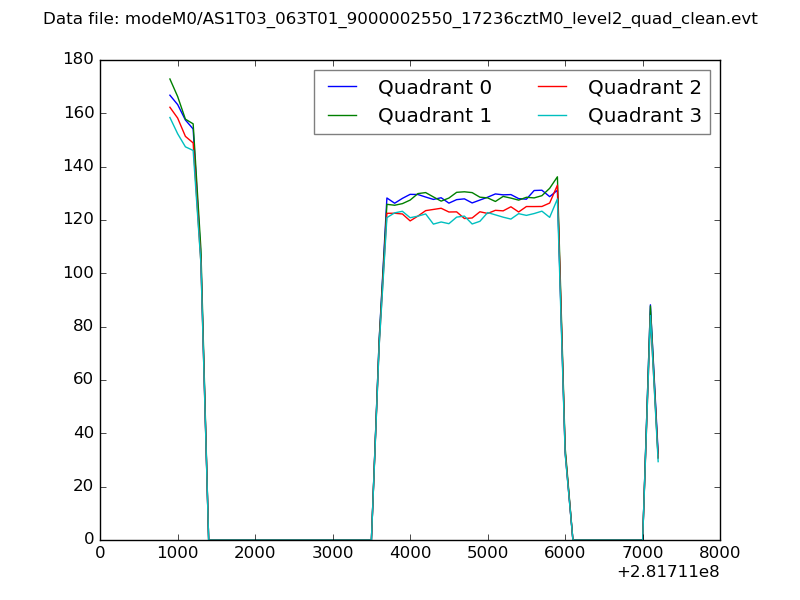
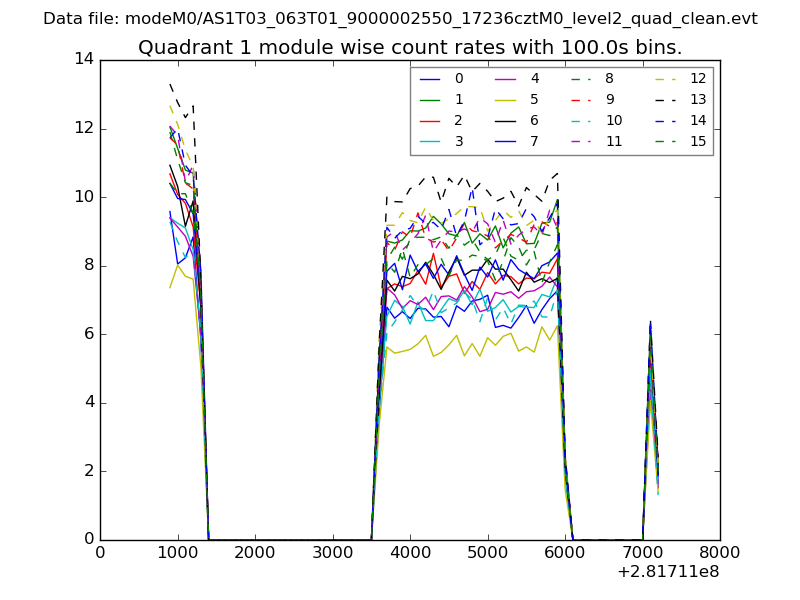
| Quadrant-wise count rates Data is divided into 100 sec bins |
 |
|
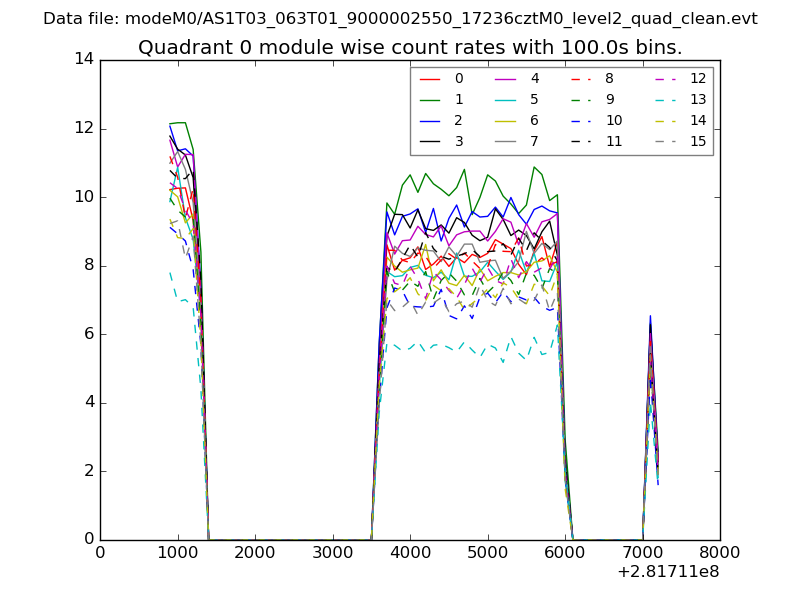
| Module-wise count rates for Quadrant A Data is divided into 100 sec bins |
 |
 |
| Module-wise count rates for Quadrant B Data is divided into 100 sec bins |
 |
 |
| Module-wise count rates for Quadrant C Data is divided into 100 sec bins |
 |
 |
| Module-wise count rates for Quadrant D Data is divided into 100 sec bins |
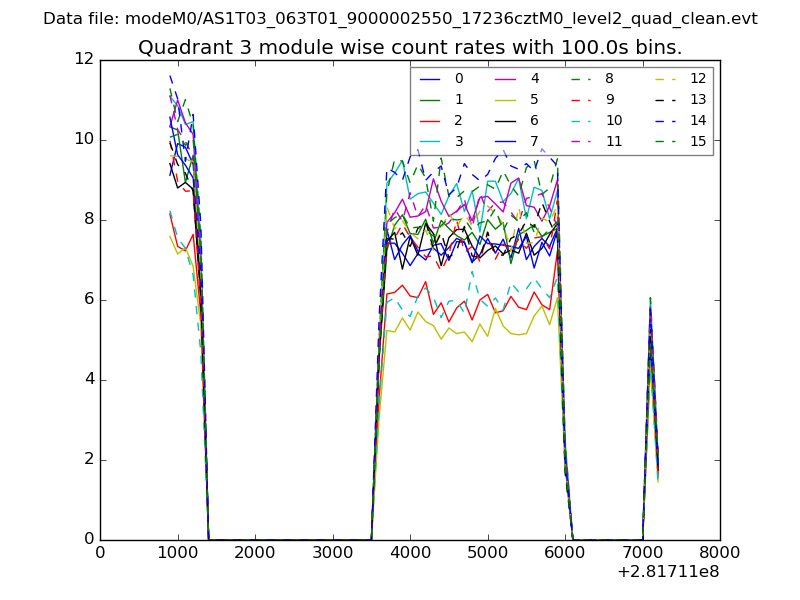 |
 |
| Parameter | Plot |
|---|---|
| CZT HV Monitor | 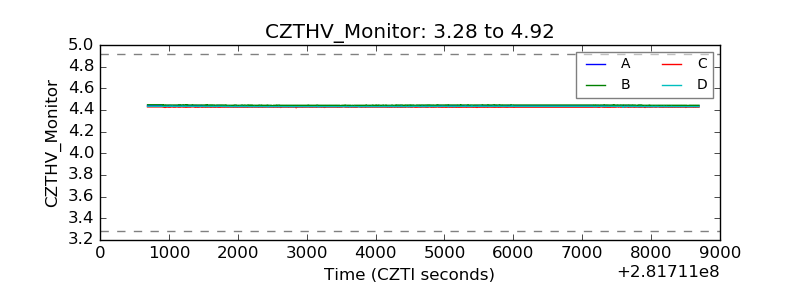 |
| D_VDD | 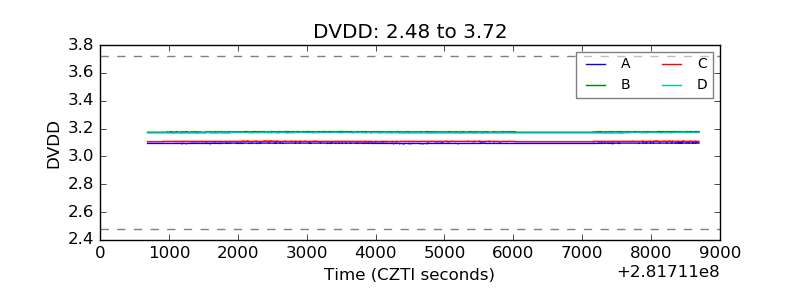 |
| Temperature 1 | 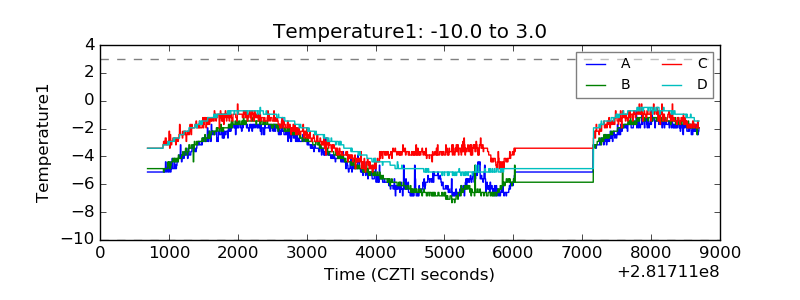 |
| Veto HV Monitor | 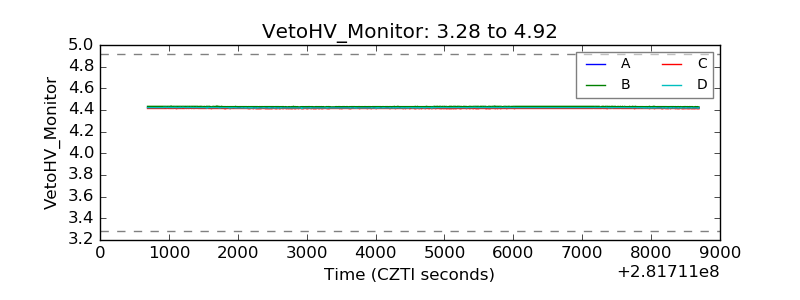 |
| Veto LLD | 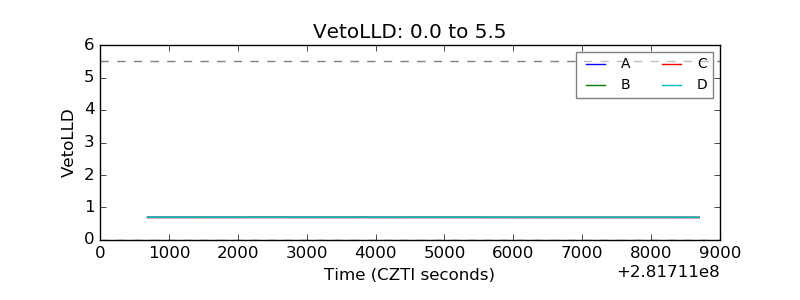 |
| Alpha Counter |  |
| _CPM_Rate | 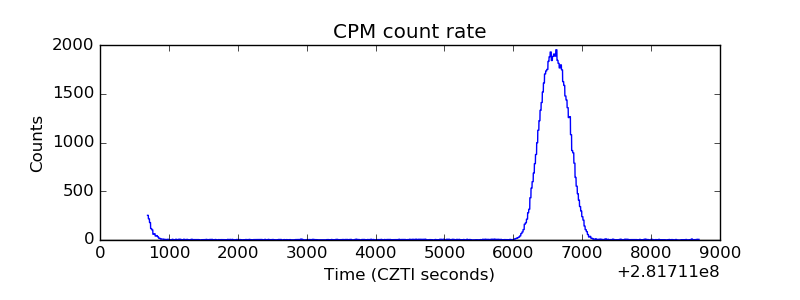 |
| CZT Counter | 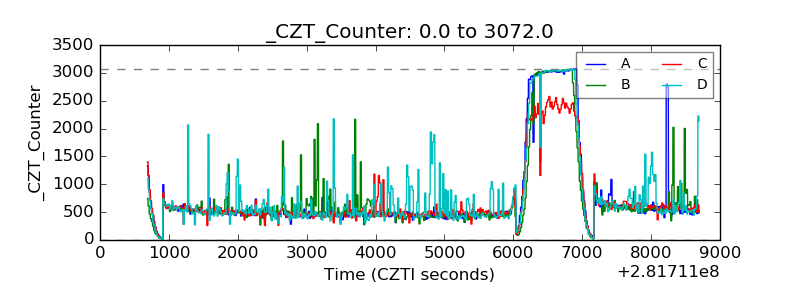 |
| +2.5 Volts monitor |  |
| +5 Volts monitor |  |
| _ROLL_ROT | 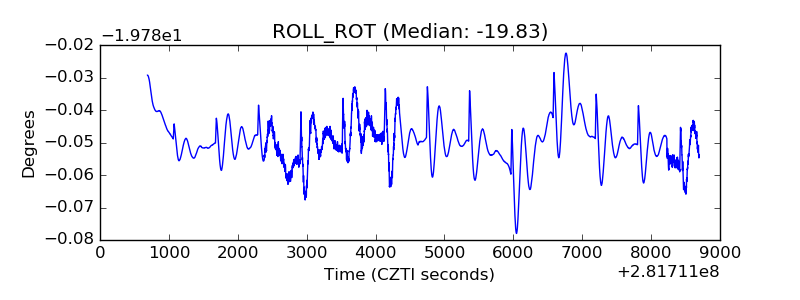 |
| _Roll_DEC | 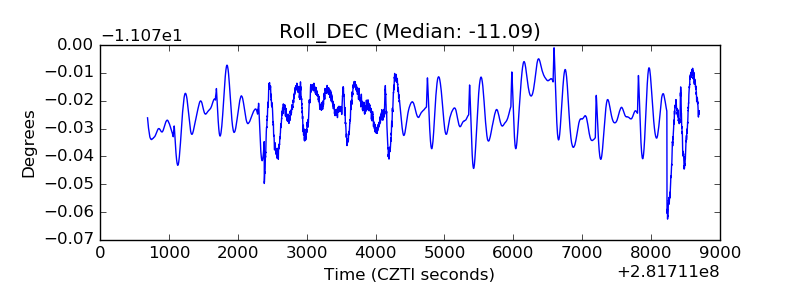 |
| _Roll_RA | 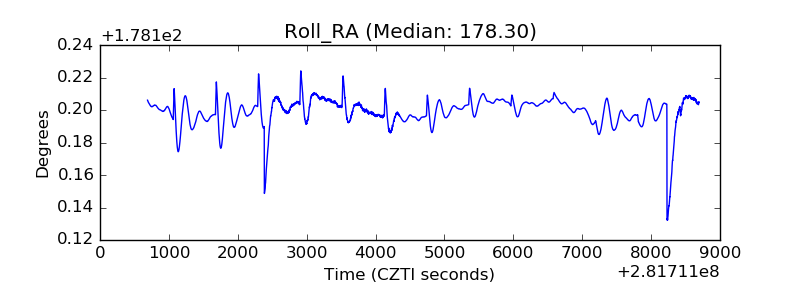 |
| Veto Counter | 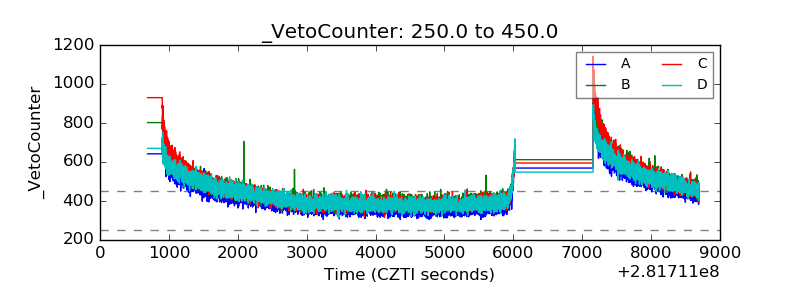 |