| Param | Original file | Final file |
|---|---|---|
| Filename | modeM0/AS1T03_063T01_9000002550_17237cztM0_level2.evt | modeM0/AS1T03_063T01_9000002550_17237cztM0_level2_quad_clean.evt |
| Size (bytes) | 508,282,560 | 63,581,760 |
| Size | 484.7 MB | 60.6 MB |
| Events in quadrant A | 3,502,199 | 375,101 |
| Events in quadrant B | 3,694,121 | 376,274 |
| Events in quadrant C | 3,643,387 | 359,521 |
| Events in quadrant D | 4,108,051 | 355,985 |
| Mode M9 | |||
|---|---|---|---|
| Quadrant | BADHDUFLAG | Total packets | Discarded packets |
| A | 0 | 12 | 0 |
| B | 0 | 12 | 0 |
| C | 0 | 12 | 0 |
| D | 0 | 12 | 0 |
| Mode SS | |||
|---|---|---|---|
| Quadrant | BADHDUFLAG | Total packets | Discarded packets |
| A | 0 | 134 | 0 |
| B | 0 | 134 | 0 |
| C | 0 | 134 | 0 |
| D | 0 | 134 | 0 |
| Mode M0 | |||
|---|---|---|---|
| Quadrant | BADHDUFLAG | Total packets | Discarded packets |
| A | 0 | 14618 | 2 |
| B | 0 | 15249 | 2 |
| C | 0 | 14999 | 3 |
| D | 0 | 16566 | 2 |
| Quadrant | Total seconds | Saturated seconds | Saturation percentage |
|---|---|---|---|
| A | 6566 | 93 | 1.416387% |
| B | 6566 | 102 | 1.553457% |
| C | 6566 | 104 | 1.583917% |
| D | 6566 | 199 | 3.030765% |
Noise dominated data is calculated using 1-second bins in cleaned event files. If a bin has >2000 counts, and if more than 50% of those come from <1% of pixels, then it is considered to be noise-dominated and hence unusable.
| Quadrant | # 1 sec bins | Bins with >0 counts | Bins with >2000 counts | High rate bins dominated by noise | Noise dominated (total time) | Noise dominated (detector-on time) | Marked lightcurve |
|---|---|---|---|---|---|---|---|
| A | 7782 | 6567 | 20 | 20 | 0.26% | 0.30% | 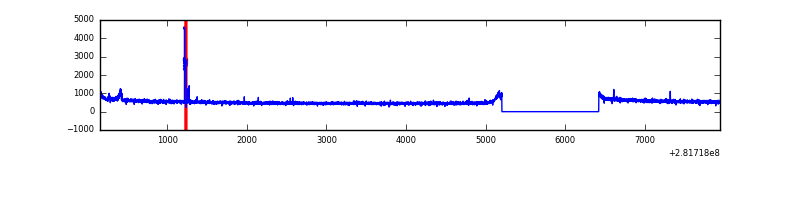 |
| B | 7782 | 6567 | 12 | 12 | 0.15% | 0.18% | 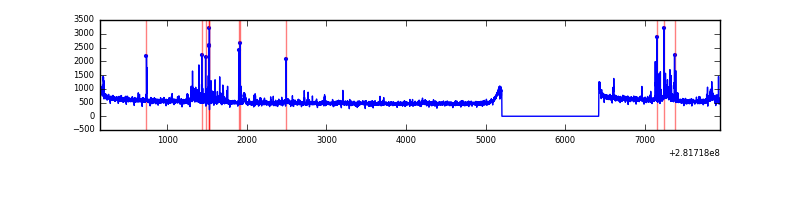 |
| C | 7782 | 6567 | 0 | 0 | 0.00% | 0.00% | 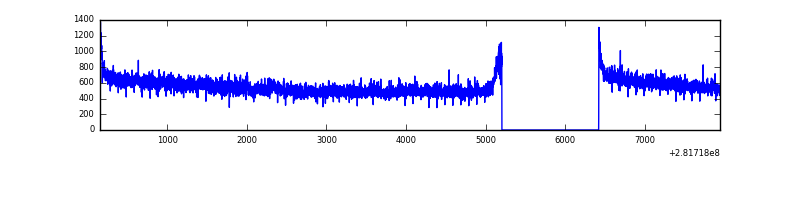 |
| D | 7782 | 6567 | 152 | 152 | 1.95% | 2.31% | 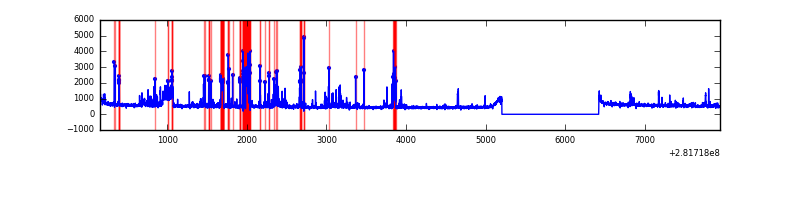 |
Top three noisy pixels from each quadrant. If the there are fewer than three noisy pixels in the level2.evt file, extra rows are filled as -1
| Pixel properties | Quadrant properties | ||||||
|---|---|---|---|---|---|---|---|
| Quadrant | DetID | PixID | Counts | Sigma | Mean | Median | Sigma |
| A | 15 | 174 | 87267 | 486.11 | 887 | 871 | 177.7 |
| A | 0 | 226 | 8044 | 40.36 | 887 | 871 | 177.7 |
| A | 12 | 194 | 6485 | 31.59 | 887 | 871 | 177.7 |
| B | 7 | 220 | 128565 | 770.08 | 882 | 861 | 165.8 |
| B | 15 | 35 | 44113 | 260.82 | 882 | 861 | 165.8 |
| B | 12 | 111 | 18639 | 107.21 | 882 | 861 | 165.8 |
| C | 3 | 233 | 179181 | 908.8 | 848 | 856 | 196.2 |
| C | 14 | 238 | 131025 | 663.38 | 848 | 856 | 196.2 |
| C | 7 | 220 | 25586 | 126.03 | 848 | 856 | 196.2 |
| D | 1 | 52 | 296699 | 1434.99 | 855 | 831 | 206.2 |
| D | 15 | 0 | 203339 | 982.19 | 855 | 831 | 206.2 |
| D | 5 | 222 | 146229 | 705.2 | 855 | 831 | 206.2 |
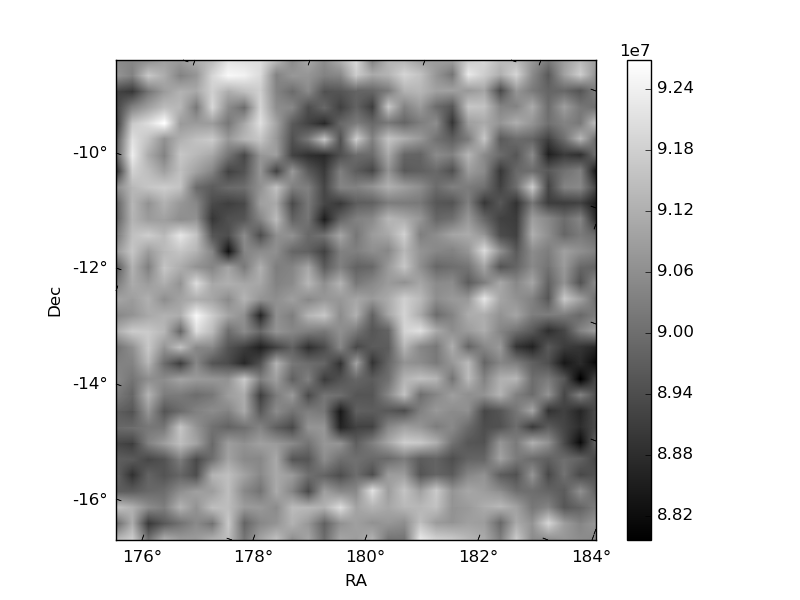
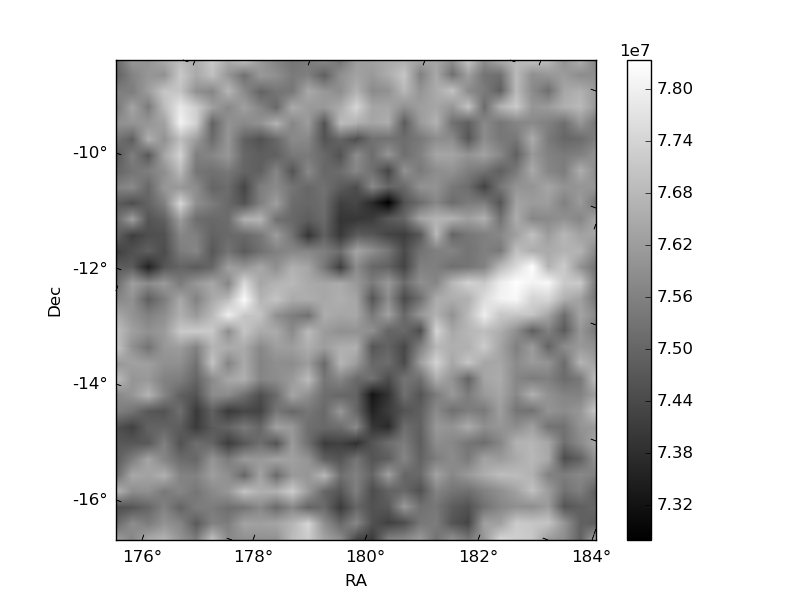
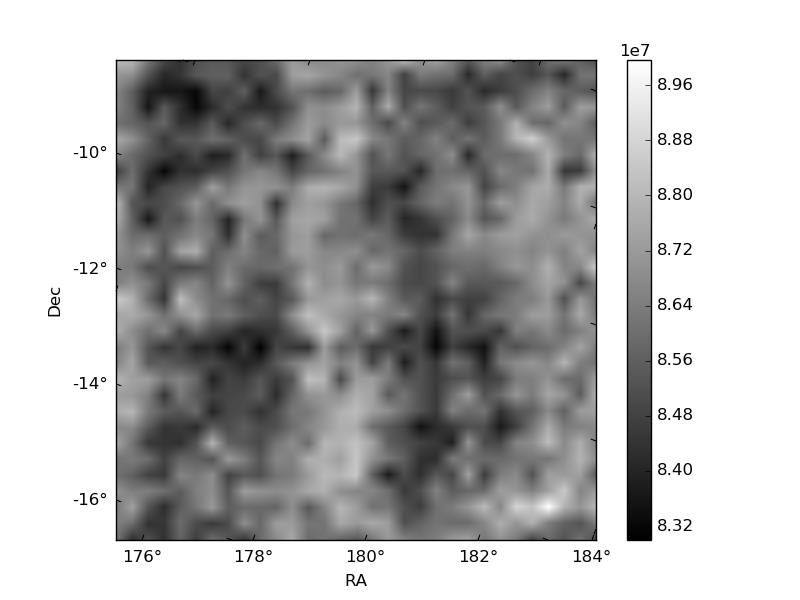
Histogram calculated using DETX and DETY for each event in the final _common_clean file
| Quadrant A |  |
 |
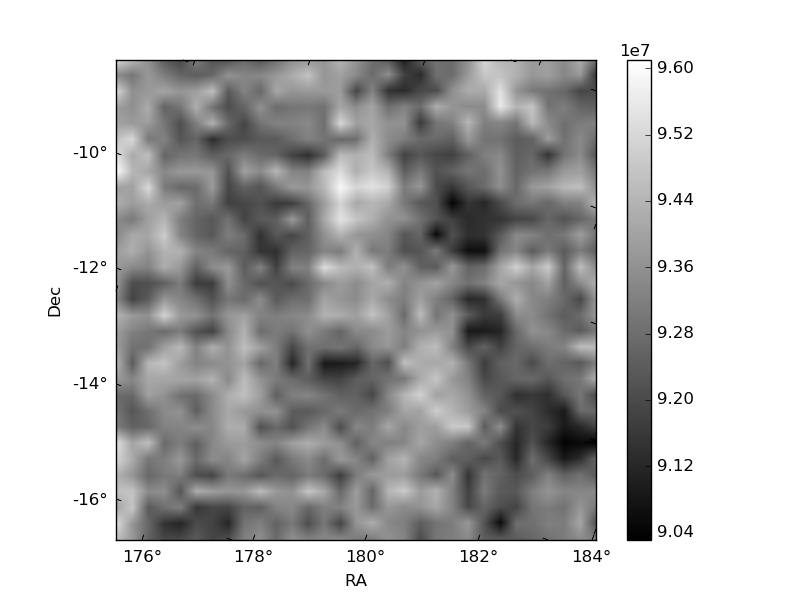
Quadrant B |
|---|---|---|---|
| Quadrant D |  |
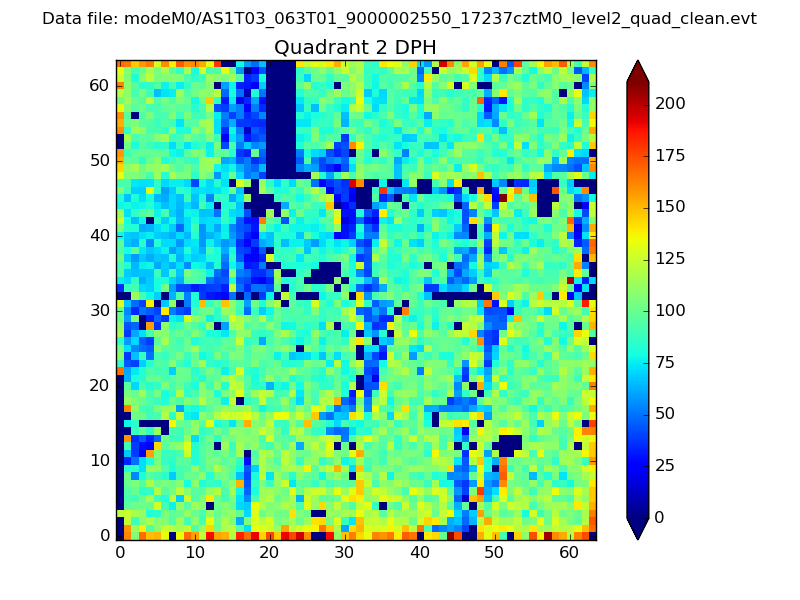 |
Quadrant C |
| Plot type | Count rate plots | Images |
|---|---|---|
| Comparison with Poisson distribution Blue bars denote a histogram of data divided into 1 sec bins. Red curve is a Poisson curve with rate = median count rate of data. |
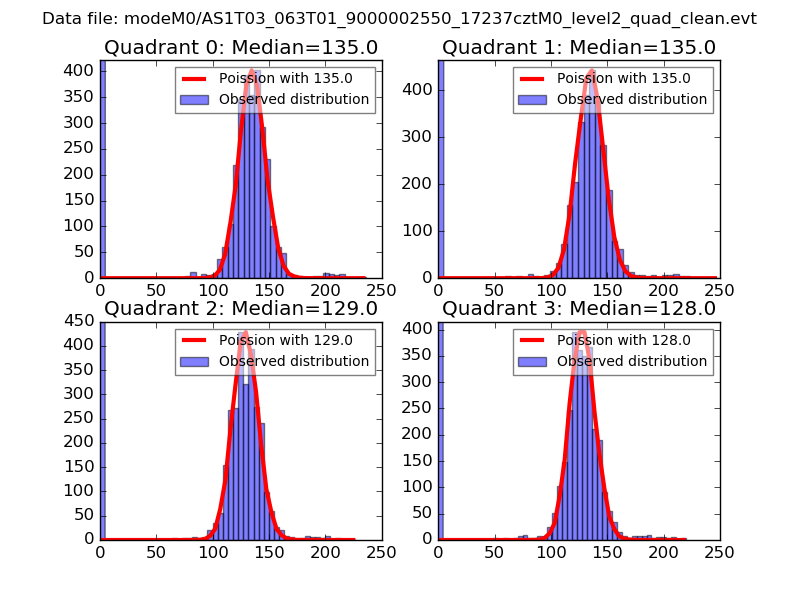 |
 |
| Quadrant-wise count rates Data is divided into 100 sec bins |
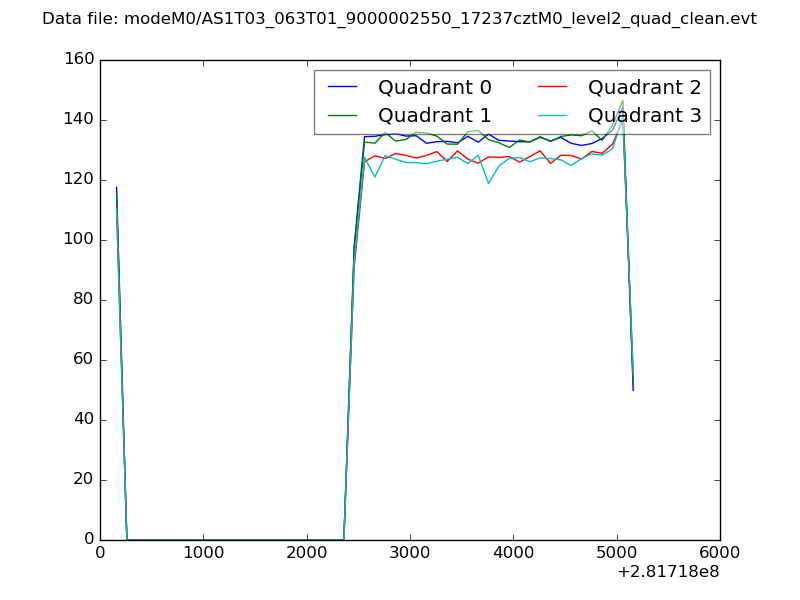 |
|
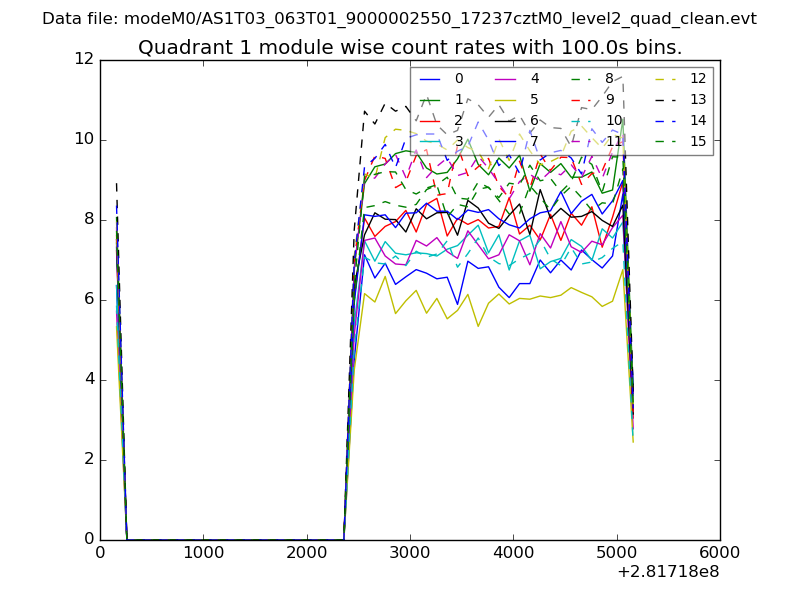
| Module-wise count rates for Quadrant A Data is divided into 100 sec bins |
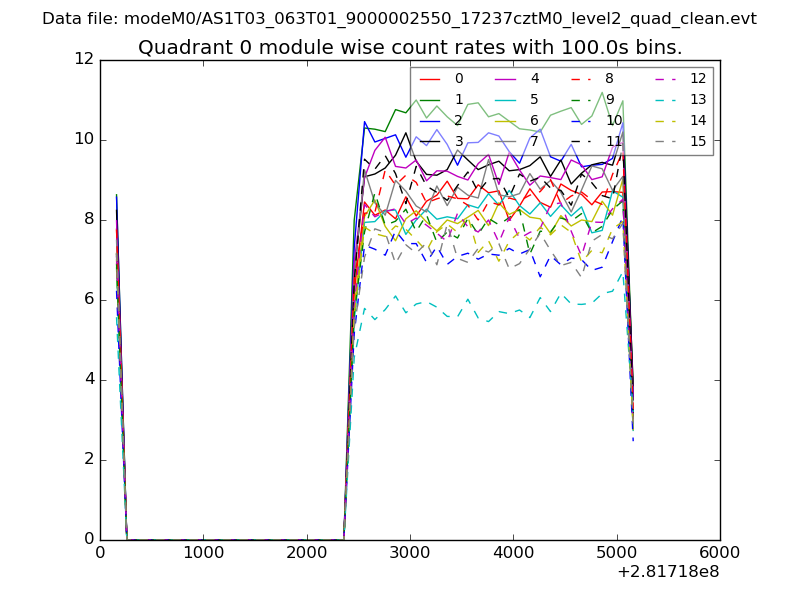 |
 |
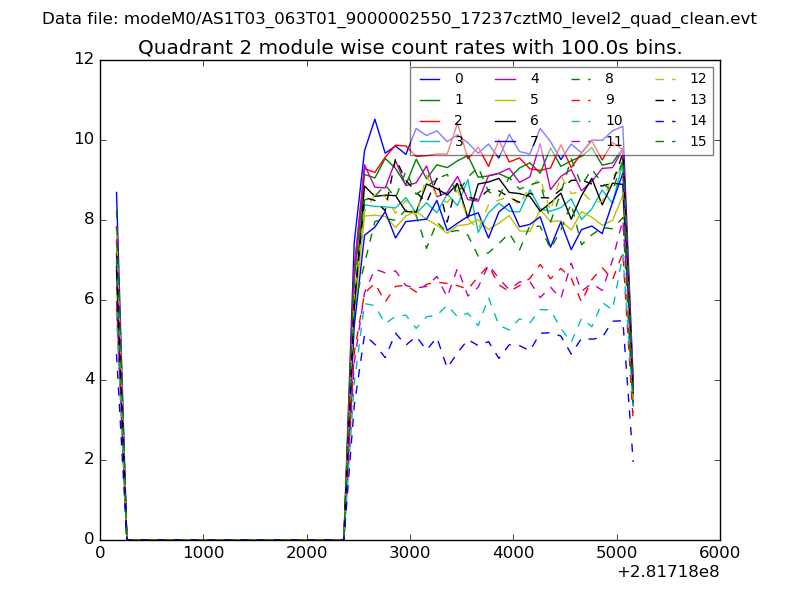
| Module-wise count rates for Quadrant B Data is divided into 100 sec bins |
 |
 |
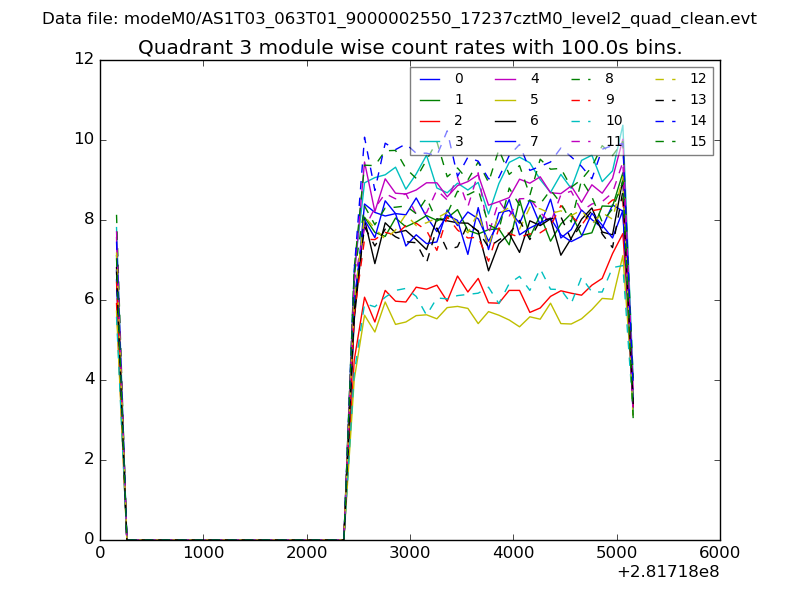
| Module-wise count rates for Quadrant C Data is divided into 100 sec bins |
 |
 |
| Module-wise count rates for Quadrant D Data is divided into 100 sec bins |
 |
 |
| Parameter | Plot |
|---|---|
| CZT HV Monitor |  |
| D_VDD | 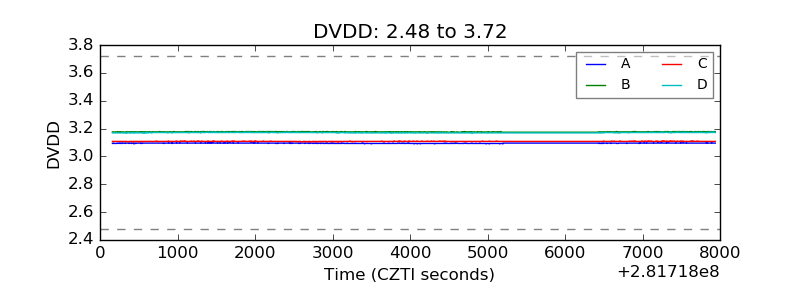 |
| Temperature 1 | 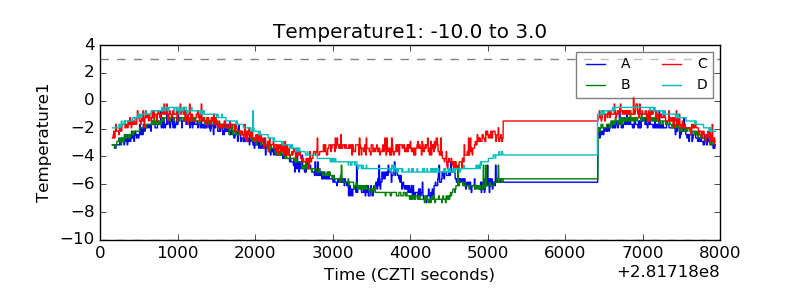 |
| Veto HV Monitor | 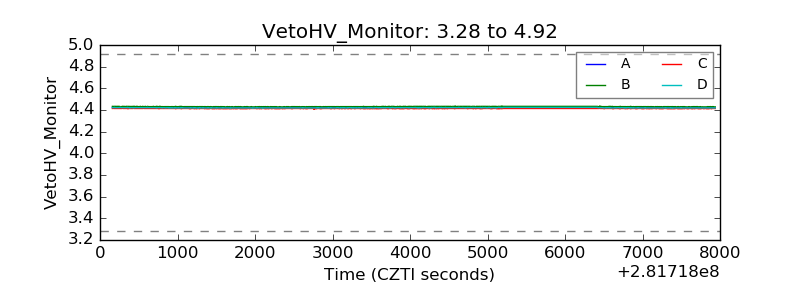 |
| Veto LLD | 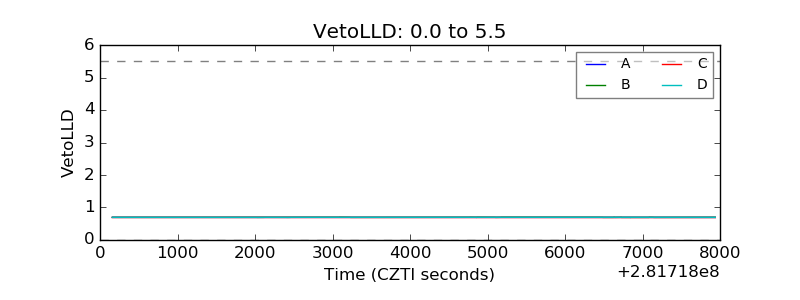 |
| Alpha Counter | 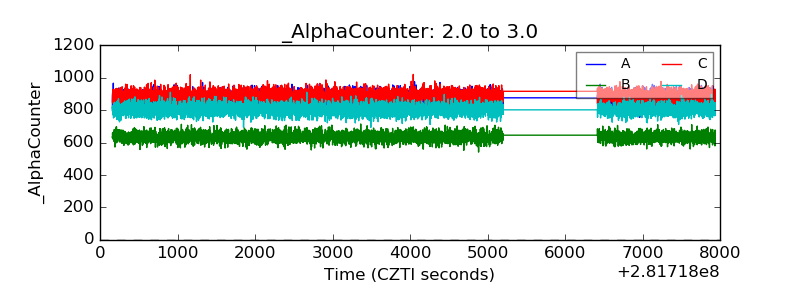 |
| _CPM_Rate | 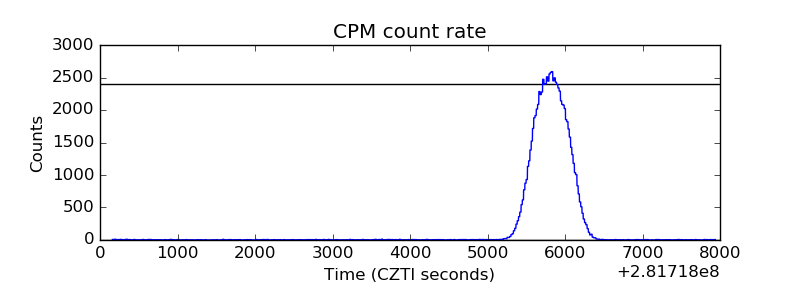 |
| CZT Counter |  |
| +2.5 Volts monitor |  |
| +5 Volts monitor | 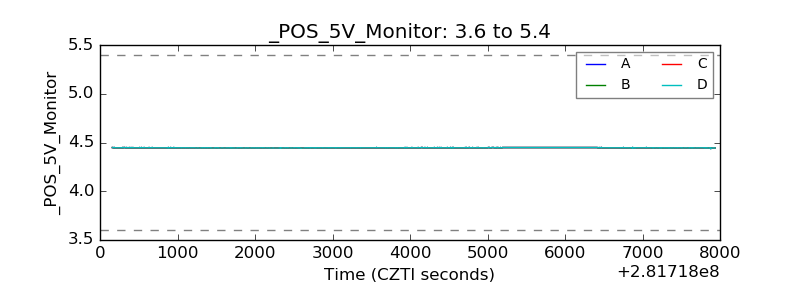 |
| _ROLL_ROT | 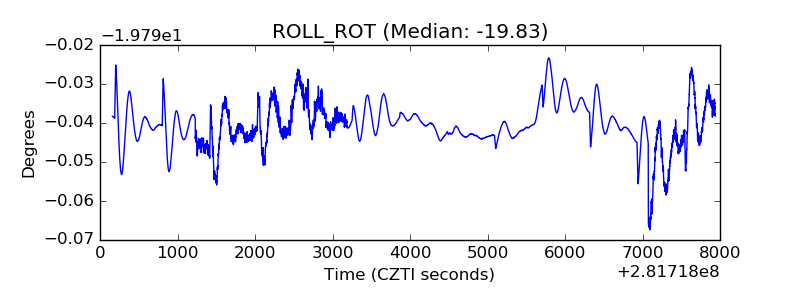 |
| _Roll_DEC | 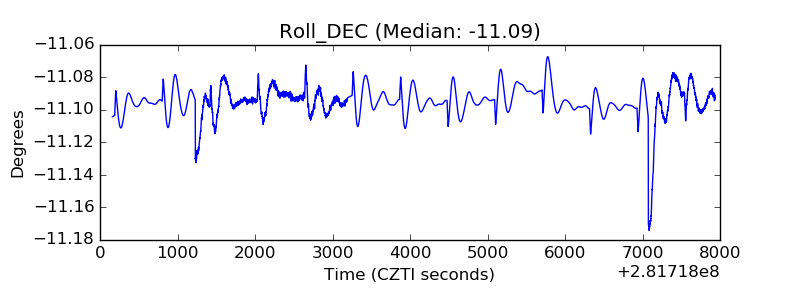 |
| _Roll_RA |  |
| Veto Counter | 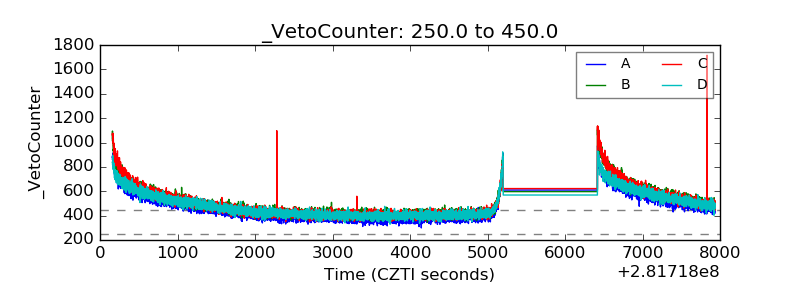 |