| Param | Original file | Final file |
|---|---|---|
| Filename | modeM0/AS1T03_063T01_9000002550_17238cztM0_level2.evt | modeM0/AS1T03_063T01_9000002550_17238cztM0_level2_quad_clean.evt |
| Size (bytes) | 498,484,800 | 69,301,440 |
| Size | 475.4 MB | 66.1 MB |
| Events in quadrant A | 3,458,248 | 419,643 |
| Events in quadrant B | 3,677,228 | 424,815 |
| Events in quadrant C | 3,714,869 | 406,156 |
| Events in quadrant D | 3,811,705 | 400,603 |
| Mode M9 | |||
|---|---|---|---|
| Quadrant | BADHDUFLAG | Total packets | Discarded packets |
| A | 0 | 21 | 0 |
| B | 0 | 22 | 0 |
| C | 0 | 22 | 0 |
| D | 0 | 22 | 0 |
| Mode SS | |||
|---|---|---|---|
| Quadrant | BADHDUFLAG | Total packets | Discarded packets |
| A | 0 | 130 | 0 |
| B | 0 | 130 | 0 |
| C | 0 | 130 | 0 |
| D | 0 | 130 | 0 |
| Mode M0 | |||
|---|---|---|---|
| Quadrant | BADHDUFLAG | Total packets | Discarded packets |
| A | 0 | 14422 | 2 |
| B | 0 | 15198 | 2 |
| C | 0 | 15155 | 2 |
| D | 0 | 15607 | 2 |
| Quadrant | Total seconds | Saturated seconds | Saturation percentage |
|---|---|---|---|
| A | 6408 | 84 | 1.310861% |
| B | 6408 | 108 | 1.685393% |
| C | 6408 | 122 | 1.903870% |
| D | 6408 | 75 | 1.170412% |
Noise dominated data is calculated using 1-second bins in cleaned event files. If a bin has >2000 counts, and if more than 50% of those come from <1% of pixels, then it is considered to be noise-dominated and hence unusable.
| Quadrant | # 1 sec bins | Bins with >0 counts | Bins with >2000 counts | High rate bins dominated by noise | Noise dominated (total time) | Noise dominated (detector-on time) | Marked lightcurve |
|---|---|---|---|---|---|---|---|
| A | 7708 | 6409 | 8 | 8 | 0.10% | 0.12% | 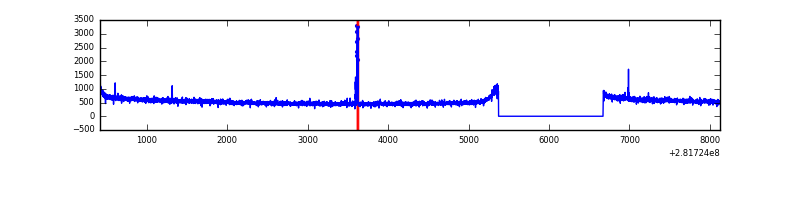 |
| B | 7708 | 6409 | 5 | 5 | 0.06% | 0.08% | 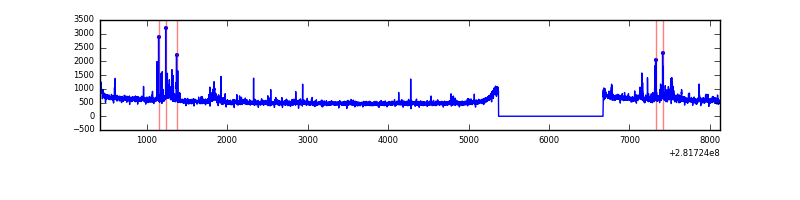 |
| C | 7708 | 6409 | 5 | 5 | 0.06% | 0.08% | 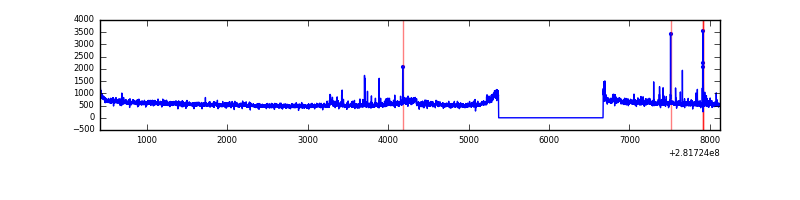 |
| D | 7708 | 6409 | 22 | 22 | 0.29% | 0.34% | 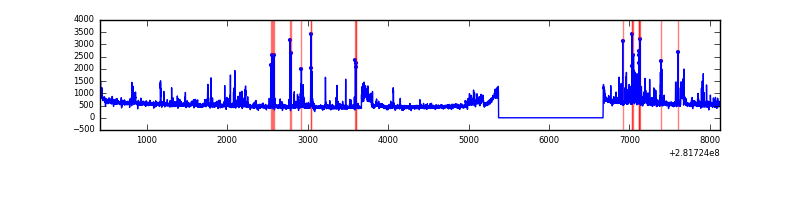 |
Top three noisy pixels from each quadrant. If the there are fewer than three noisy pixels in the level2.evt file, extra rows are filled as -1
| Pixel properties | Quadrant properties | ||||||
|---|---|---|---|---|---|---|---|
| Quadrant | DetID | PixID | Counts | Sigma | Mean | Median | Sigma |
| A | 15 | 174 | 51905 | 287.7 | 885 | 869 | 177.4 |
| A | 0 | 226 | 7979 | 40.08 | 885 | 869 | 177.4 |
| A | 12 | 194 | 6412 | 31.25 | 885 | 869 | 177.4 |
| B | 3 | 209 | 60797 | 361.01 | 883 | 864 | 166.0 |
| B | 7 | 220 | 60175 | 357.26 | 883 | 864 | 166.0 |
| B | 15 | 35 | 57646 | 342.03 | 883 | 864 | 166.0 |
| C | 3 | 233 | 159756 | 817.74 | 843 | 849 | 194.3 |
| C | 14 | 238 | 131714 | 673.43 | 843 | 849 | 194.3 |
| C | 7 | 220 | 124381 | 635.7 | 843 | 849 | 194.3 |
| D | 1 | 52 | 165420 | 793.33 | 857 | 835 | 207.5 |
| D | 12 | 233 | 102400 | 489.56 | 857 | 835 | 207.5 |
| D | 13 | 189 | 86918 | 414.94 | 857 | 835 | 207.5 |
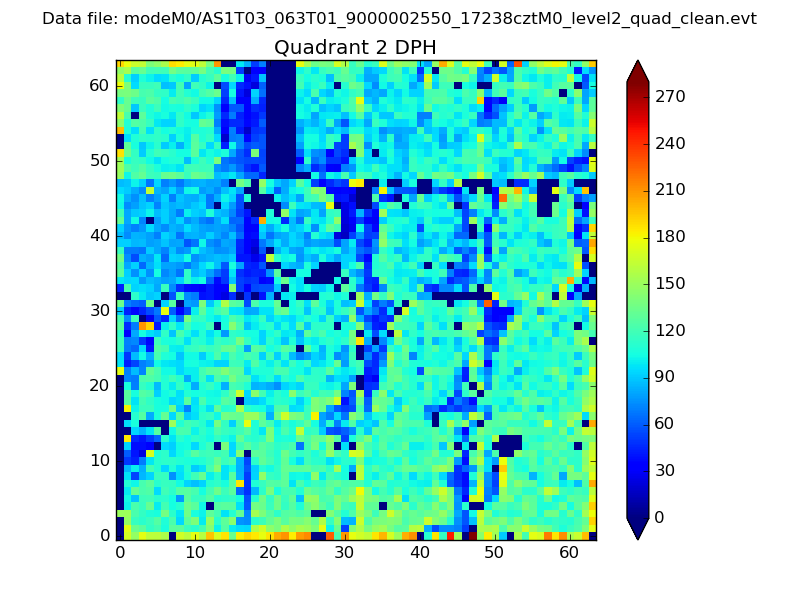
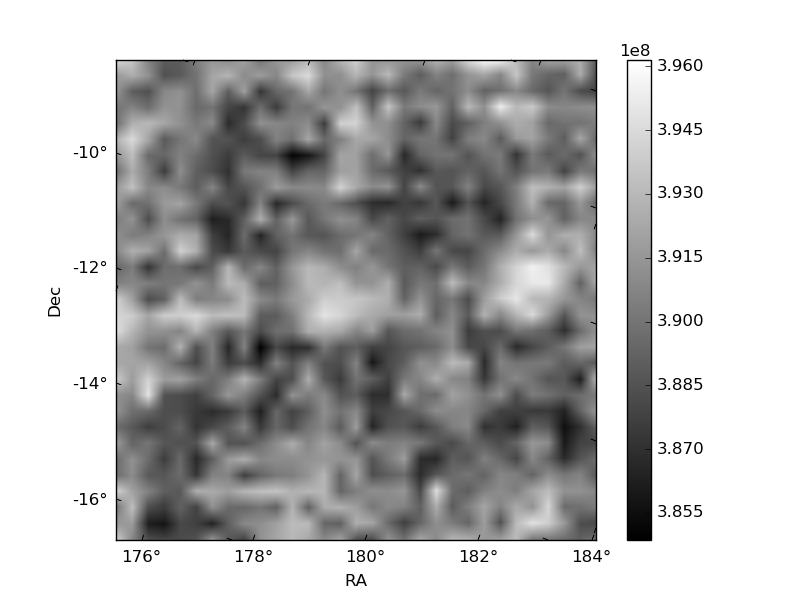
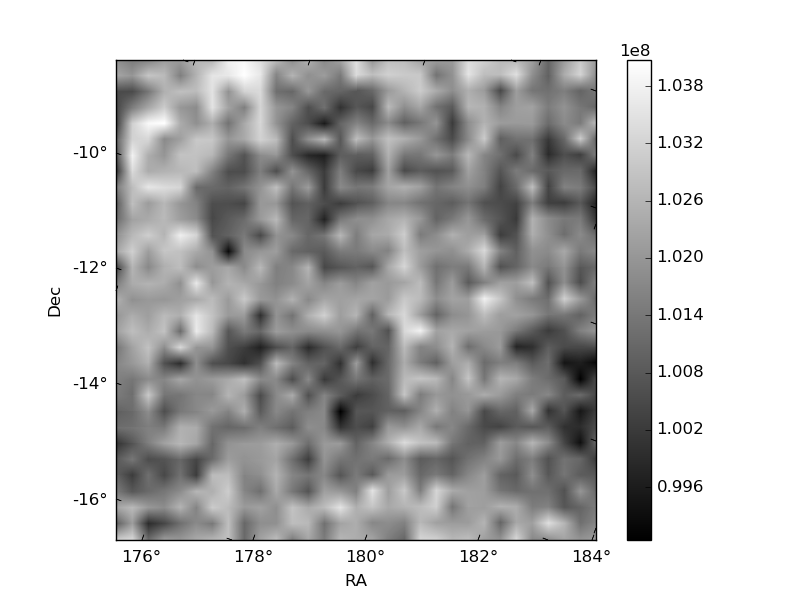
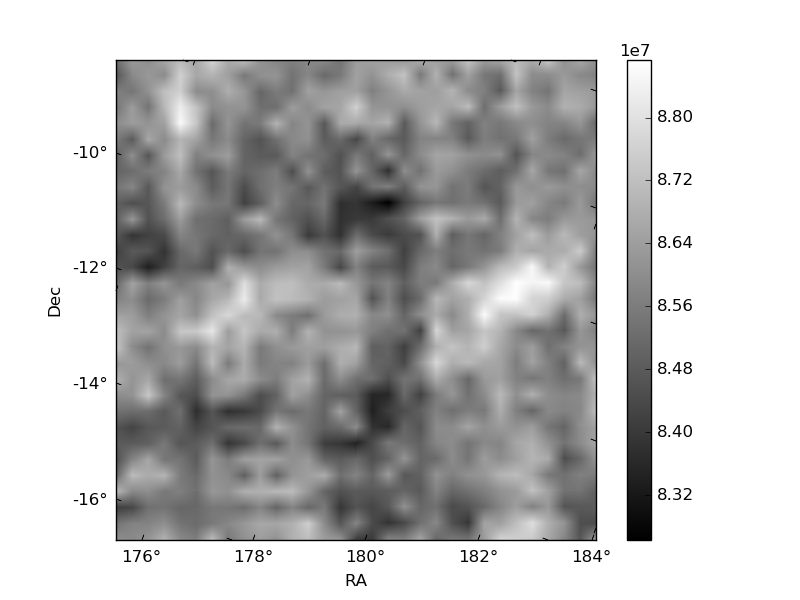
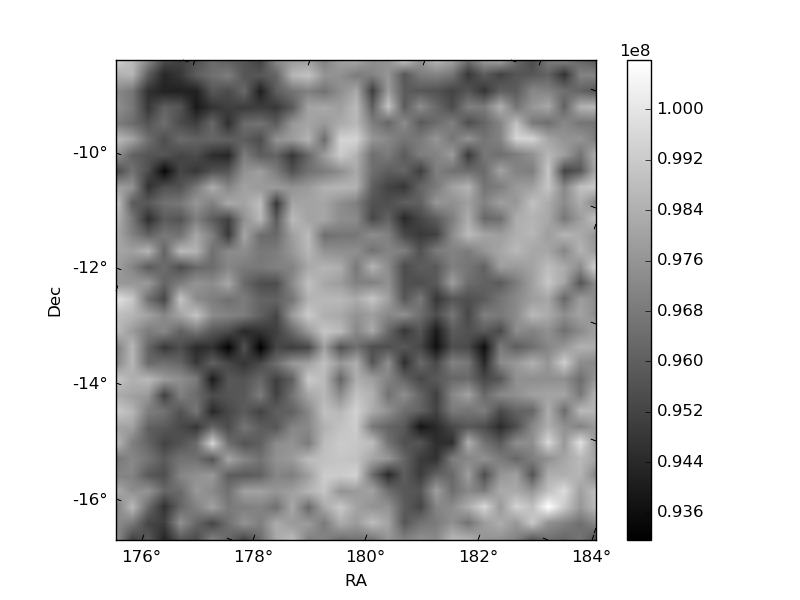
Histogram calculated using DETX and DETY for each event in the final _common_clean file
| Quadrant A | 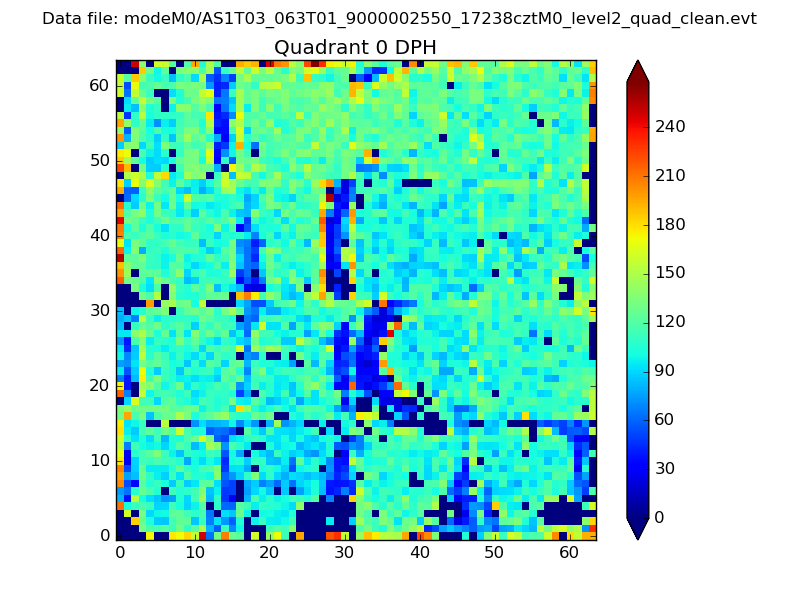 |
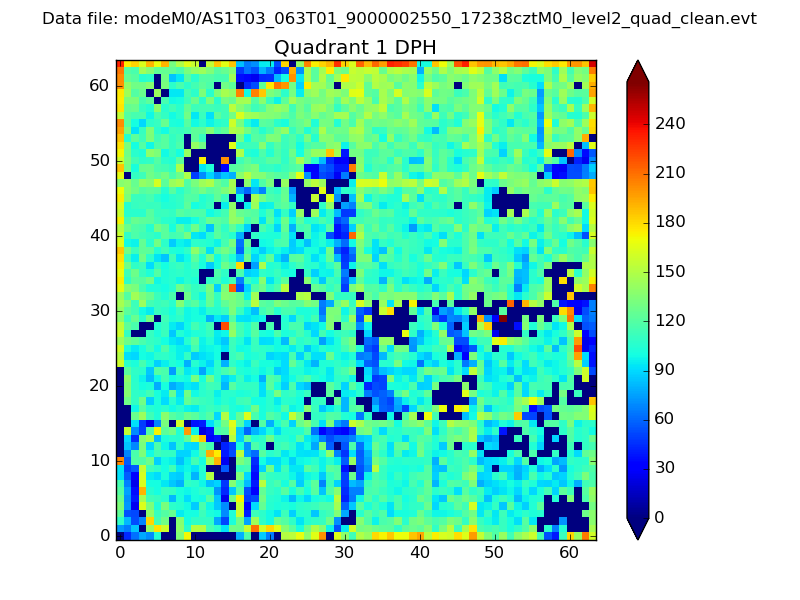 |
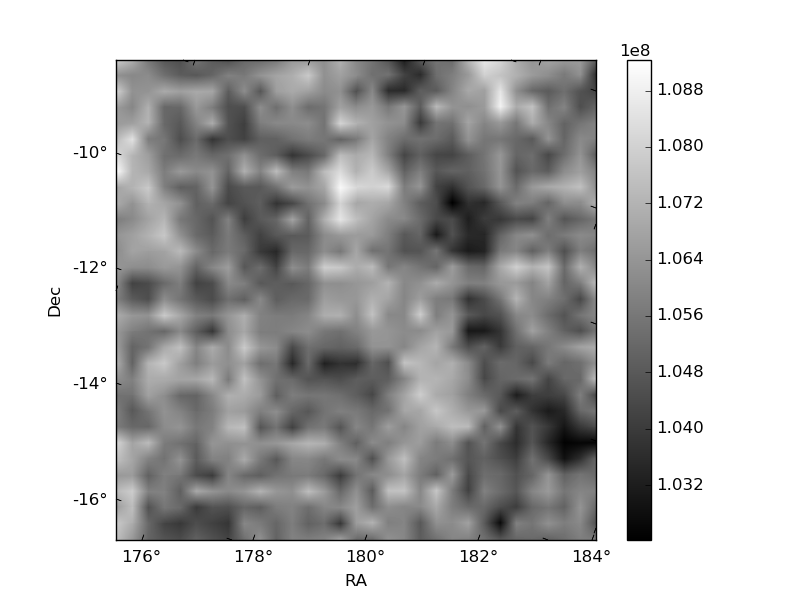
Quadrant B |
|---|---|---|---|
| Quadrant D | 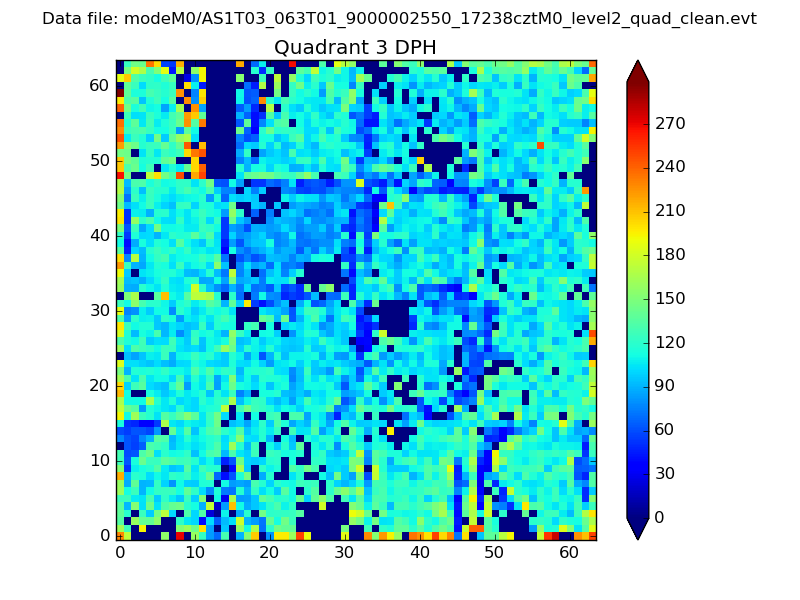 |
 |
Quadrant C |
| Plot type | Count rate plots | Images |
|---|---|---|
| Comparison with Poisson distribution Blue bars denote a histogram of data divided into 1 sec bins. Red curve is a Poisson curve with rate = median count rate of data. |
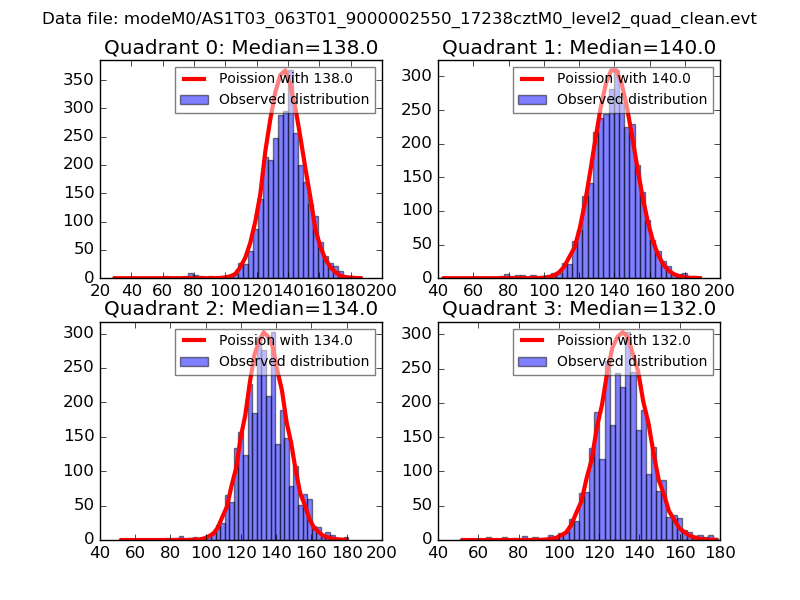 |
 |
| Quadrant-wise count rates Data is divided into 100 sec bins |
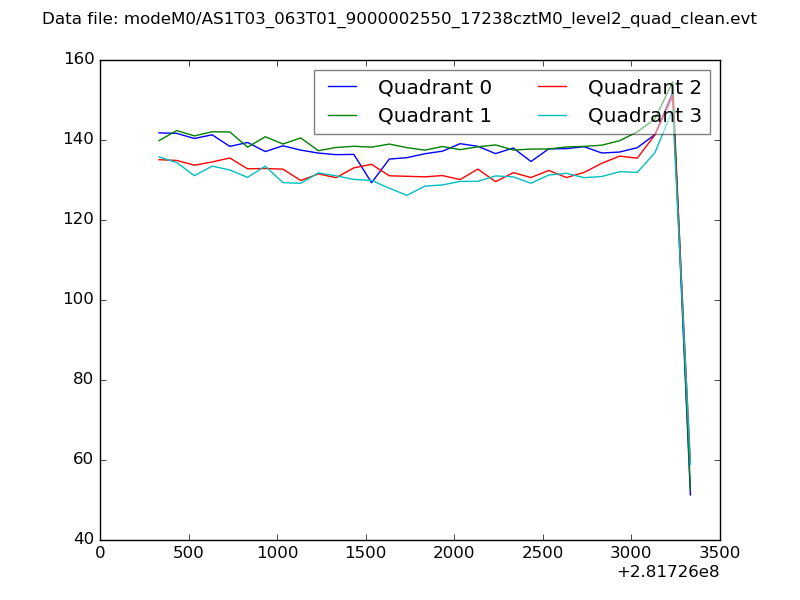 |
|
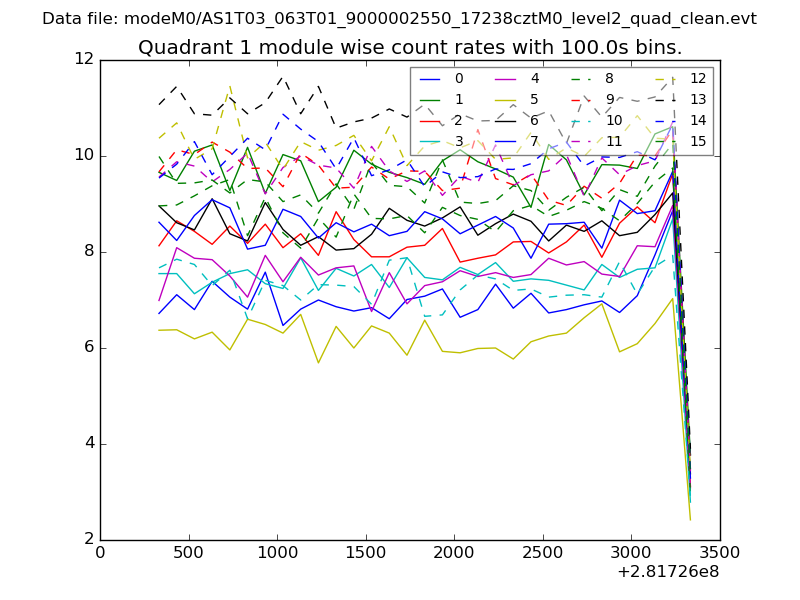
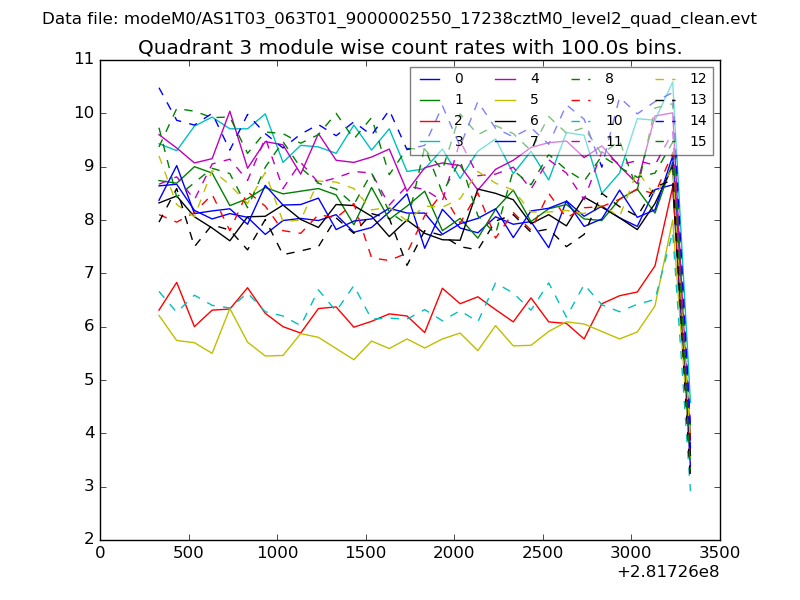
| Module-wise count rates for Quadrant A Data is divided into 100 sec bins |
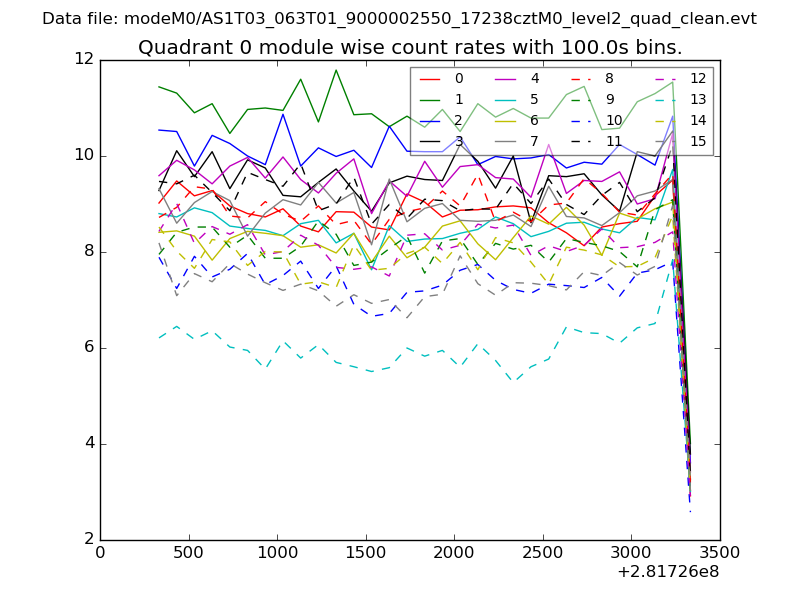 |
 |
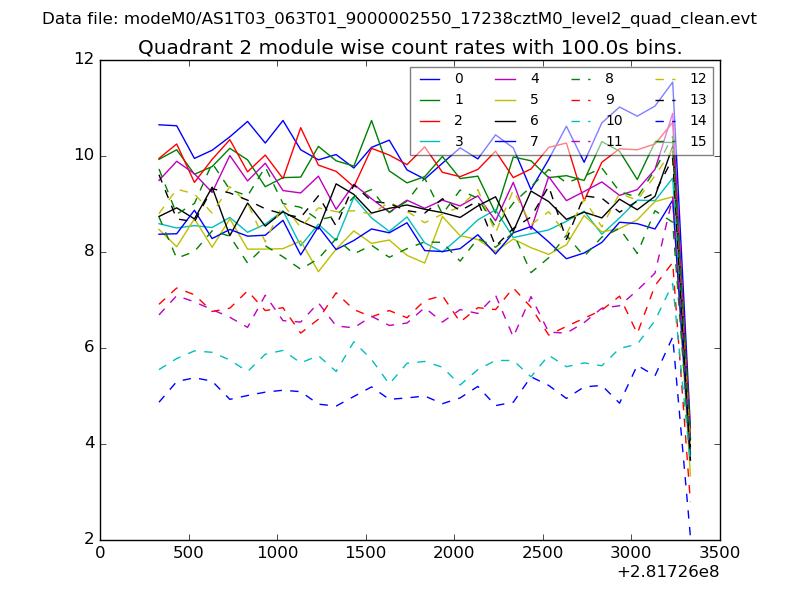
| Module-wise count rates for Quadrant B Data is divided into 100 sec bins |
 |
 |
| Module-wise count rates for Quadrant C Data is divided into 100 sec bins |
 |
 |
| Module-wise count rates for Quadrant D Data is divided into 100 sec bins |
 |
 |
| Parameter | Plot |
|---|---|
| CZT HV Monitor | 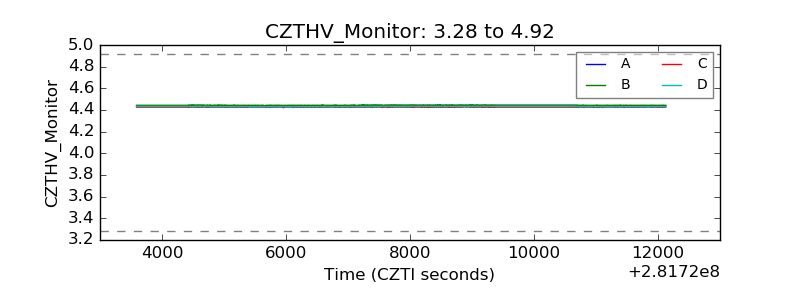 |
| D_VDD | 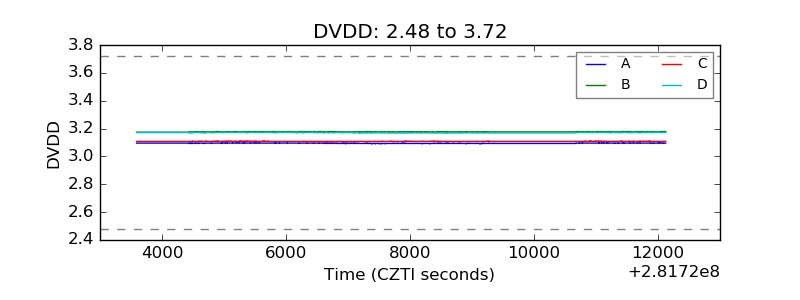 |
| Temperature 1 | 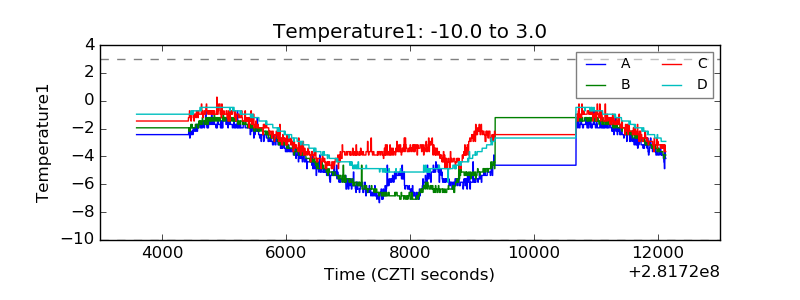 |
| Veto HV Monitor | 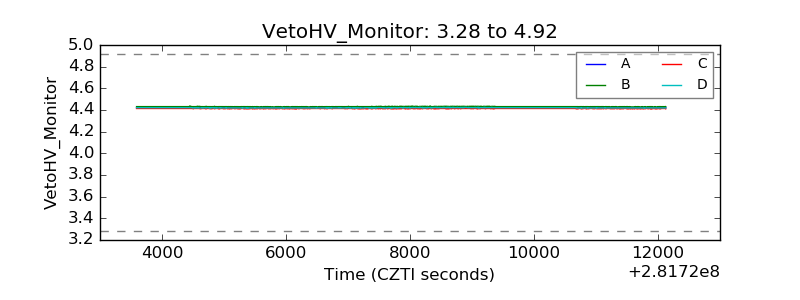 |
| Veto LLD | 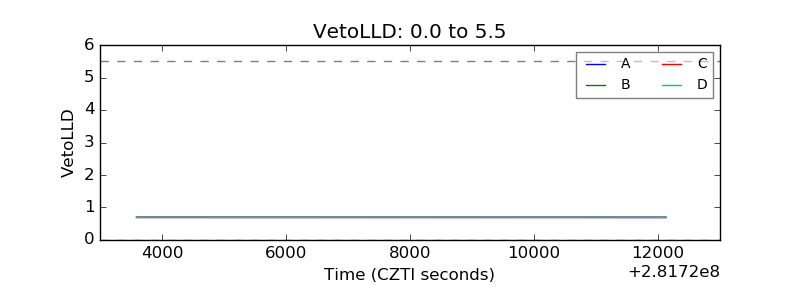 |
| Alpha Counter | 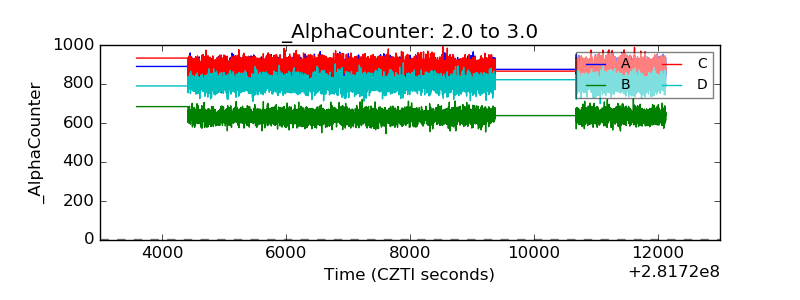 |
| _CPM_Rate | 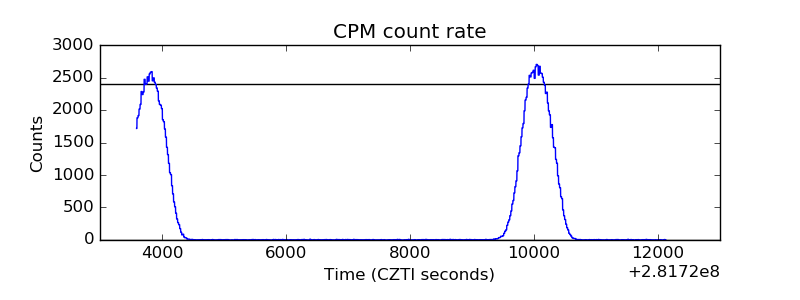 |
| CZT Counter | 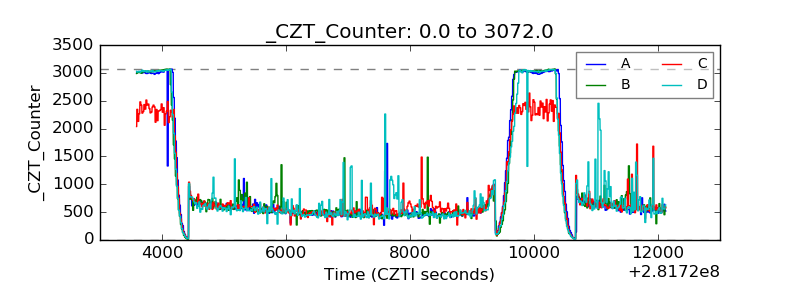 |
| +2.5 Volts monitor |  |
| +5 Volts monitor |  |
| _ROLL_ROT | 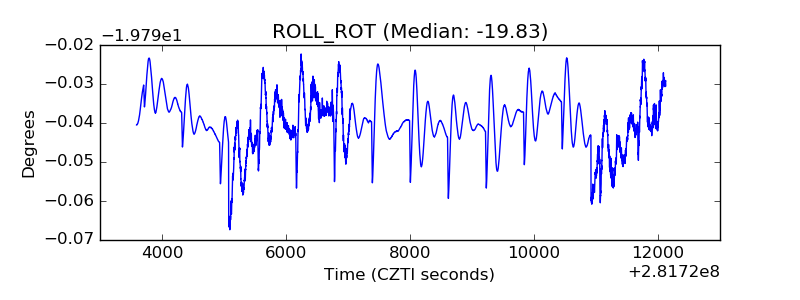 |
| _Roll_DEC | 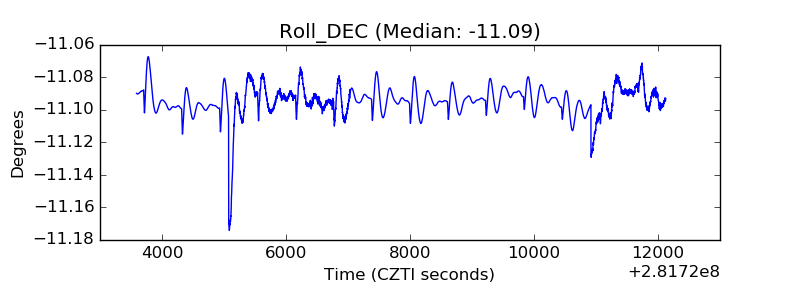 |
| _Roll_RA | 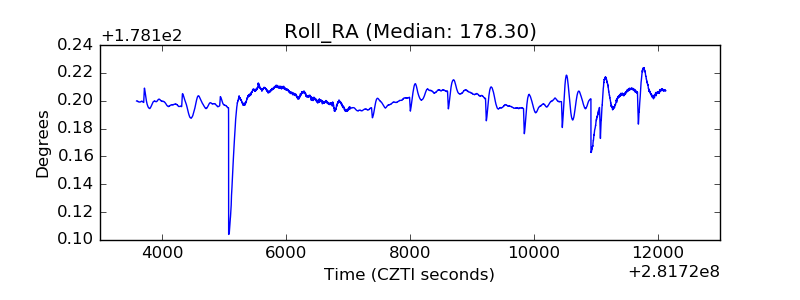 |
| Veto Counter | 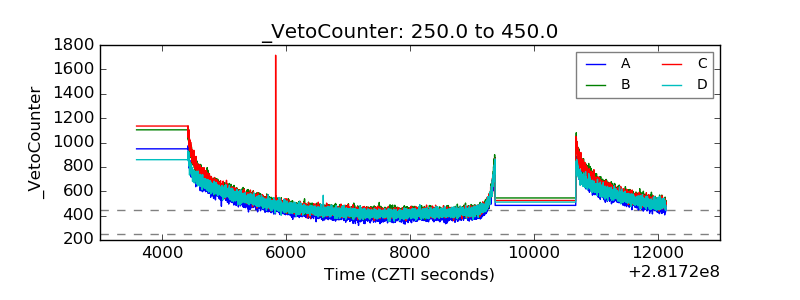 |