| Param | Original file | Final file |
|---|---|---|
| Filename | modeM0/AS1T03_063T01_9000002550_17239cztM0_level2.evt | modeM0/AS1T03_063T01_9000002550_17239cztM0_level2_quad_clean.evt |
| Size (bytes) | 480,248,640 | 80,922,240 |
| Size | 458.0 MB | 77.2 MB |
| Events in quadrant A | 3,483,702 | 507,313 |
| Events in quadrant B | 3,578,181 | 522,168 |
| Events in quadrant C | 3,483,497 | 494,816 |
| Events in quadrant D | 3,574,079 | 489,229 |
| Mode M9 | |||
|---|---|---|---|
| Quadrant | BADHDUFLAG | Total packets | Discarded packets |
| A | 0 | 13 | 0 |
| B | 0 | 14 | 0 |
| C | 0 | 14 | 0 |
| D | 0 | 14 | 0 |
| Mode SS | |||
|---|---|---|---|
| Quadrant | BADHDUFLAG | Total packets | Discarded packets |
| A | 0 | 128 | 0 |
| B | 0 | 128 | 0 |
| C | 0 | 128 | 0 |
| D | 0 | 128 | 0 |
| Mode M0 | |||
|---|---|---|---|
| Quadrant | BADHDUFLAG | Total packets | Discarded packets |
| A | 0 | 14323 | 2 |
| B | 0 | 14767 | 2 |
| C | 0 | 14257 | 2 |
| D | 0 | 14737 | 2 |
| Quadrant | Total seconds | Saturated seconds | Saturation percentage |
|---|---|---|---|
| A | 6256 | 168 | 2.685422% |
| B | 6256 | 115 | 1.838235% |
| C | 6256 | 148 | 2.365729% |
| D | 6255 | 80 | 1.278977% |
Noise dominated data is calculated using 1-second bins in cleaned event files. If a bin has >2000 counts, and if more than 50% of those come from <1% of pixels, then it is considered to be noise-dominated and hence unusable.
| Quadrant | # 1 sec bins | Bins with >0 counts | Bins with >2000 counts | High rate bins dominated by noise | Noise dominated (total time) | Noise dominated (detector-on time) | Marked lightcurve |
|---|---|---|---|---|---|---|---|
| A | 7581 | 6257 | 66 | 66 | 0.87% | 1.05% | 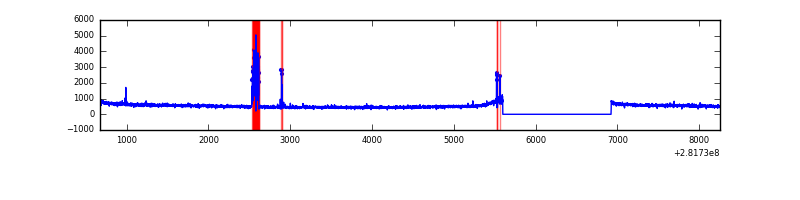 |
| B | 7581 | 6257 | 9 | 9 | 0.12% | 0.14% | 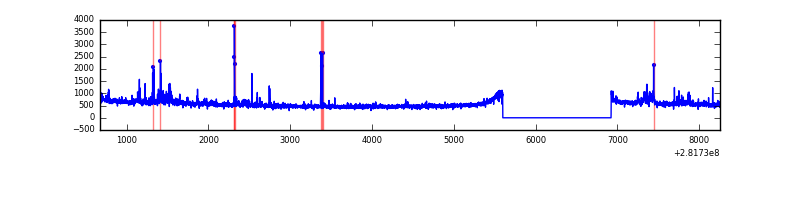 |
| C | 7581 | 6257 | 14 | 14 | 0.18% | 0.22% | 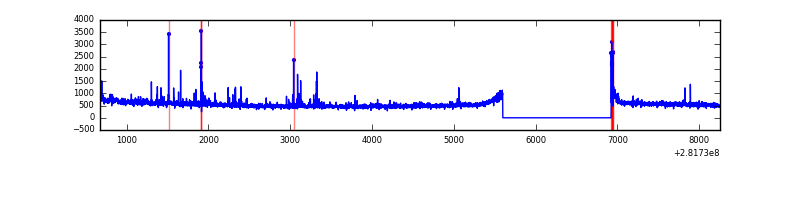 |
| D | 7580 | 6256 | 19 | 19 | 0.25% | 0.30% | 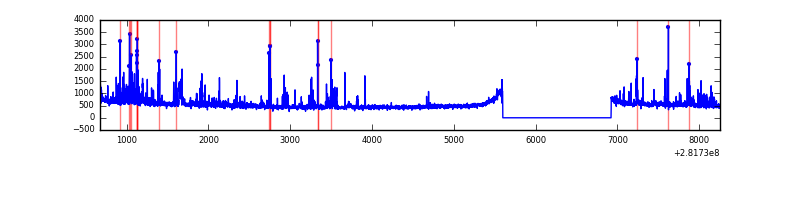 |
Top three noisy pixels from each quadrant. If the there are fewer than three noisy pixels in the level2.evt file, extra rows are filled as -1
| Pixel properties | Quadrant properties | ||||||
|---|---|---|---|---|---|---|---|
| Quadrant | DetID | PixID | Counts | Sigma | Mean | Median | Sigma |
| A | 15 | 174 | 209700 | 1230.37 | 851 | 836 | 169.8 |
| A | 0 | 226 | 7710 | 40.49 | 851 | 836 | 169.8 |
| A | 12 | 194 | 6169 | 31.42 | 851 | 836 | 169.8 |
| B | 3 | 209 | 81643 | 504.38 | 856 | 838 | 160.2 |
| B | 15 | 35 | 59044 | 363.32 | 856 | 838 | 160.2 |
| B | 7 | 220 | 39714 | 242.66 | 856 | 838 | 160.2 |
| C | 7 | 220 | 155791 | 828.72 | 810 | 818 | 187.0 |
| C | 14 | 238 | 125342 | 665.89 | 810 | 818 | 187.0 |
| C | 3 | 233 | 24092 | 124.46 | 810 | 818 | 187.0 |
| D | 12 | 233 | 121140 | 607.0 | 822 | 801 | 198.3 |
| D | 1 | 52 | 90456 | 452.23 | 822 | 801 | 198.3 |
| D | 10 | 70 | 88149 | 440.59 | 822 | 801 | 198.3 |
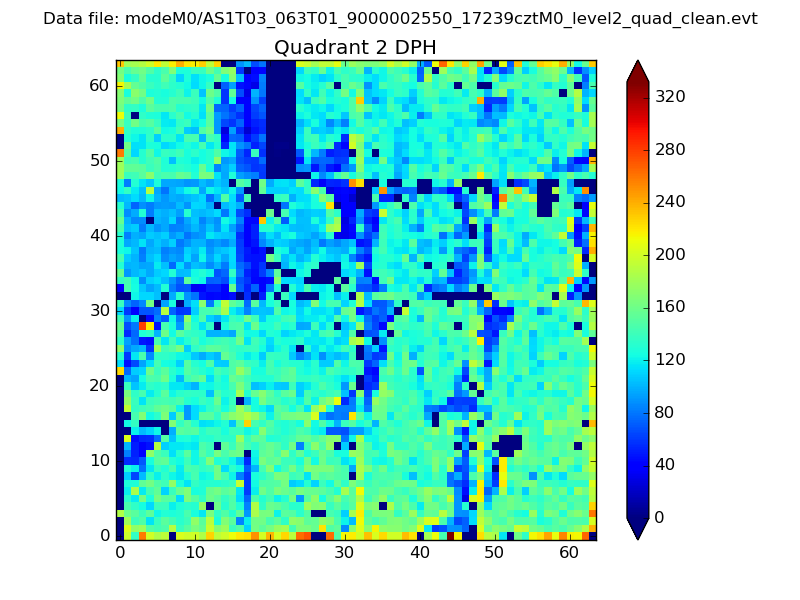
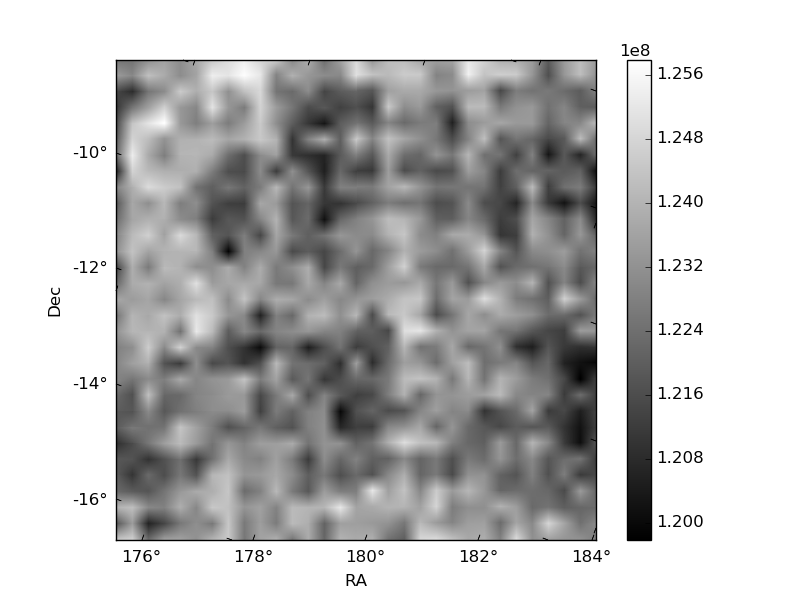
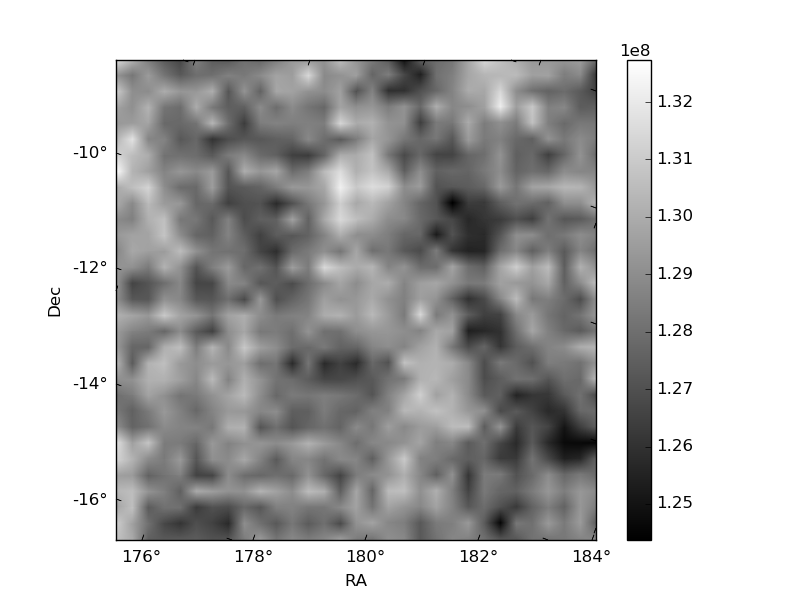
Histogram calculated using DETX and DETY for each event in the final _common_clean file
| Quadrant A |  |
 |
Quadrant B |
|---|---|---|---|
| Quadrant D | 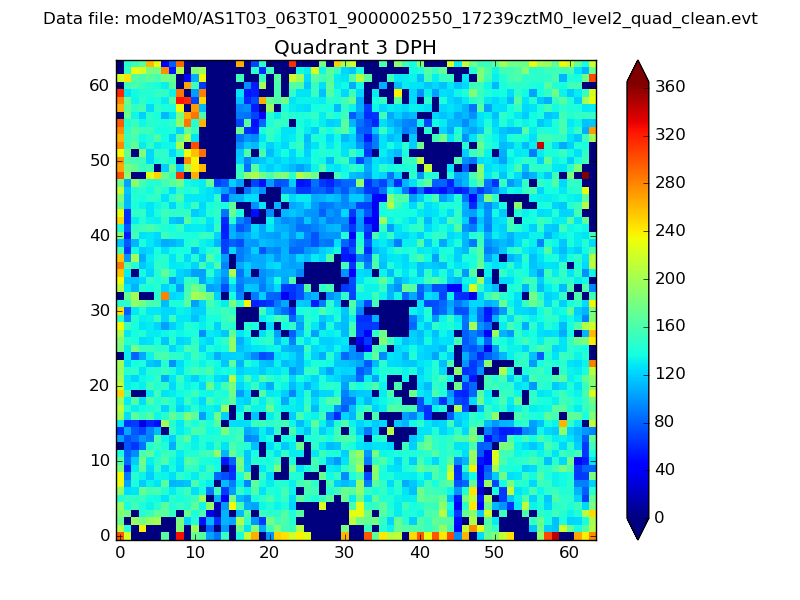 |
 |
Quadrant C |
| Plot type | Count rate plots | Images |
|---|---|---|
| Comparison with Poisson distribution Blue bars denote a histogram of data divided into 1 sec bins. Red curve is a Poisson curve with rate = median count rate of data. |
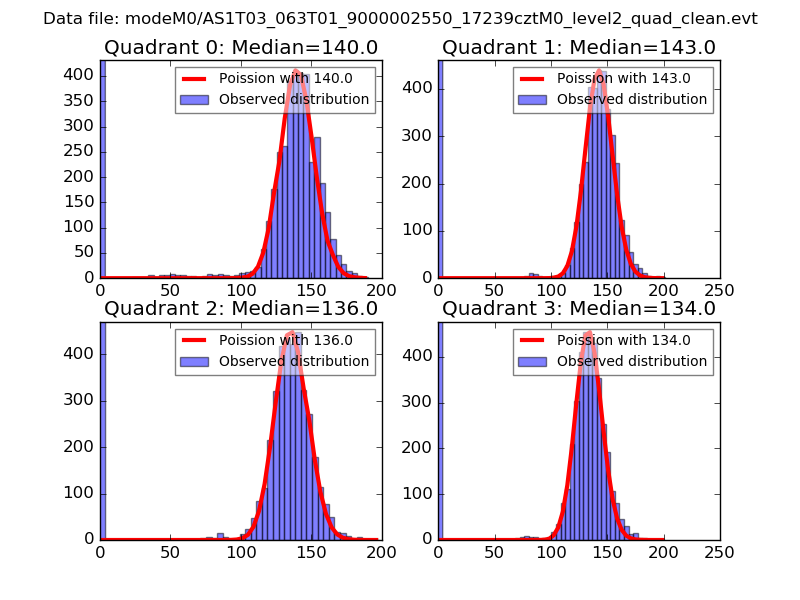 |
 |
| Quadrant-wise count rates Data is divided into 100 sec bins |
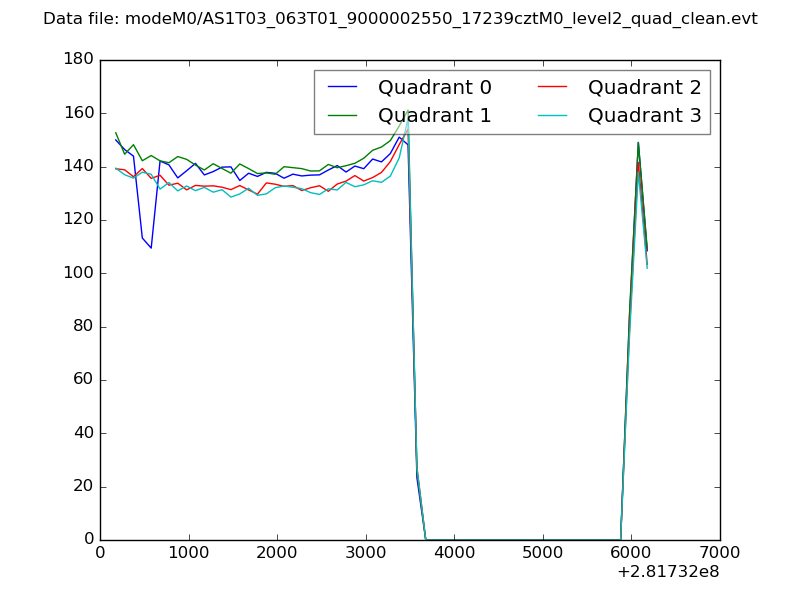 |
|
| Module-wise count rates for Quadrant A Data is divided into 100 sec bins |
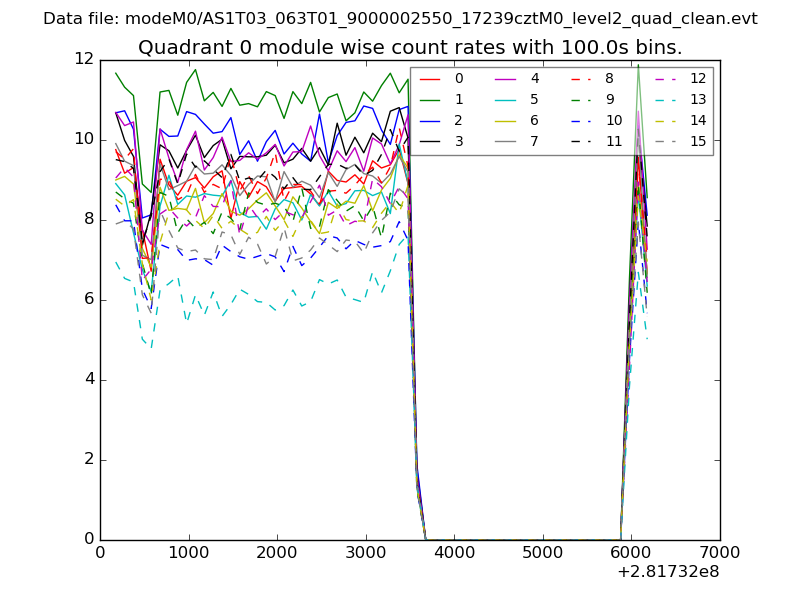 |
 |
| Module-wise count rates for Quadrant B Data is divided into 100 sec bins |
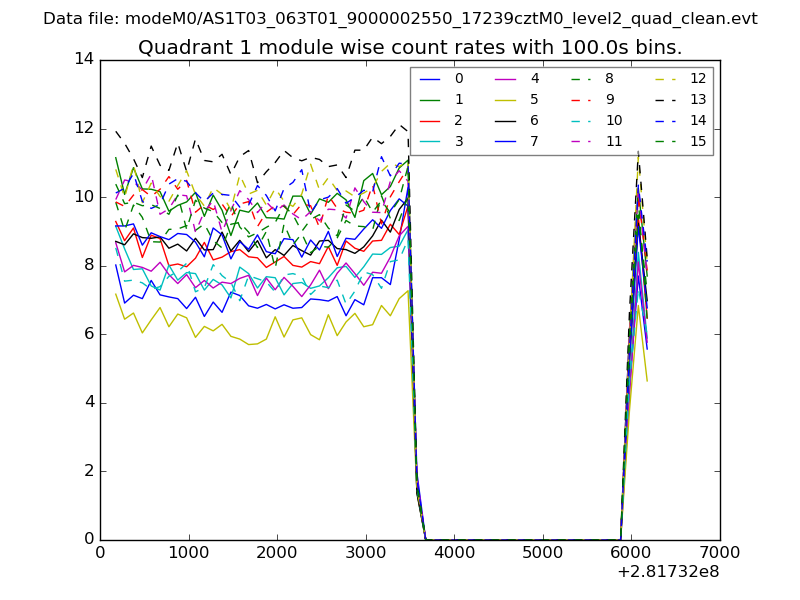 |
 |
| Module-wise count rates for Quadrant C Data is divided into 100 sec bins |
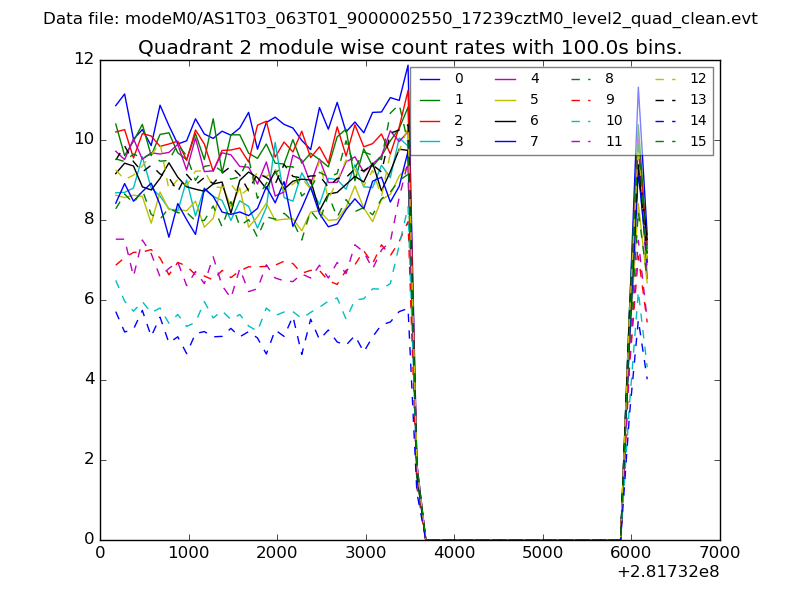 |
 |
| Module-wise count rates for Quadrant D Data is divided into 100 sec bins |
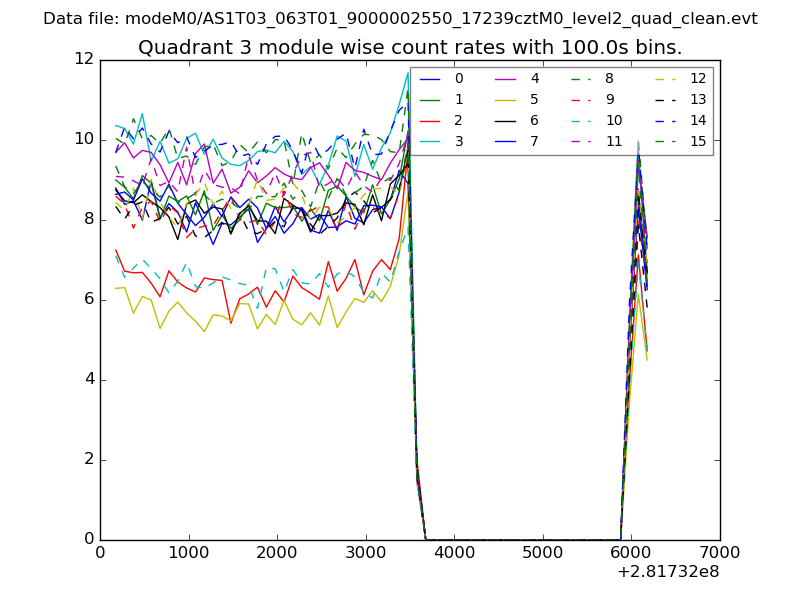 |
 |
| Parameter | Plot |
|---|---|
| CZT HV Monitor | 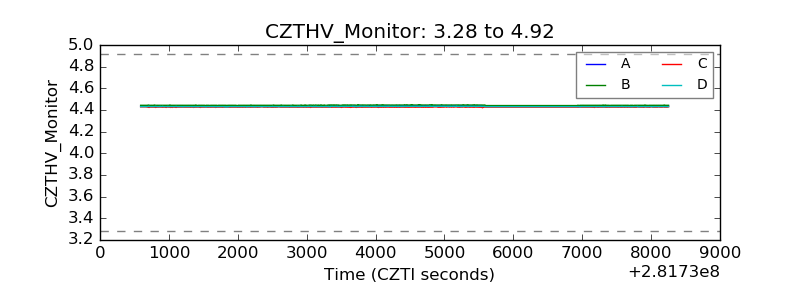 |
| D_VDD | 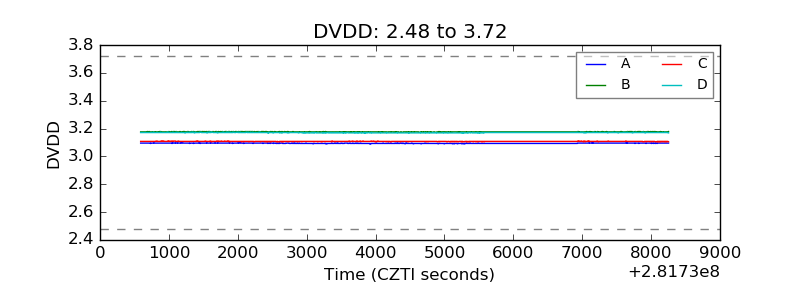 |
| Temperature 1 | 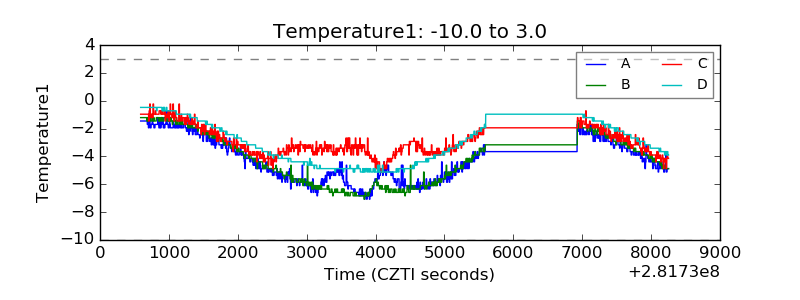 |
| Veto HV Monitor | 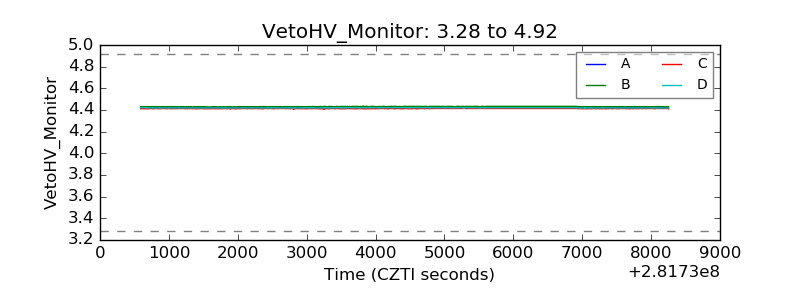 |
| Veto LLD |  |
| Alpha Counter | 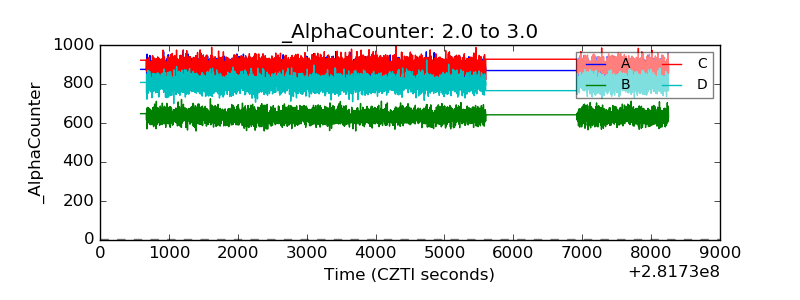 |
| _CPM_Rate | 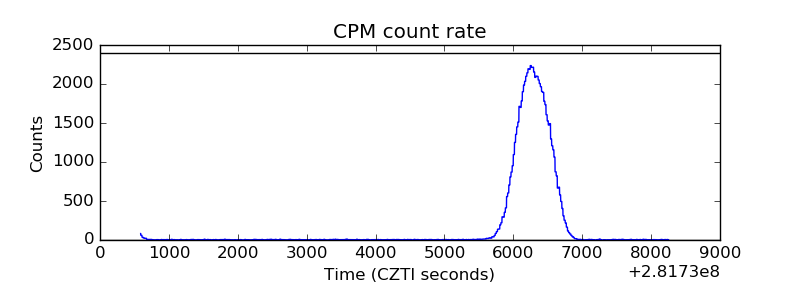 |
| CZT Counter | 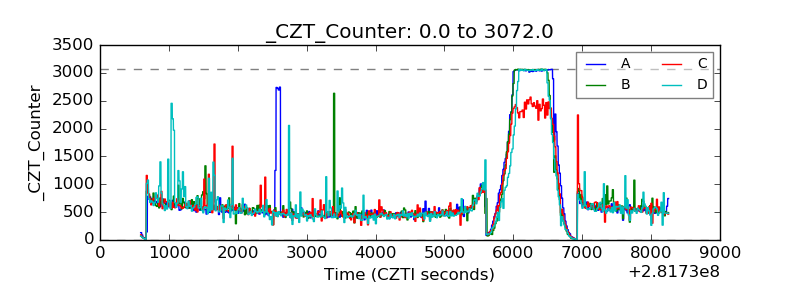 |
| +2.5 Volts monitor |  |
| +5 Volts monitor | 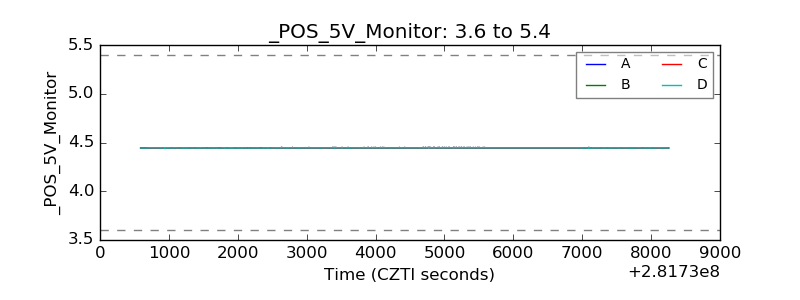 |
| _ROLL_ROT | 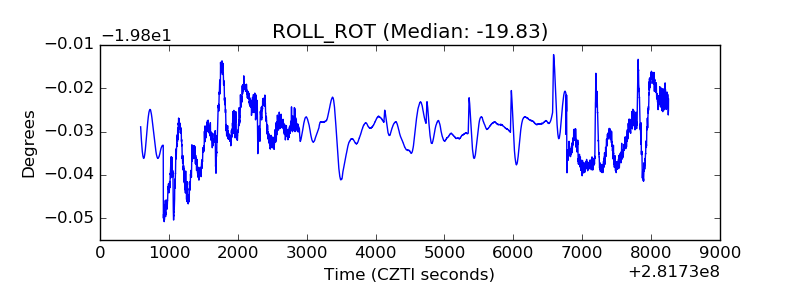 |
| _Roll_DEC | 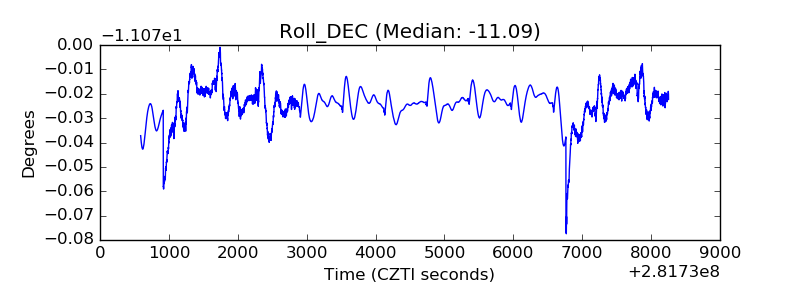 |
| _Roll_RA |  |
| Veto Counter | 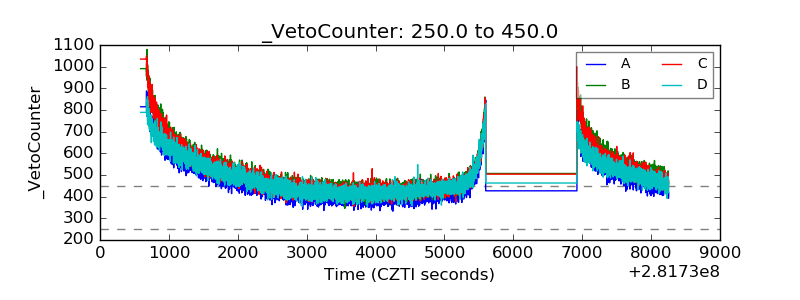 |