| Param | Original file | Final file |
|---|---|---|
| Filename | modeM0/AS1T03_063T01_9000002550_17240cztM0_level2.evt | modeM0/AS1T03_063T01_9000002550_17240cztM0_level2_quad_clean.evt |
| Size (bytes) | 455,523,840 | 89,377,920 |
| Size | 434.4 MB | 85.2 MB |
| Events in quadrant A | 3,252,041 | 575,708 |
| Events in quadrant B | 3,441,564 | 588,485 |
| Events in quadrant C | 3,355,585 | 558,983 |
| Events in quadrant D | 3,317,763 | 543,440 |
| Mode M9 | |||
|---|---|---|---|
| Quadrant | BADHDUFLAG | Total packets | Discarded packets |
| A | 0 | 26 | 0 |
| B | 0 | 26 | 0 |
| C | 0 | 26 | 0 |
| D | 0 | 26 | 0 |
| Mode SS | |||
|---|---|---|---|
| Quadrant | BADHDUFLAG | Total packets | Discarded packets |
| A | 0 | 130 | 0 |
| B | 0 | 130 | 0 |
| C | 0 | 130 | 0 |
| D | 0 | 130 | 0 |
| Mode M0 | |||
|---|---|---|---|
| Quadrant | BADHDUFLAG | Total packets | Discarded packets |
| A | 0 | 13626 | 2 |
| B | 0 | 14235 | 2 |
| C | 0 | 13761 | 2 |
| D | 0 | 14064 | 2 |
| Quadrant | Total seconds | Saturated seconds | Saturation percentage |
|---|---|---|---|
| A | 6305 | 149 | 2.363204% |
| B | 6306 | 176 | 2.790993% |
| C | 6306 | 176 | 2.790993% |
| D | 6306 | 116 | 1.839518% |
Noise dominated data is calculated using 1-second bins in cleaned event files. If a bin has >2000 counts, and if more than 50% of those come from <1% of pixels, then it is considered to be noise-dominated and hence unusable.
| Quadrant | # 1 sec bins | Bins with >0 counts | Bins with >2000 counts | High rate bins dominated by noise | Noise dominated (total time) | Noise dominated (detector-on time) | Marked lightcurve |
|---|---|---|---|---|---|---|---|
| A | 8905 | 6307 | 3 | 3 | 0.03% | 0.05% | 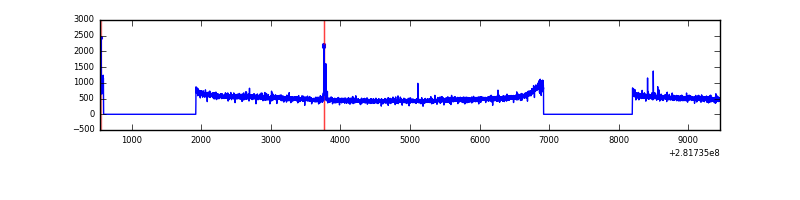 |
| B | 8906 | 6308 | 7 | 7 | 0.08% | 0.11% | 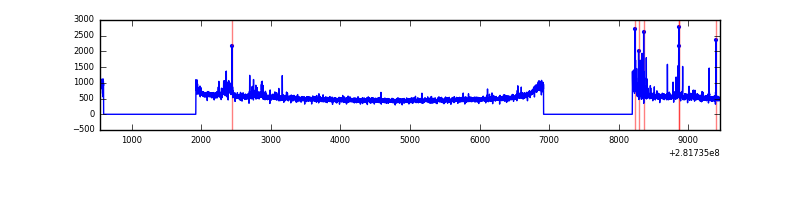 |
| C | 8906 | 6308 | 10 | 10 | 0.11% | 0.16% | 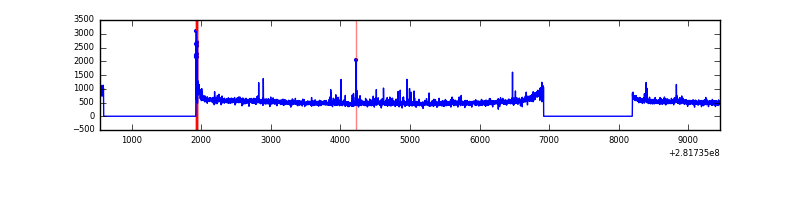 |
| D | 8906 | 6308 | 20 | 20 | 0.22% | 0.32% | 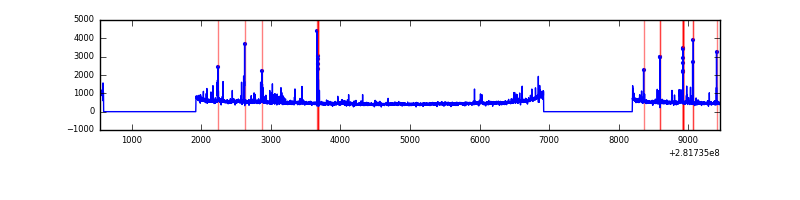 |
Top three noisy pixels from each quadrant. If the there are fewer than three noisy pixels in the level2.evt file, extra rows are filled as -1
| Pixel properties | Quadrant properties | ||||||
|---|---|---|---|---|---|---|---|
| Quadrant | DetID | PixID | Counts | Sigma | Mean | Median | Sigma |
| A | 15 | 174 | 31567 | 183.13 | 833 | 818 | 167.9 |
| A | 0 | 23 | 12438 | 69.2 | 833 | 818 | 167.9 |
| A | 0 | 226 | 8148 | 43.65 | 833 | 818 | 167.9 |
| B | 3 | 209 | 50540 | 310.62 | 837 | 817 | 160.1 |
| B | 15 | 35 | 40351 | 246.97 | 837 | 817 | 160.1 |
| B | 7 | 220 | 38718 | 236.77 | 837 | 817 | 160.1 |
| C | 14 | 238 | 122313 | 658.39 | 794 | 803 | 184.6 |
| C | 7 | 220 | 93810 | 503.95 | 794 | 803 | 184.6 |
| C | 1 | 16 | 27730 | 145.9 | 794 | 803 | 184.6 |
| D | 13 | 189 | 83600 | 425.42 | 800 | 777 | 194.7 |
| D | 10 | 70 | 59326 | 300.74 | 800 | 777 | 194.7 |
| D | 1 | 52 | 54468 | 275.79 | 800 | 777 | 194.7 |
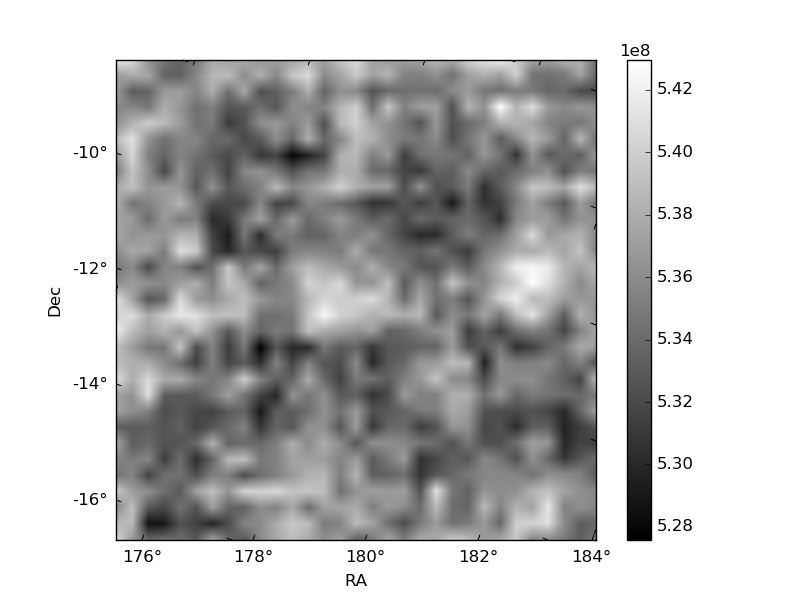
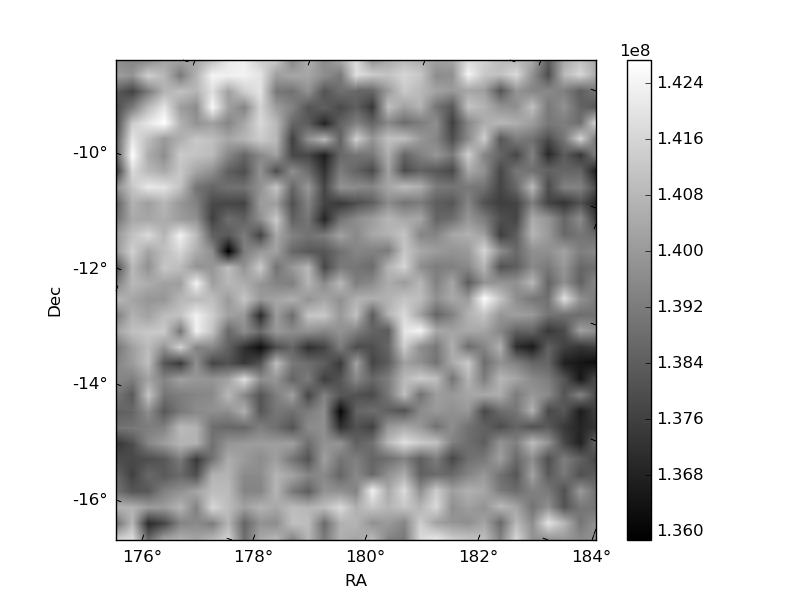
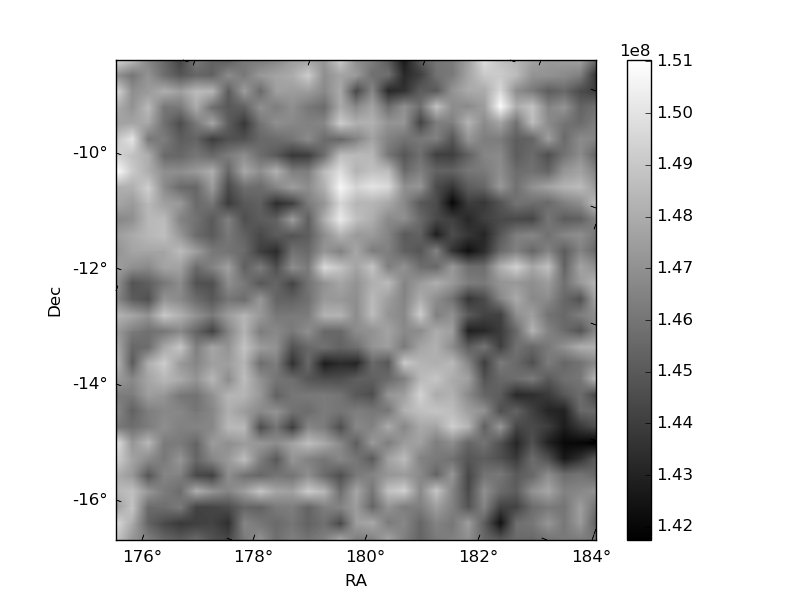
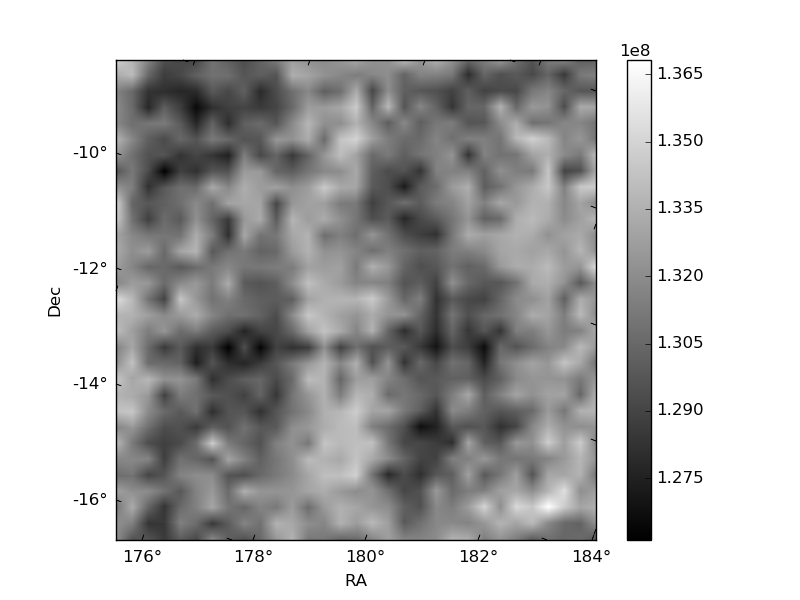
Histogram calculated using DETX and DETY for each event in the final _common_clean file
| Quadrant A | 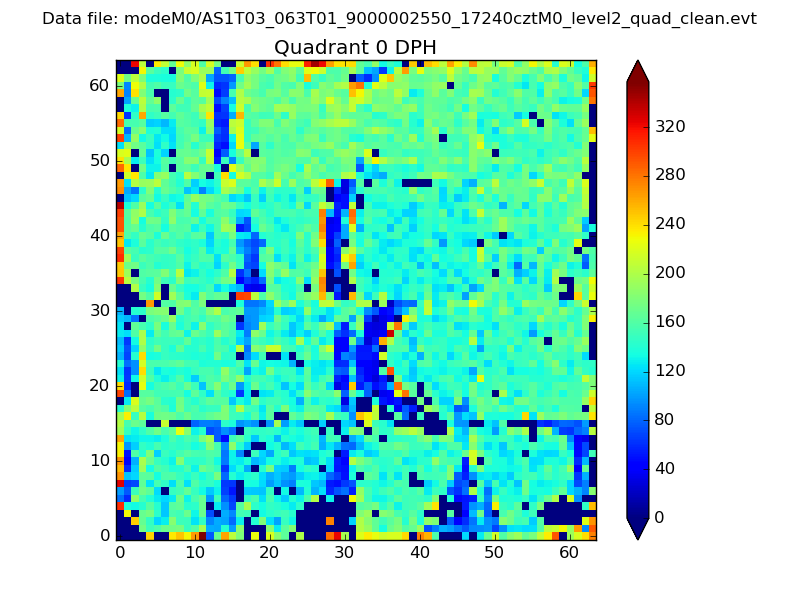 |
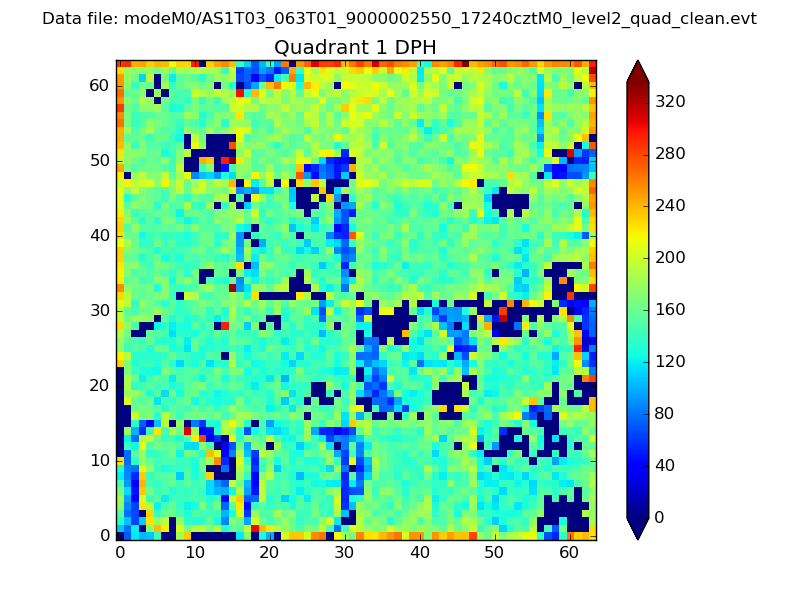 |
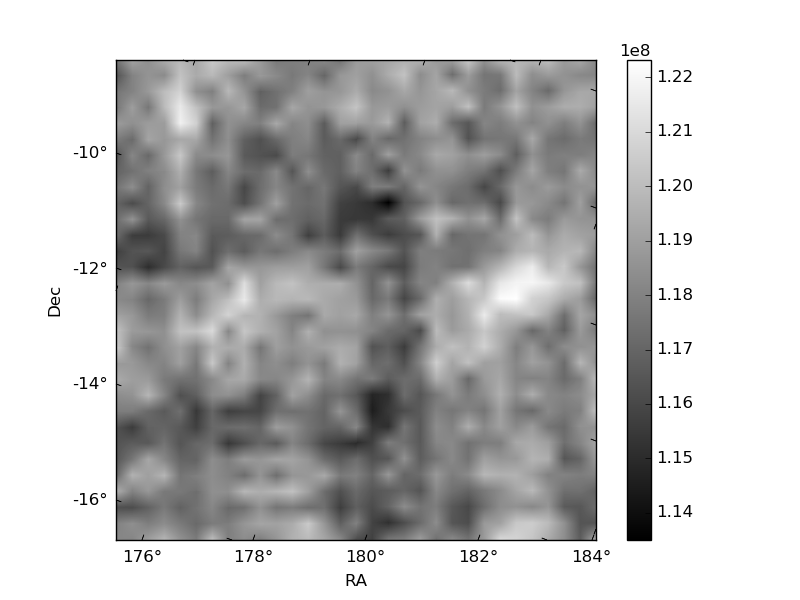
Quadrant B |
|---|---|---|---|
| Quadrant D |  |
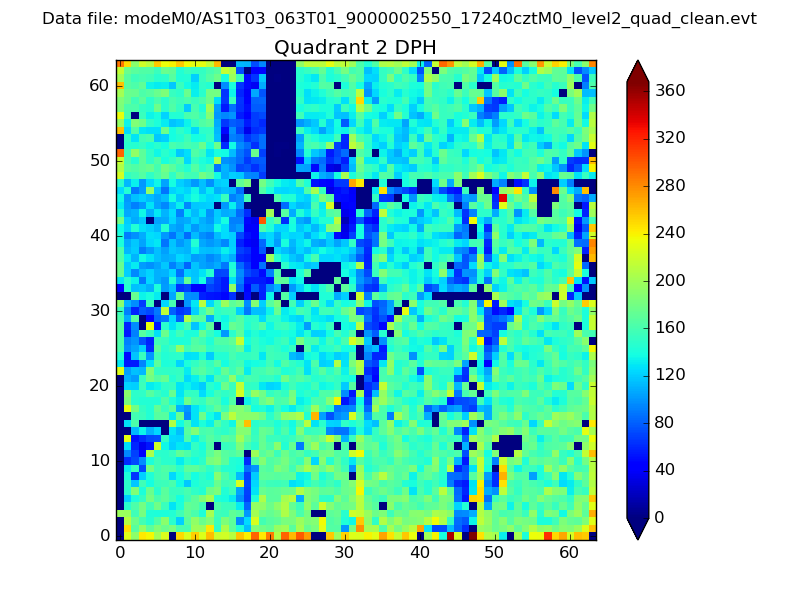 |
Quadrant C |
| Plot type | Count rate plots | Images |
|---|---|---|
| Comparison with Poisson distribution Blue bars denote a histogram of data divided into 1 sec bins. Red curve is a Poisson curve with rate = median count rate of data. |
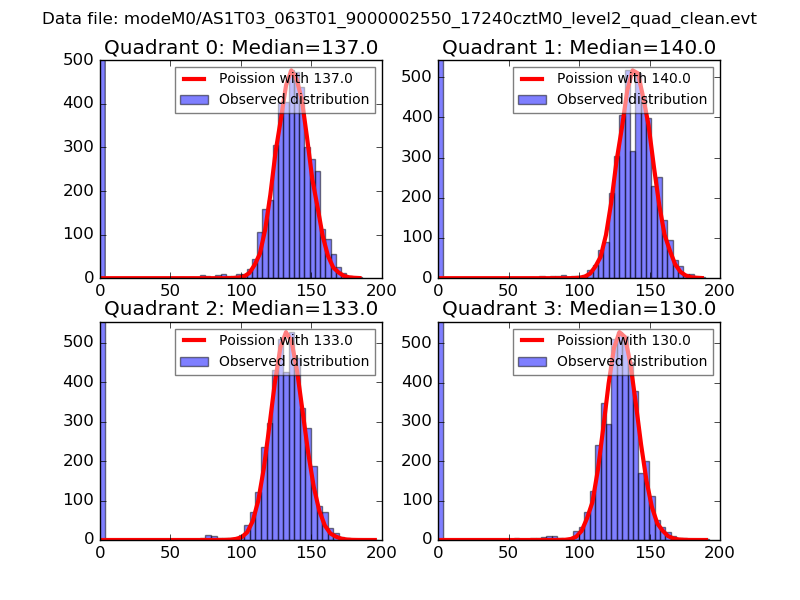 |
 |
| Quadrant-wise count rates Data is divided into 100 sec bins |
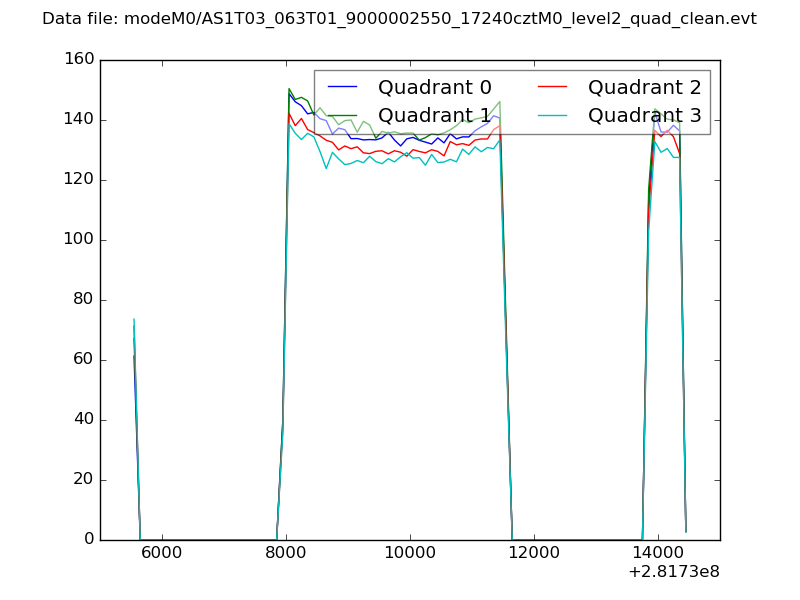 |
|
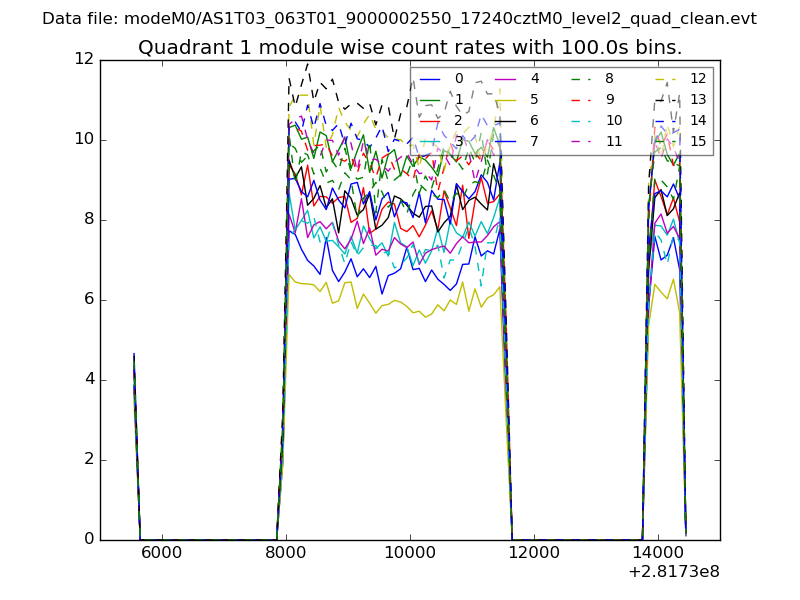
| Module-wise count rates for Quadrant A Data is divided into 100 sec bins |
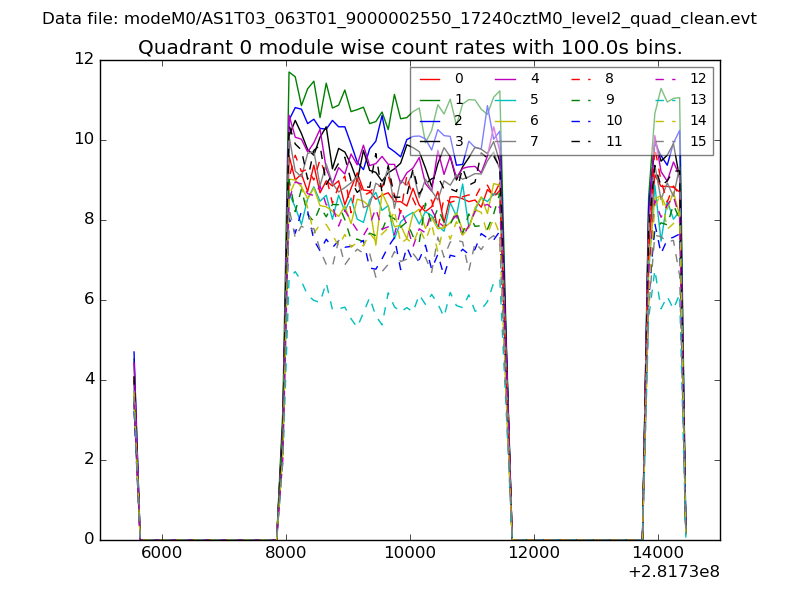 |
 |
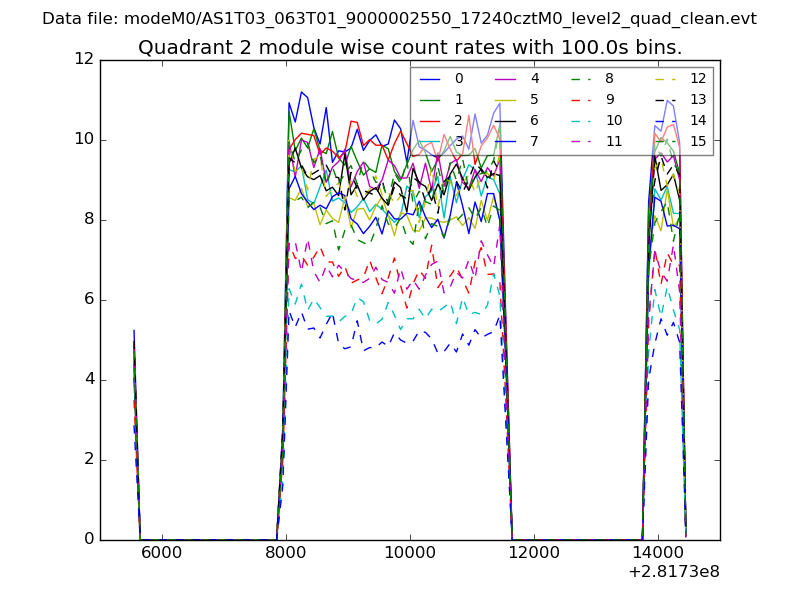
| Module-wise count rates for Quadrant B Data is divided into 100 sec bins |
 |
 |
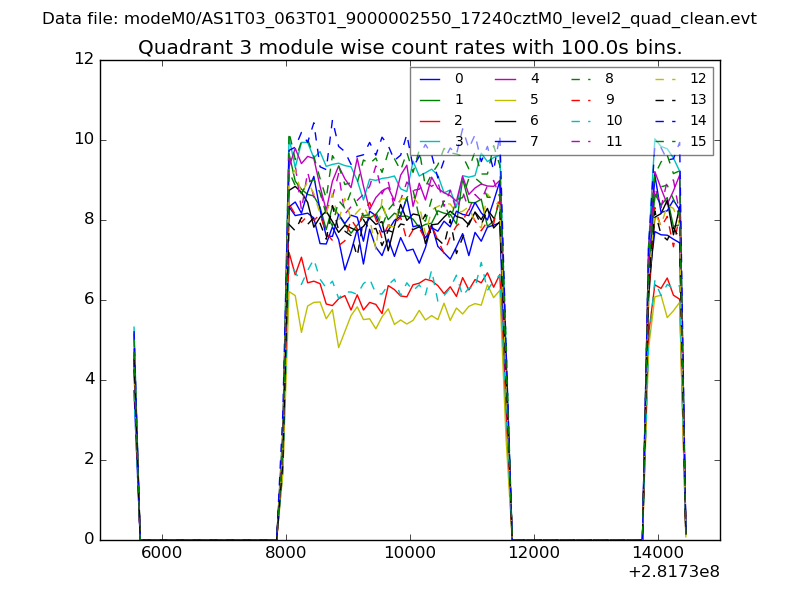
| Module-wise count rates for Quadrant C Data is divided into 100 sec bins |
 |
 |
| Module-wise count rates for Quadrant D Data is divided into 100 sec bins |
 |
 |
| Parameter | Plot |
|---|---|
| CZT HV Monitor | 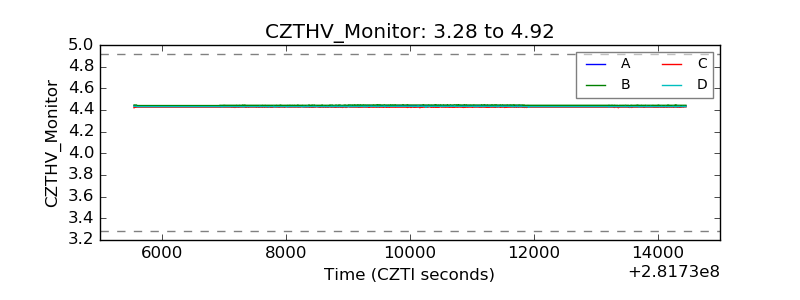 |
| D_VDD | 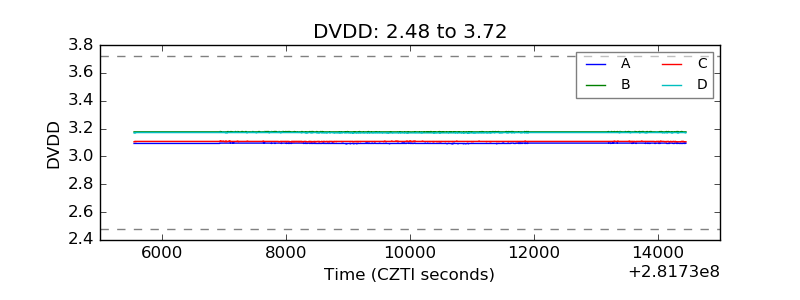 |
| Temperature 1 | 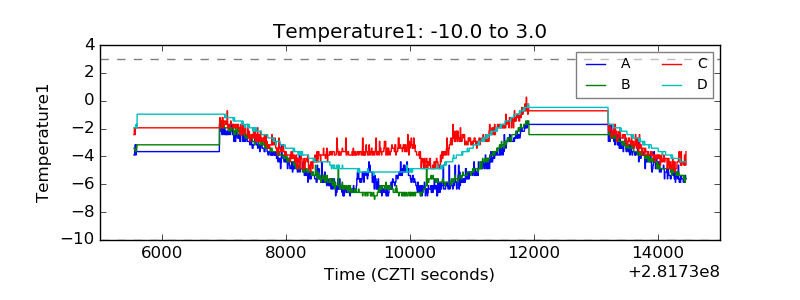 |
| Veto HV Monitor |  |
| Veto LLD | 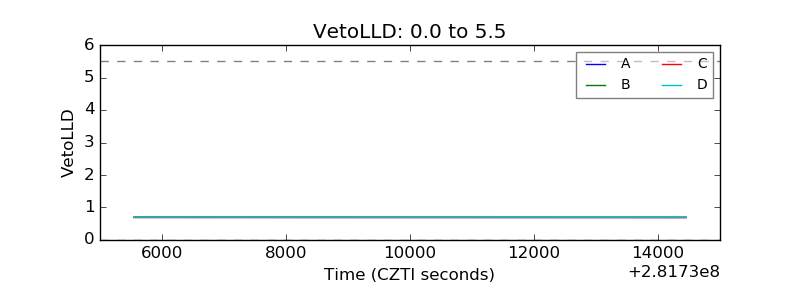 |
| Alpha Counter | 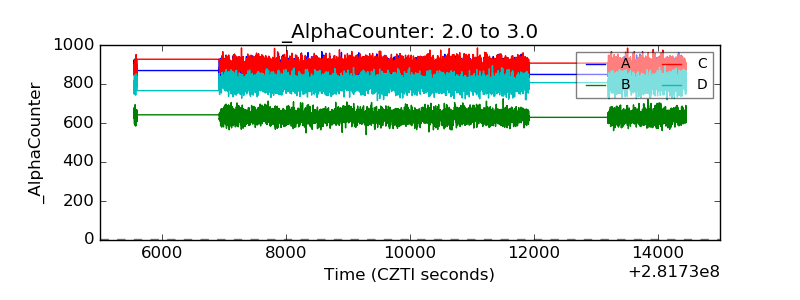 |
| _CPM_Rate | 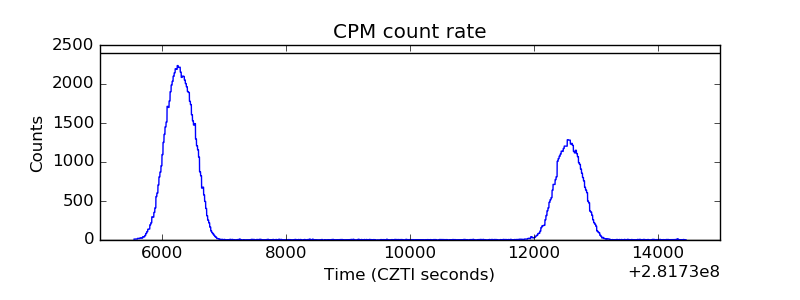 |
| CZT Counter | 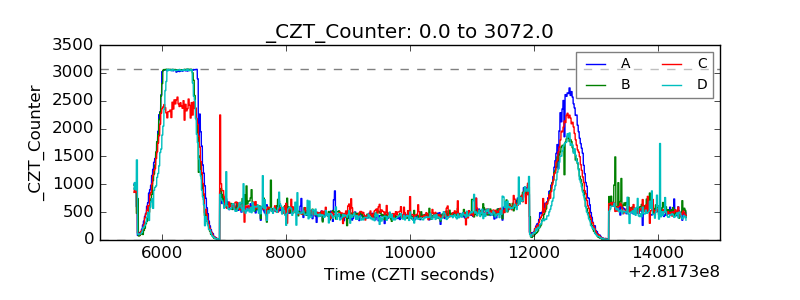 |
| +2.5 Volts monitor | 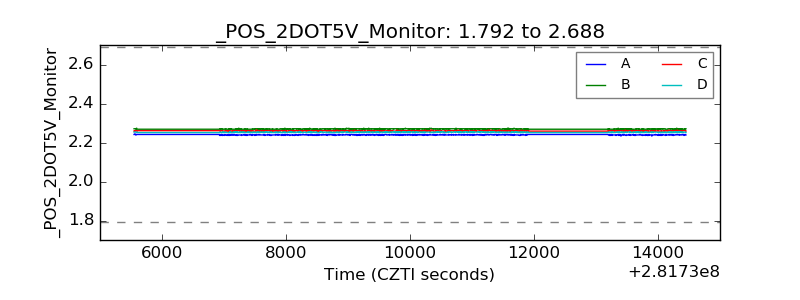 |
| +5 Volts monitor |  |
| _ROLL_ROT | 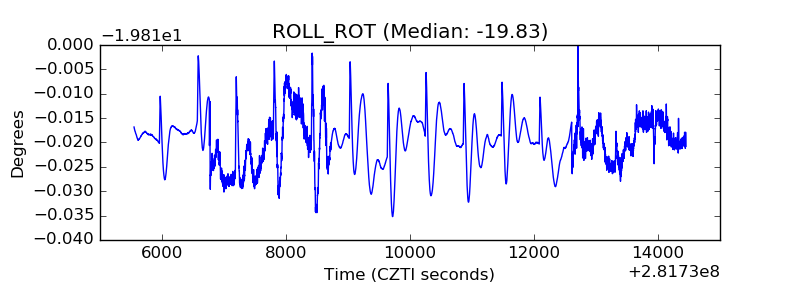 |
| _Roll_DEC | 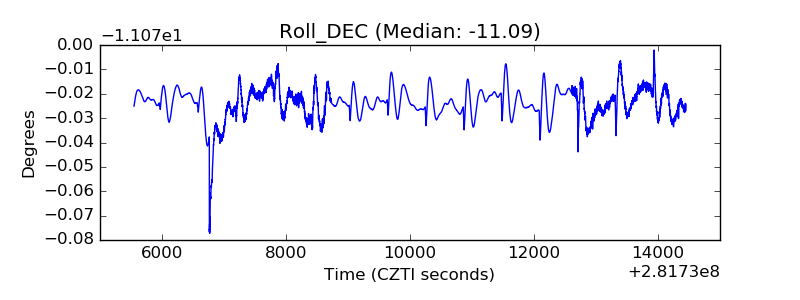 |
| _Roll_RA | 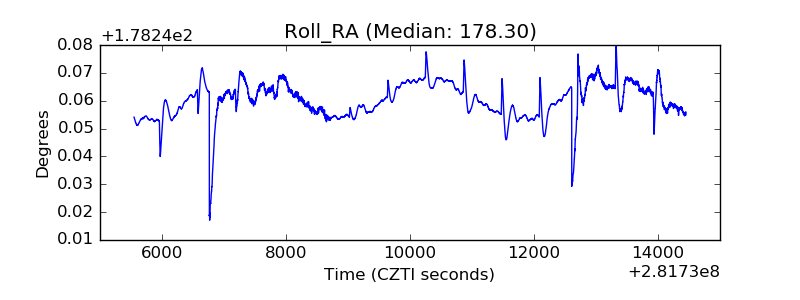 |
| Veto Counter | 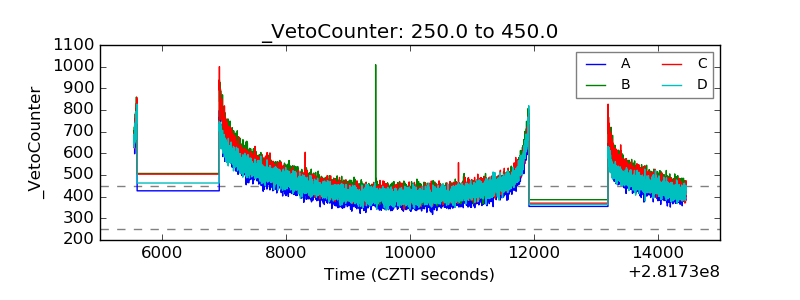 |