| Param | Original file | Final file |
|---|---|---|
| Filename | modeM0/AS1T03_063T01_9000002550_17241cztM0_level2.evt | modeM0/AS1T03_063T01_9000002550_17241cztM0_level2_quad_clean.evt |
| Size (bytes) | 455,840,640 | 94,279,680 |
| Size | 434.7 MB | 89.9 MB |
| Events in quadrant A | 3,172,446 | 609,029 |
| Events in quadrant B | 3,488,303 | 621,042 |
| Events in quadrant C | 3,301,013 | 589,594 |
| Events in quadrant D | 3,396,589 | 577,019 |
| Mode M9 | |||
|---|---|---|---|
| Quadrant | BADHDUFLAG | Total packets | Discarded packets |
| A | 0 | 16 | 0 |
| B | 0 | 17 | 0 |
| C | 0 | 17 | 0 |
| D | 0 | 17 | 0 |
| Mode SS | |||
|---|---|---|---|
| Quadrant | BADHDUFLAG | Total packets | Discarded packets |
| A | 0 | 132 | 0 |
| B | 0 | 132 | 0 |
| C | 0 | 132 | 0 |
| D | 0 | 132 | 0 |
| Mode M0 | |||
|---|---|---|---|
| Quadrant | BADHDUFLAG | Total packets | Discarded packets |
| A | 0 | 13687 | 2 |
| B | 0 | 14597 | 2 |
| C | 0 | 13936 | 2 |
| D | 0 | 14672 | 2 |
| Quadrant | Total seconds | Saturated seconds | Saturation percentage |
|---|---|---|---|
| A | 6580 | 58 | 0.881459% |
| B | 6580 | 94 | 1.428571% |
| C | 6580 | 74 | 1.124620% |
| D | 6580 | 95 | 1.443769% |
Noise dominated data is calculated using 1-second bins in cleaned event files. If a bin has >2000 counts, and if more than 50% of those come from <1% of pixels, then it is considered to be noise-dominated and hence unusable.
| Quadrant | # 1 sec bins | Bins with >0 counts | Bins with >2000 counts | High rate bins dominated by noise | Noise dominated (total time) | Noise dominated (detector-on time) | Marked lightcurve |
|---|---|---|---|---|---|---|---|
| A | 7635 | 6581 | 0 | 0 | 0.00% | 0.00% | 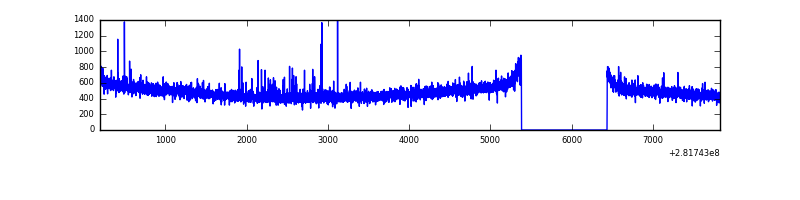 |
| B | 7635 | 6581 | 9 | 9 | 0.12% | 0.14% | 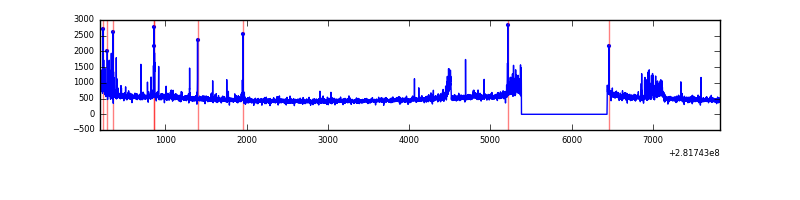 |
| C | 7635 | 6581 | 7 | 7 | 0.09% | 0.11% | 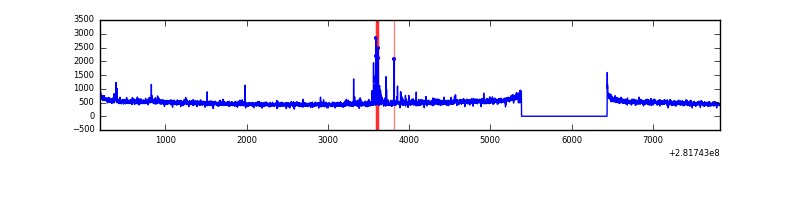 |
| D | 7635 | 6581 | 59 | 59 | 0.77% | 0.90% | 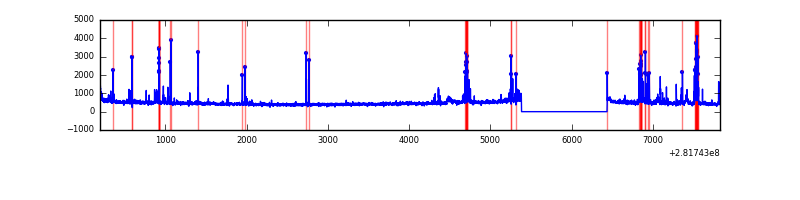 |
Top three noisy pixels from each quadrant. If the there are fewer than three noisy pixels in the level2.evt file, extra rows are filled as -1
| Pixel properties | Quadrant properties | ||||||
|---|---|---|---|---|---|---|---|
| Quadrant | DetID | PixID | Counts | Sigma | Mean | Median | Sigma |
| A | 0 | 23 | 24319 | 141.76 | 817 | 799 | 165.9 |
| A | 0 | 226 | 8509 | 46.47 | 817 | 799 | 165.9 |
| A | 12 | 194 | 6035 | 31.56 | 817 | 799 | 165.9 |
| B | 7 | 220 | 71162 | 452.17 | 821 | 802 | 155.6 |
| B | 0 | 189 | 68234 | 433.35 | 821 | 802 | 155.6 |
| B | 3 | 209 | 42857 | 270.26 | 821 | 802 | 155.6 |
| C | 14 | 238 | 120937 | 655.69 | 783 | 791 | 183.2 |
| C | 7 | 220 | 79417 | 429.1 | 783 | 791 | 183.2 |
| C | 3 | 233 | 28914 | 153.48 | 783 | 791 | 183.2 |
| D | 10 | 70 | 166794 | 862.42 | 784 | 760 | 192.5 |
| D | 13 | 189 | 141656 | 731.84 | 784 | 760 | 192.5 |
| D | 15 | 0 | 32841 | 166.64 | 784 | 760 | 192.5 |
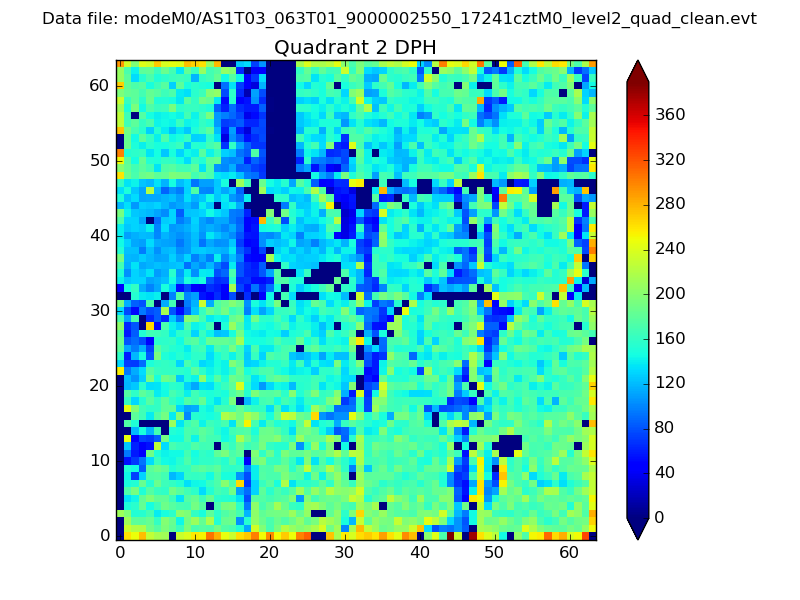
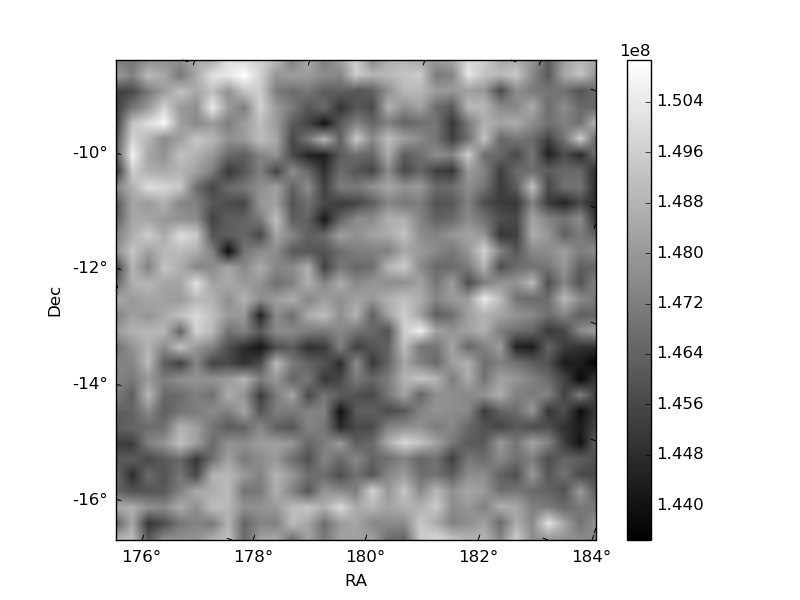
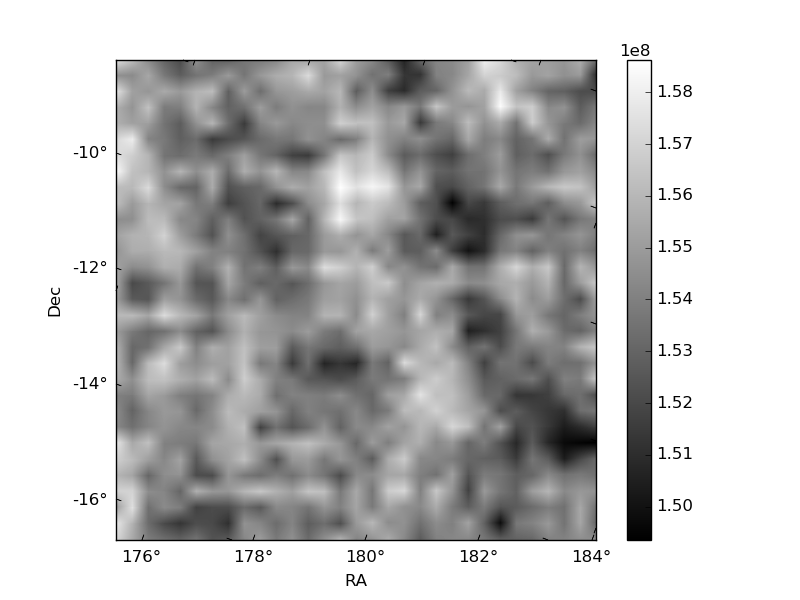
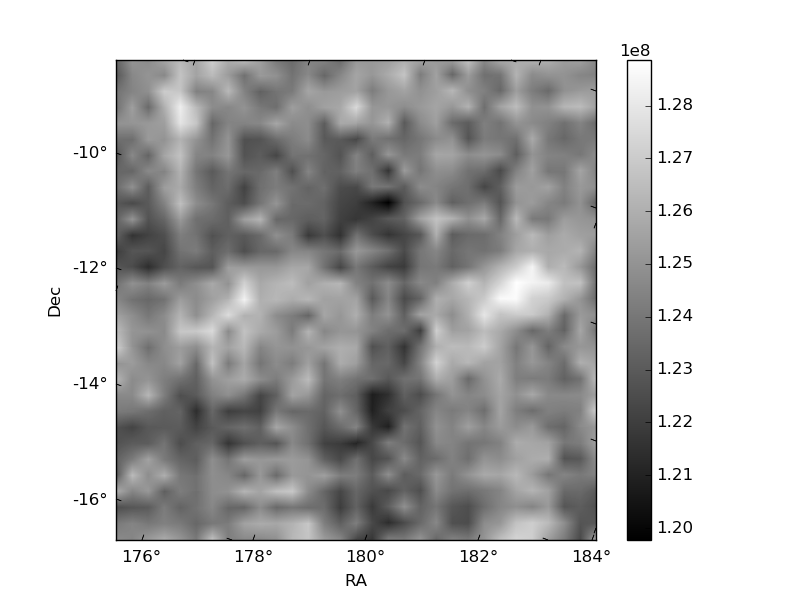
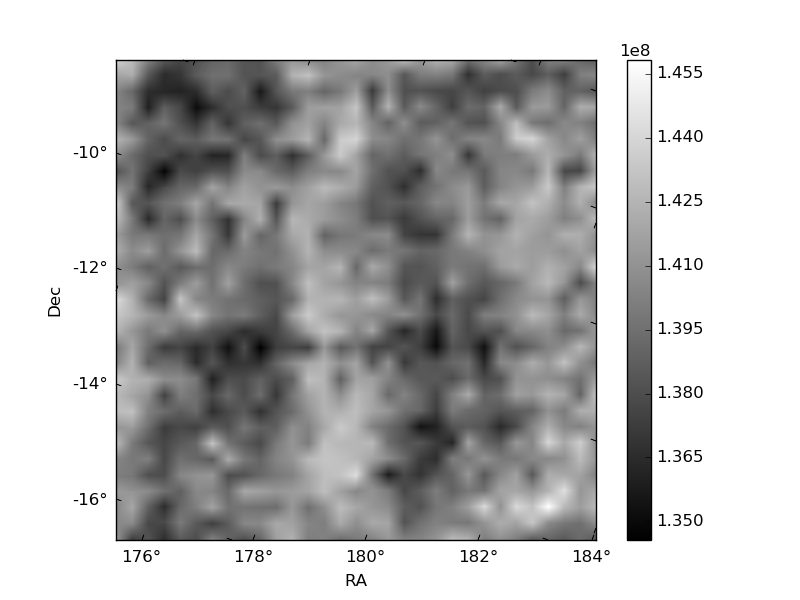
Histogram calculated using DETX and DETY for each event in the final _common_clean file
| Quadrant A |  |
 |
Quadrant B |
|---|---|---|---|
| Quadrant D | 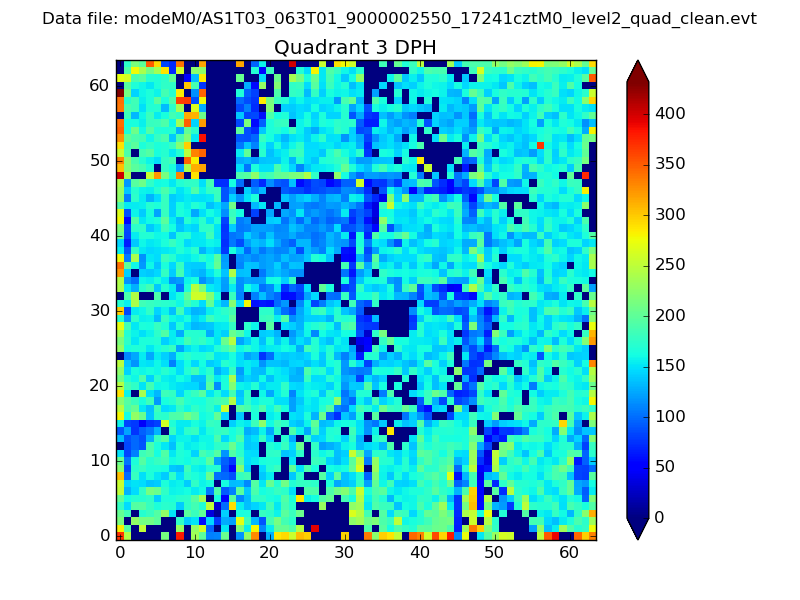 |
 |
Quadrant C |
| Plot type | Count rate plots | Images |
|---|---|---|
| Comparison with Poisson distribution Blue bars denote a histogram of data divided into 1 sec bins. Red curve is a Poisson curve with rate = median count rate of data. |
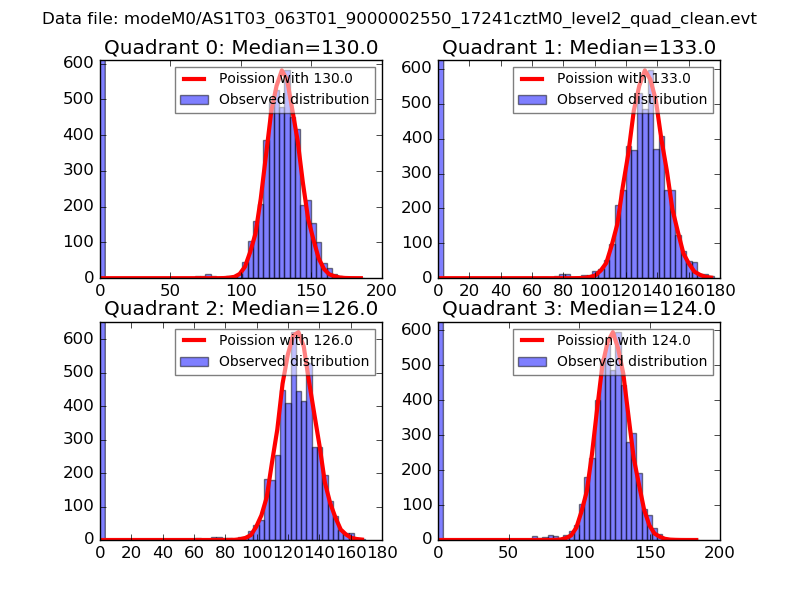 |
 |
| Quadrant-wise count rates Data is divided into 100 sec bins |
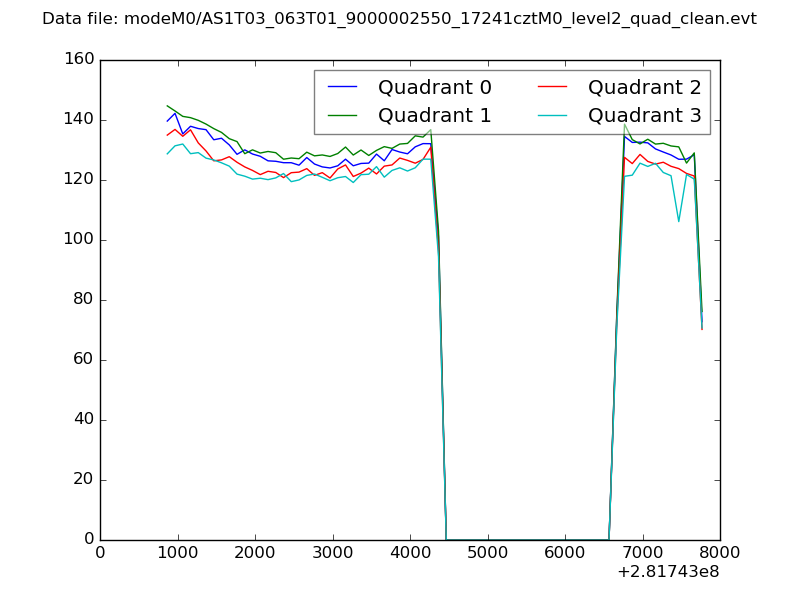 |
|
| Module-wise count rates for Quadrant A Data is divided into 100 sec bins |
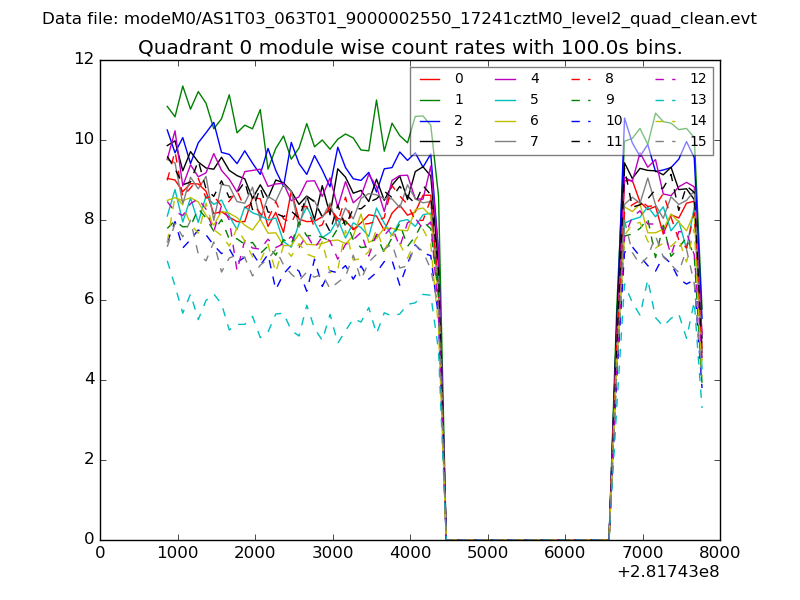 |
 |
| Module-wise count rates for Quadrant B Data is divided into 100 sec bins |
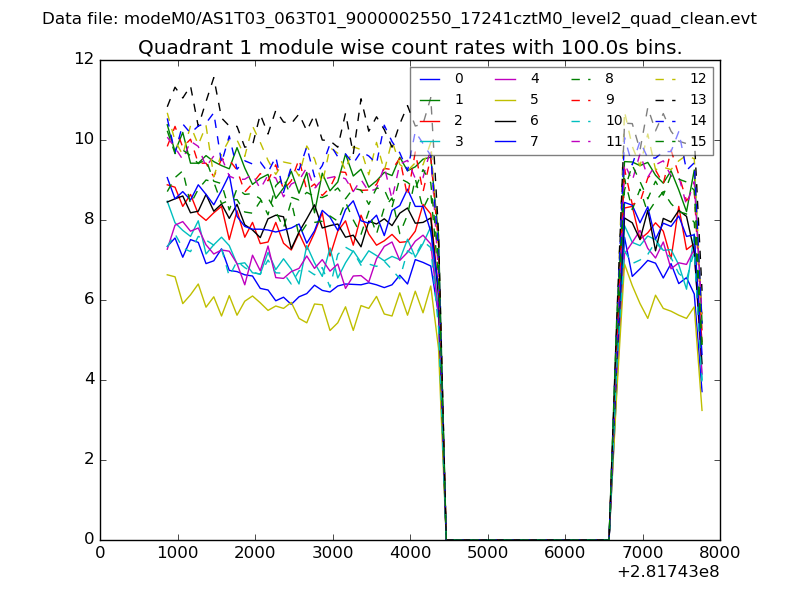 |
 |
| Module-wise count rates for Quadrant C Data is divided into 100 sec bins |
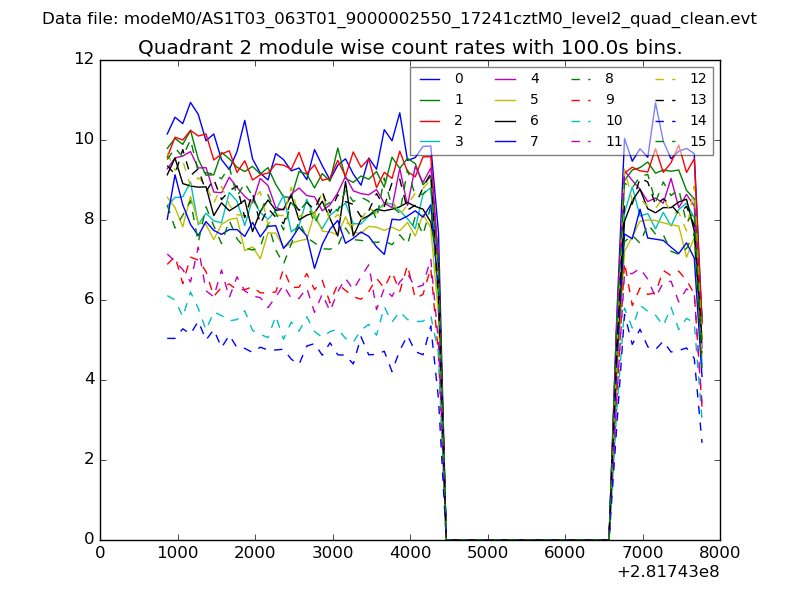 |
 |
| Module-wise count rates for Quadrant D Data is divided into 100 sec bins |
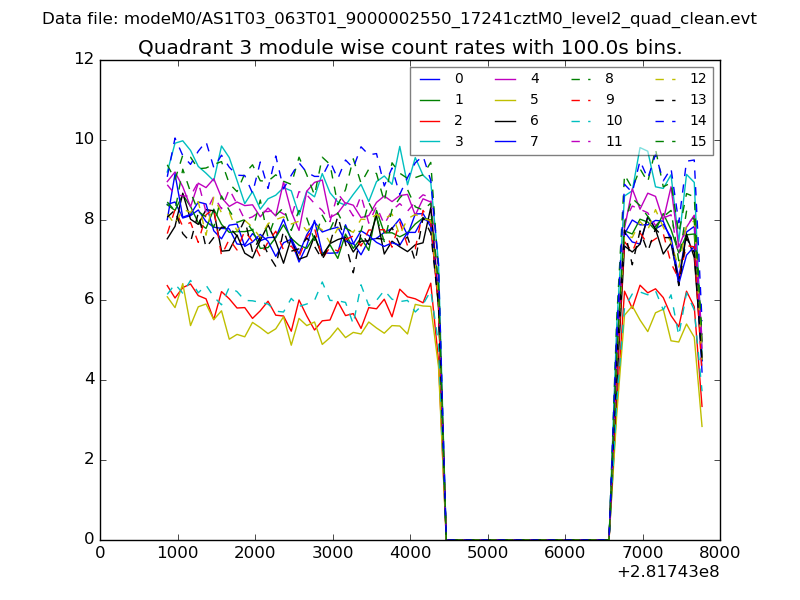 |
 |
| Parameter | Plot |
|---|---|
| CZT HV Monitor | 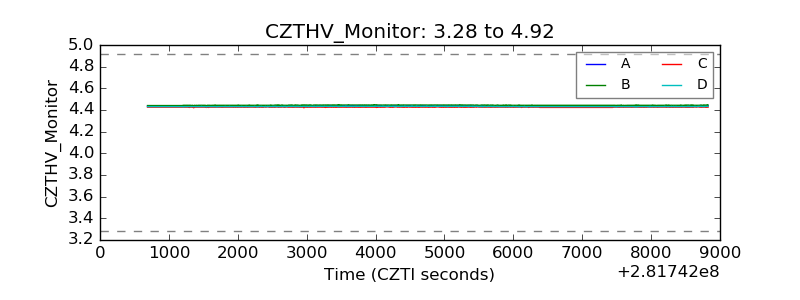 |
| D_VDD | 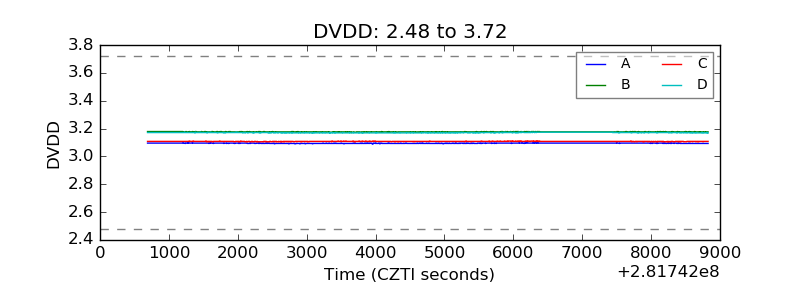 |
| Temperature 1 | 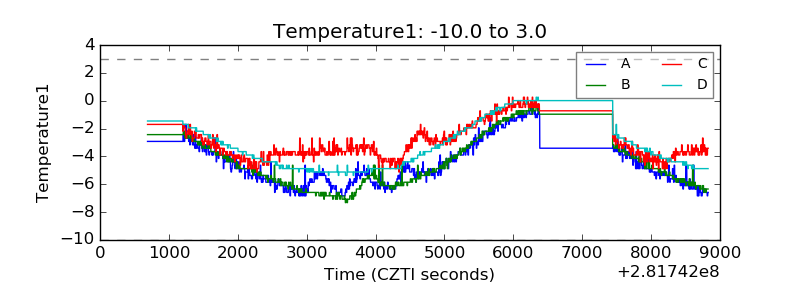 |
| Veto HV Monitor | 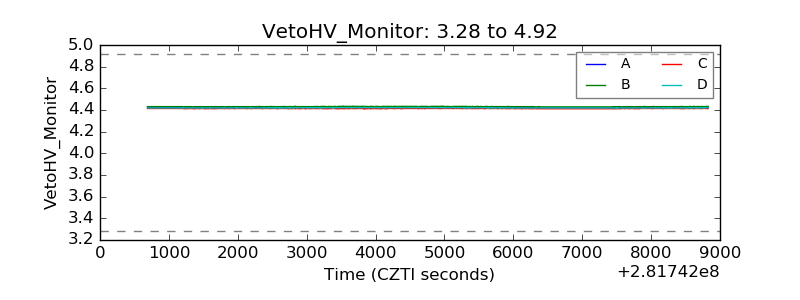 |
| Veto LLD |  |
| Alpha Counter | 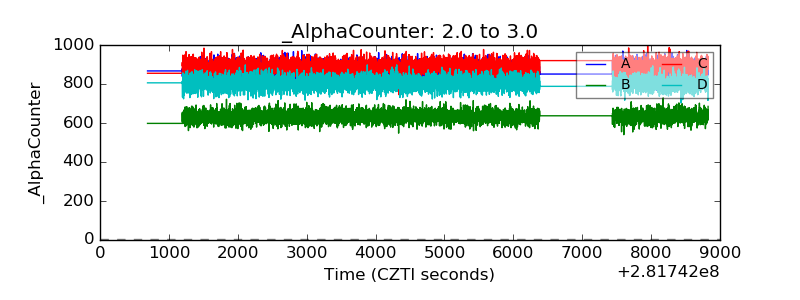 |
| _CPM_Rate | 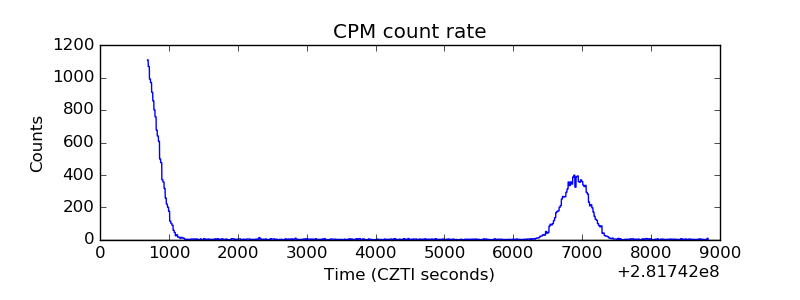 |
| CZT Counter | 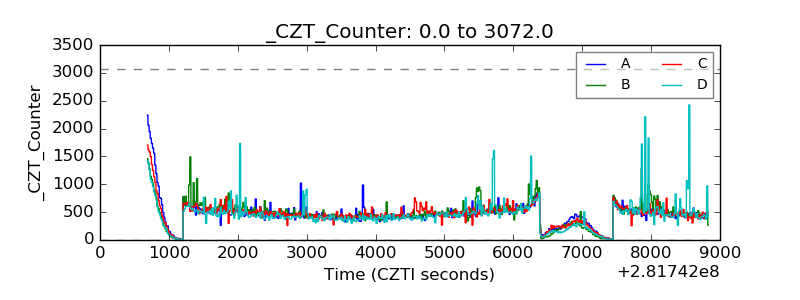 |
| +2.5 Volts monitor |  |
| +5 Volts monitor | 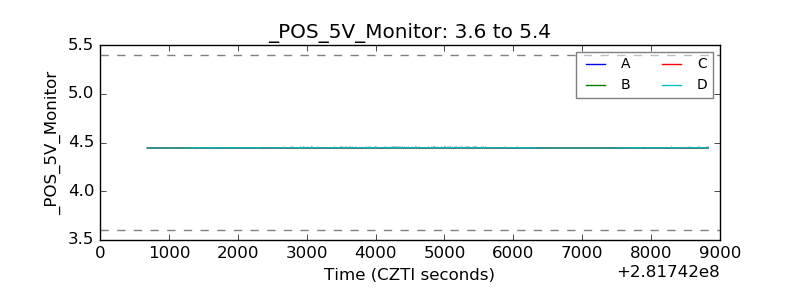 |
| _ROLL_ROT | 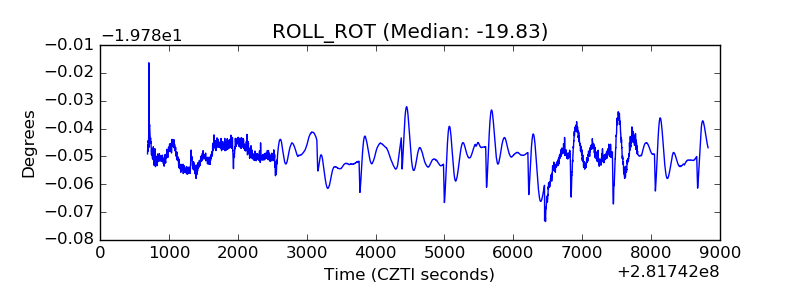 |
| _Roll_DEC | 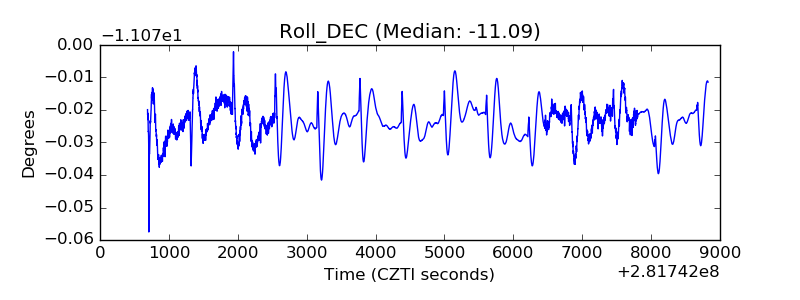 |
| _Roll_RA | 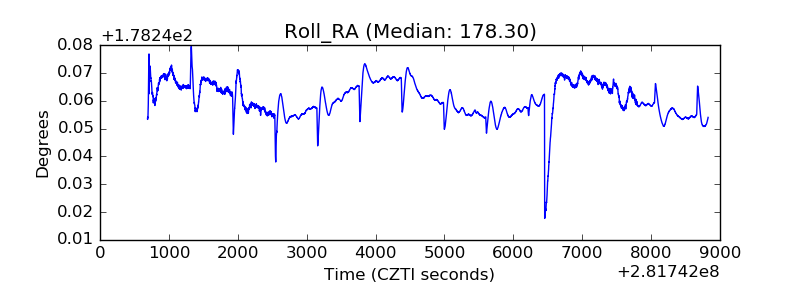 |
| Veto Counter | 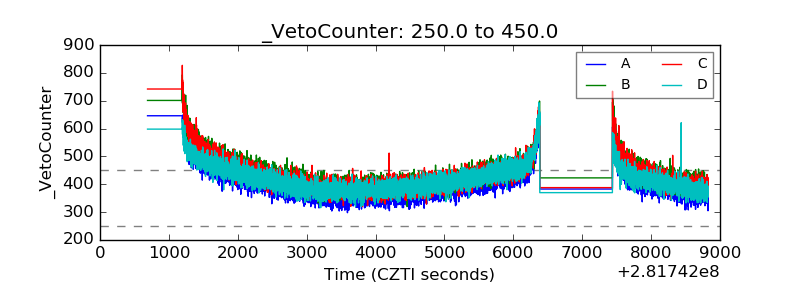 |