| Param | Original file | Final file |
|---|---|---|
| Filename | modeM0/AS1T03_063T01_9000002550_17243cztM0_level2.evt | modeM0/AS1T03_063T01_9000002550_17243cztM0_level2_quad_clean.evt |
| Size (bytes) | 538,421,760 | 100,696,320 |
| Size | 513.5 MB | 96.0 MB |
| Events in quadrant A | 3,758,163 | 635,622 |
| Events in quadrant B | 4,148,506 | 644,178 |
| Events in quadrant C | 3,814,337 | 618,718 |
| Events in quadrant D | 4,052,324 | 605,298 |
| Mode M9 | |||
|---|---|---|---|
| Quadrant | BADHDUFLAG | Total packets | Discarded packets |
| A | 0 | 10 | 0 |
| B | 0 | 10 | 0 |
| C | 0 | 10 | 0 |
| D | 0 | 10 | 0 |
| Mode SS | |||
|---|---|---|---|
| Quadrant | BADHDUFLAG | Total packets | Discarded packets |
| A | 0 | 162 | 0 |
| B | 0 | 162 | 0 |
| C | 0 | 162 | 0 |
| D | 0 | 162 | 0 |
| Mode M0 | |||
|---|---|---|---|
| Quadrant | BADHDUFLAG | Total packets | Discarded packets |
| A | 0 | 16421 | 2 |
| B | 0 | 17695 | 2 |
| C | 0 | 16365 | 2 |
| D | 0 | 17599 | 2 |
| Quadrant | Total seconds | Saturated seconds | Saturation percentage |
|---|---|---|---|
| A | 7844 | 50 | 0.637430% |
| B | 7845 | 133 | 1.695347% |
| C | 7845 | 110 | 1.402167% |
| D | 7844 | 140 | 1.784804% |
Noise dominated data is calculated using 1-second bins in cleaned event files. If a bin has >2000 counts, and if more than 50% of those come from <1% of pixels, then it is considered to be noise-dominated and hence unusable.
| Quadrant | # 1 sec bins | Bins with >0 counts | Bins with >2000 counts | High rate bins dominated by noise | Noise dominated (total time) | Noise dominated (detector-on time) | Marked lightcurve |
|---|---|---|---|---|---|---|---|
| A | 8884 | 7846 | 0 | 0 | 0.00% | 0.00% | 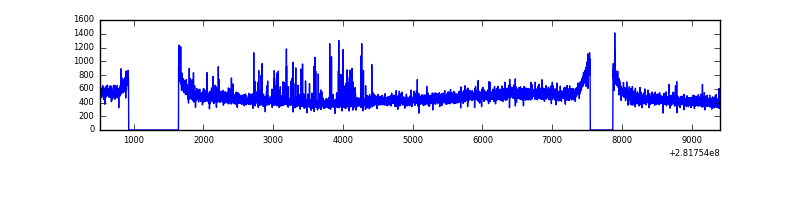 |
| B | 8885 | 7847 | 17 | 17 | 0.19% | 0.22% | 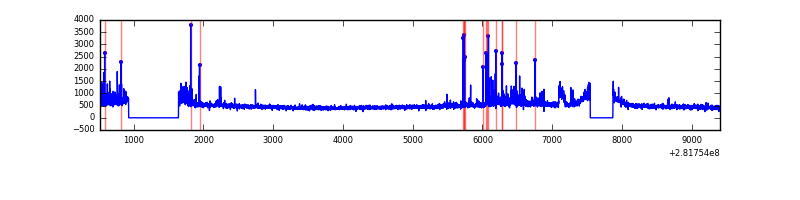 |
| C | 8885 | 7847 | 0 | 0 | 0.00% | 0.00% | 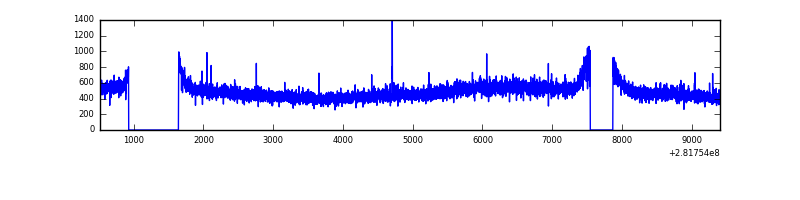 |
| D | 8884 | 7846 | 89 | 89 | 1.00% | 1.13% | 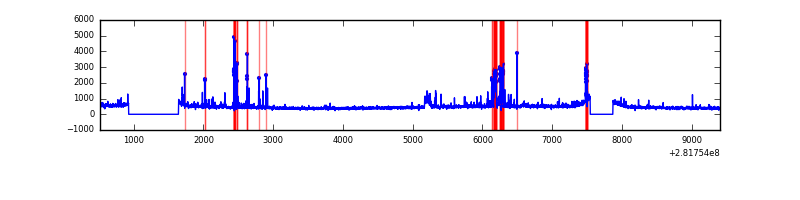 |
Top three noisy pixels from each quadrant. If the there are fewer than three noisy pixels in the level2.evt file, extra rows are filled as -1
| Pixel properties | Quadrant properties | ||||||
|---|---|---|---|---|---|---|---|
| Quadrant | DetID | PixID | Counts | Sigma | Mean | Median | Sigma |
| A | 0 | 23 | 52789 | 263.08 | 960 | 939 | 197.1 |
| A | 0 | 226 | 11422 | 53.19 | 960 | 939 | 197.1 |
| A | 3 | 254 | 7846 | 35.05 | 960 | 939 | 197.1 |
| B | 7 | 220 | 165478 | 875.33 | 965 | 940 | 188.0 |
| B | 15 | 35 | 65483 | 343.36 | 965 | 940 | 188.0 |
| B | 3 | 209 | 48385 | 252.4 | 965 | 940 | 188.0 |
| C | 14 | 238 | 140324 | 638.24 | 924 | 931 | 218.4 |
| C | 3 | 233 | 40295 | 180.24 | 924 | 931 | 218.4 |
| C | 1 | 16 | 29553 | 131.05 | 924 | 931 | 218.4 |
| D | 15 | 0 | 177127 | 772.41 | 925 | 898 | 228.2 |
| D | 10 | 70 | 148134 | 645.34 | 925 | 898 | 228.2 |
| D | 13 | 189 | 122085 | 531.16 | 925 | 898 | 228.2 |
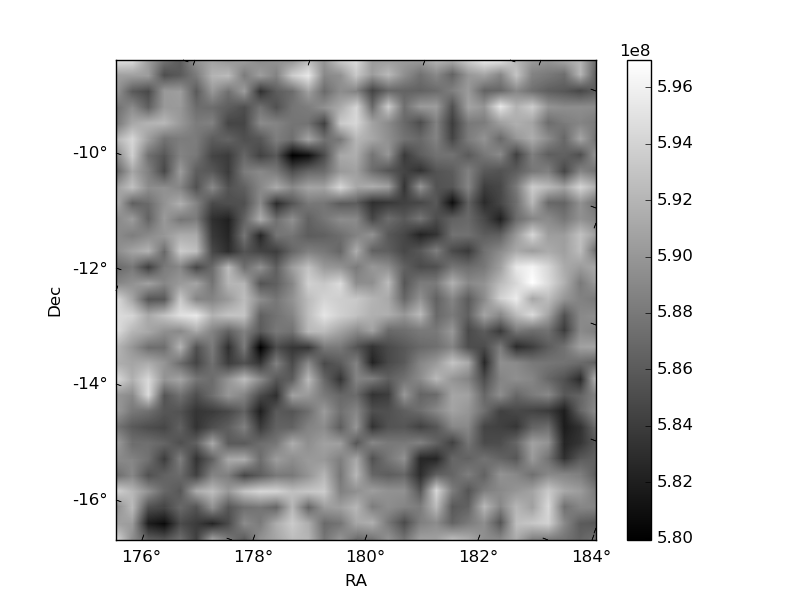
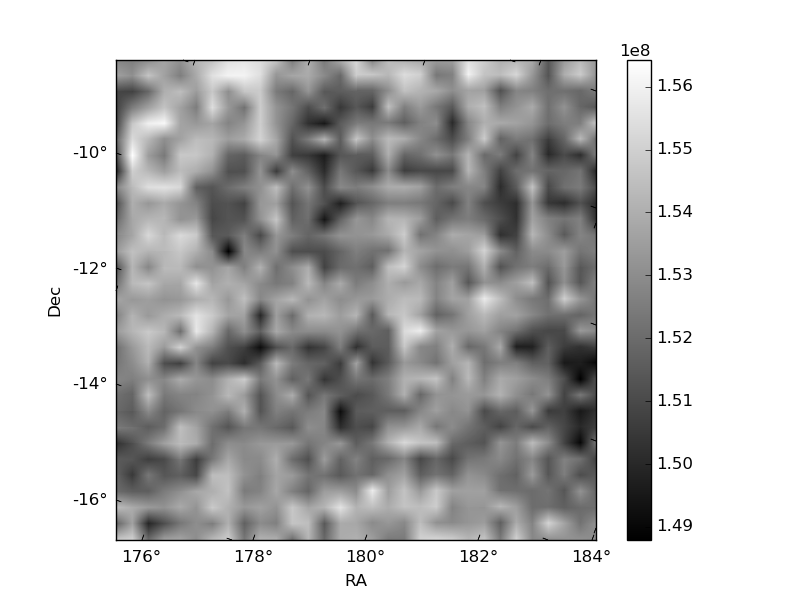
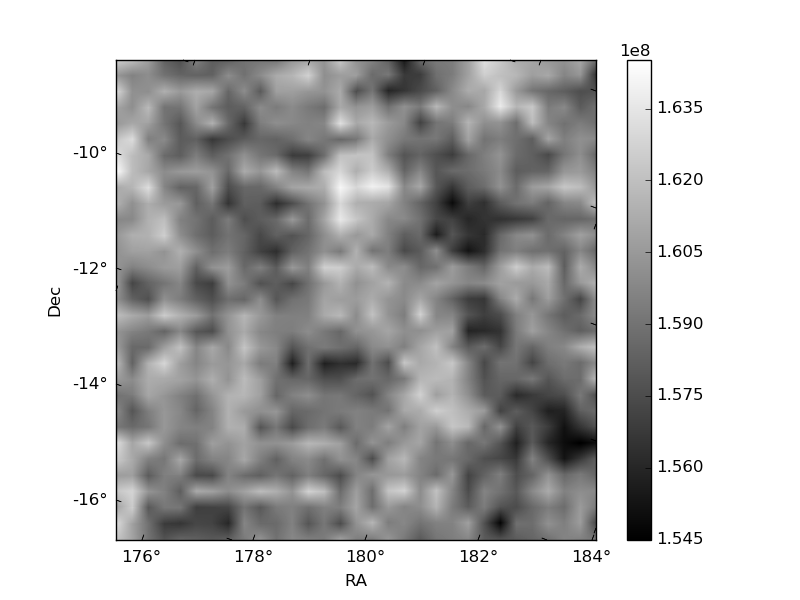
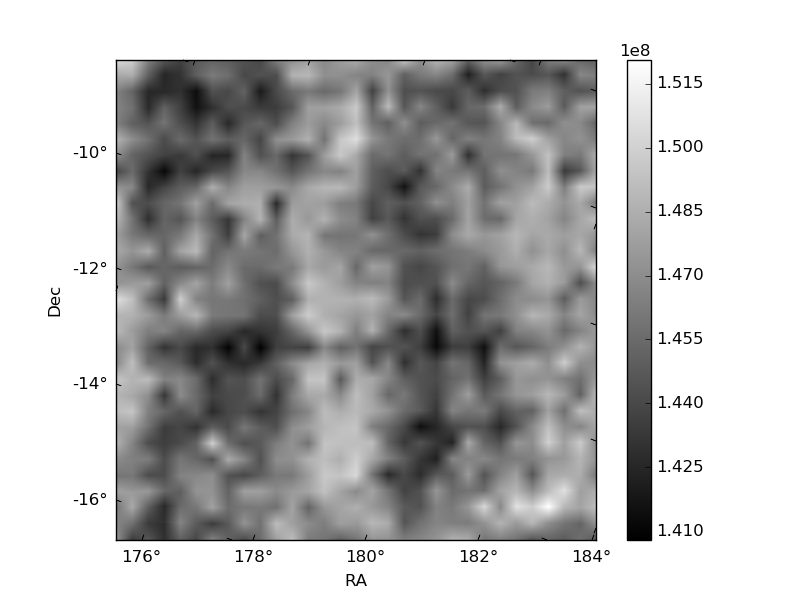
Histogram calculated using DETX and DETY for each event in the final _common_clean file
| Quadrant A | 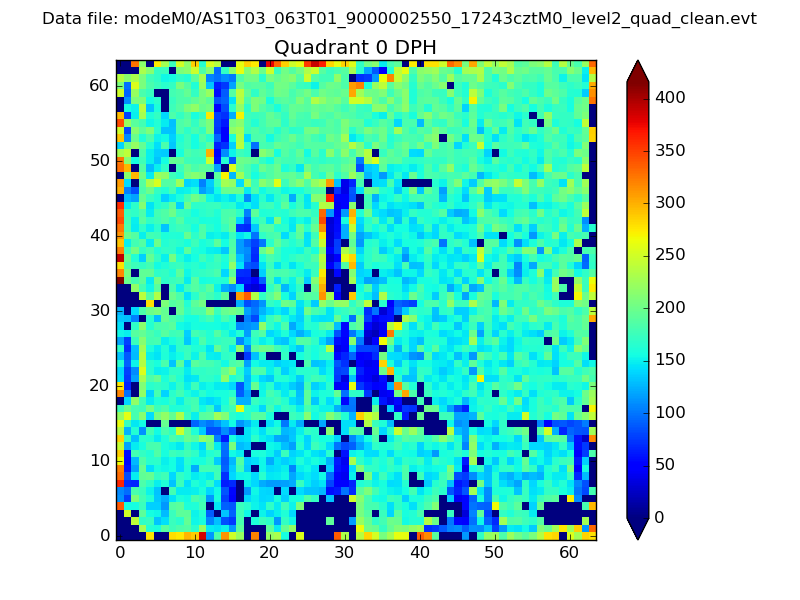 |
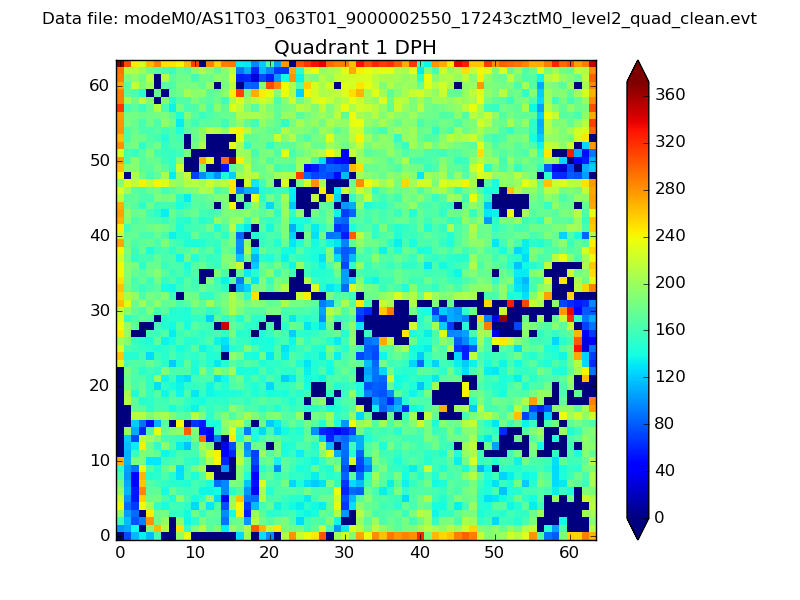 |
Quadrant B |
|---|---|---|---|
| Quadrant D | 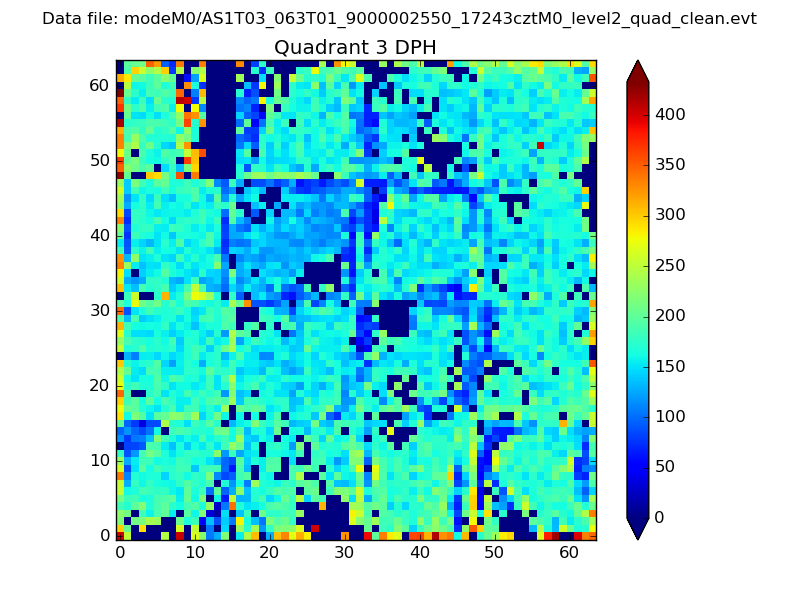 |
 |
Quadrant C |
| Plot type | Count rate plots | Images |
|---|---|---|
| Comparison with Poisson distribution Blue bars denote a histogram of data divided into 1 sec bins. Red curve is a Poisson curve with rate = median count rate of data. |
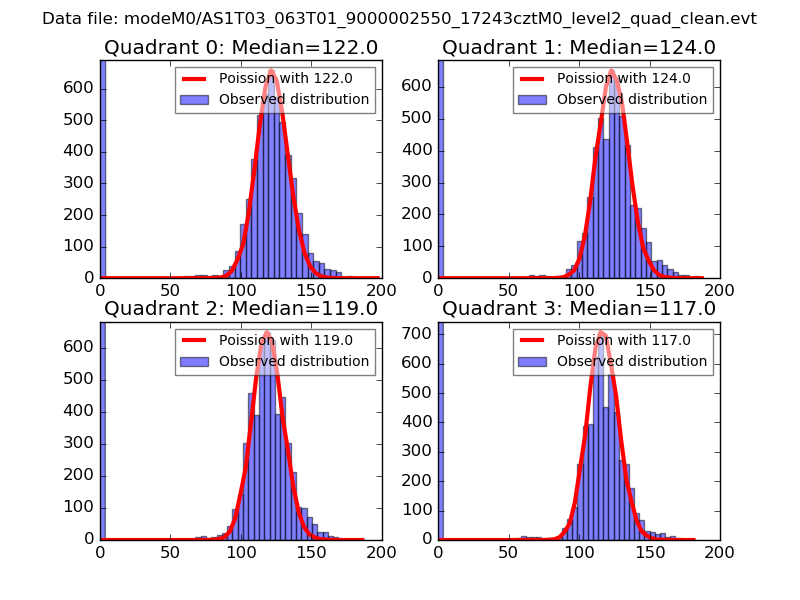 |
 |
| Quadrant-wise count rates Data is divided into 100 sec bins |
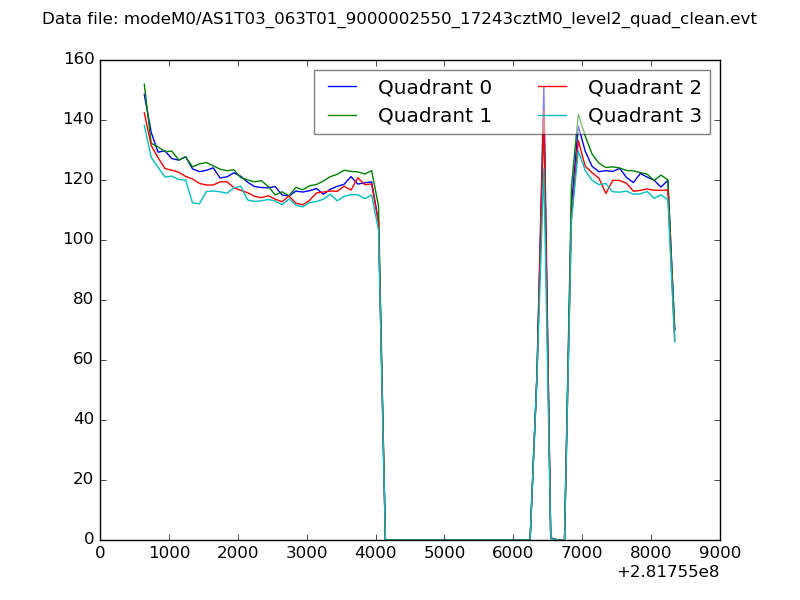 |
|
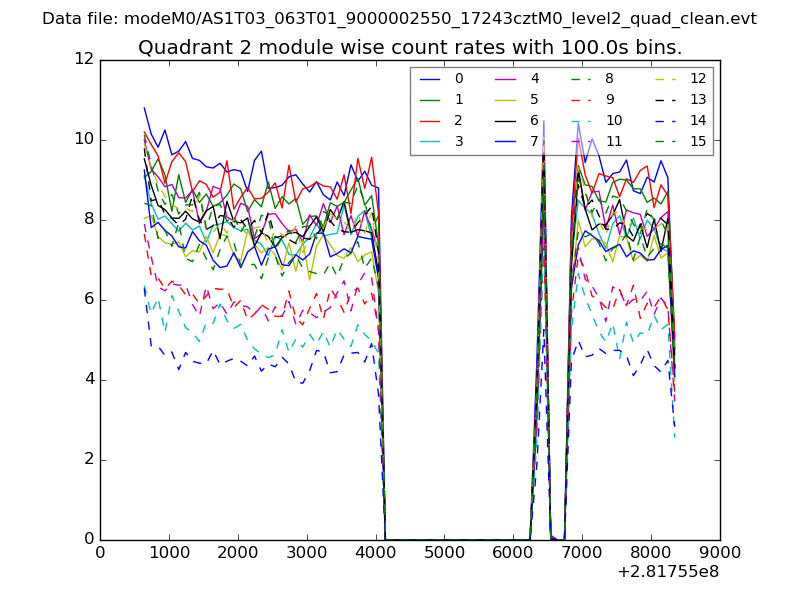
| Module-wise count rates for Quadrant A Data is divided into 100 sec bins |
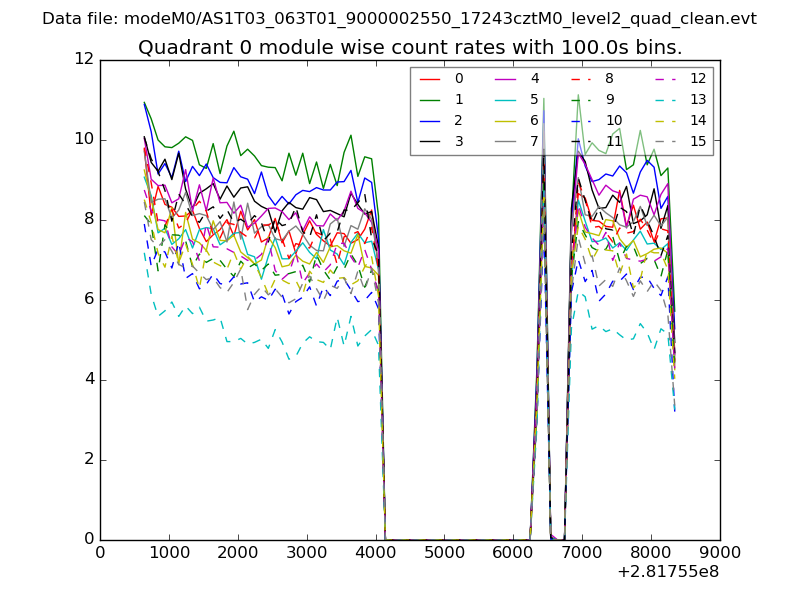 |
 |
| Module-wise count rates for Quadrant B Data is divided into 100 sec bins |
 |
 |
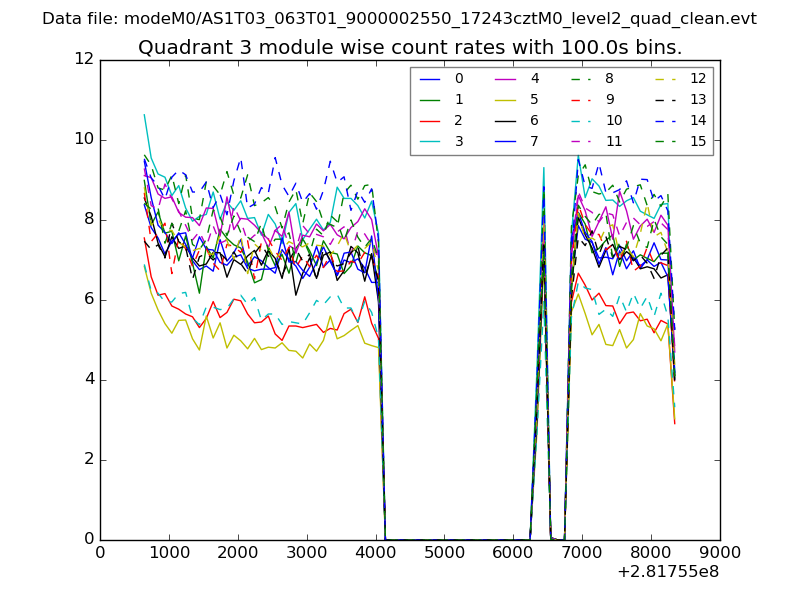
| Module-wise count rates for Quadrant C Data is divided into 100 sec bins |
 |
 |
| Module-wise count rates for Quadrant D Data is divided into 100 sec bins |
 |
 |
| Parameter | Plot |
|---|---|
| CZT HV Monitor | 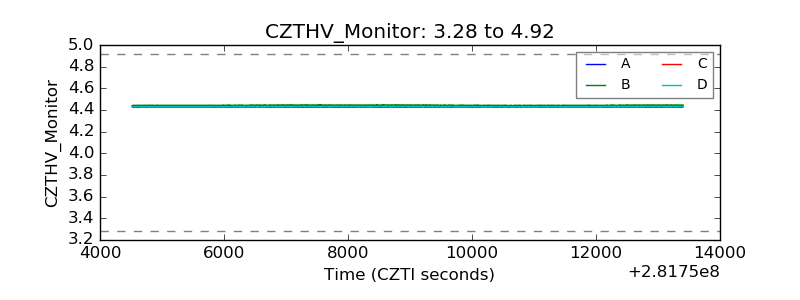 |
| D_VDD | 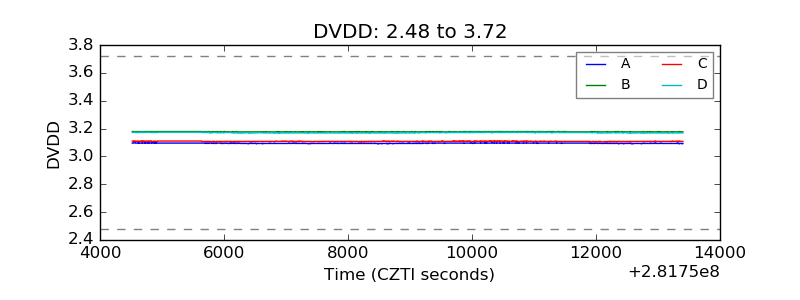 |
| Temperature 1 | 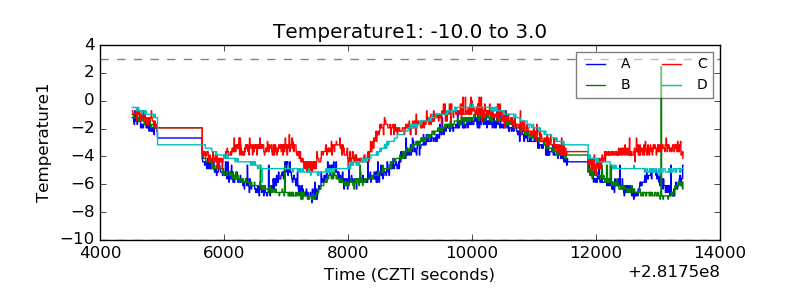 |
| Veto HV Monitor | 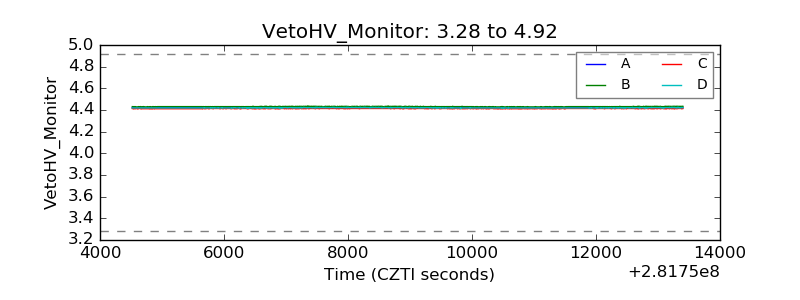 |
| Veto LLD | 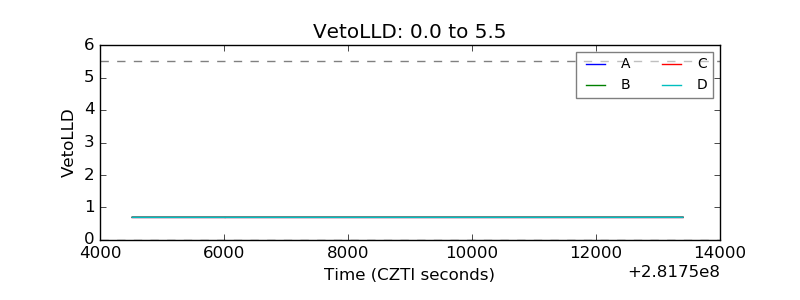 |
| Alpha Counter | 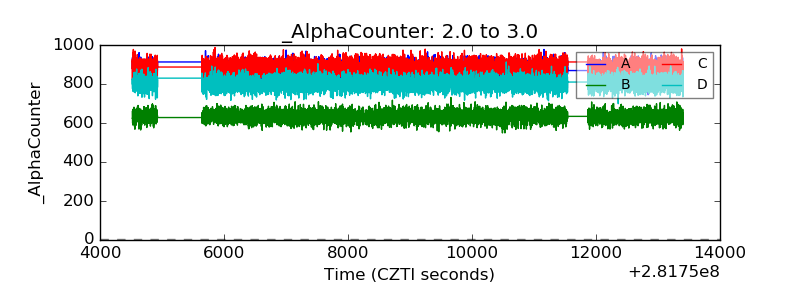 |
| _CPM_Rate | 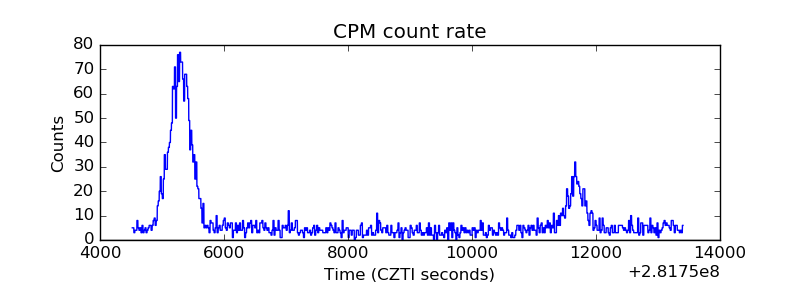 |
| CZT Counter | 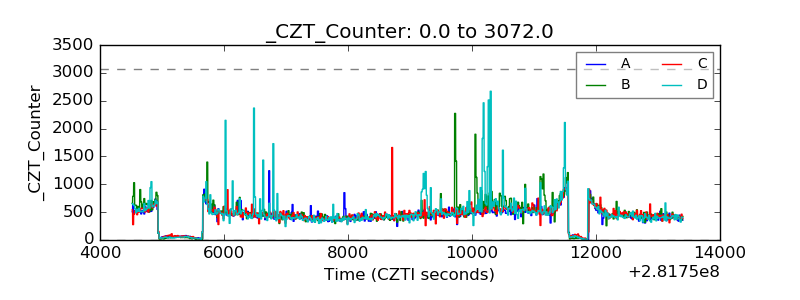 |
| +2.5 Volts monitor | 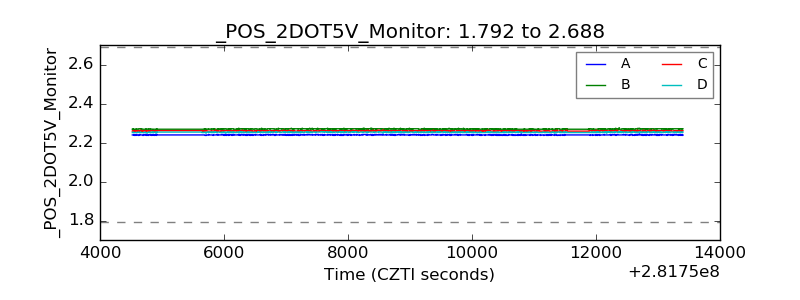 |
| +5 Volts monitor |  |
| _ROLL_ROT | 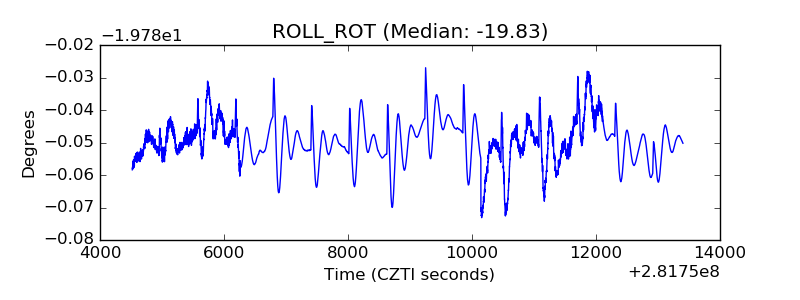 |
| _Roll_DEC | 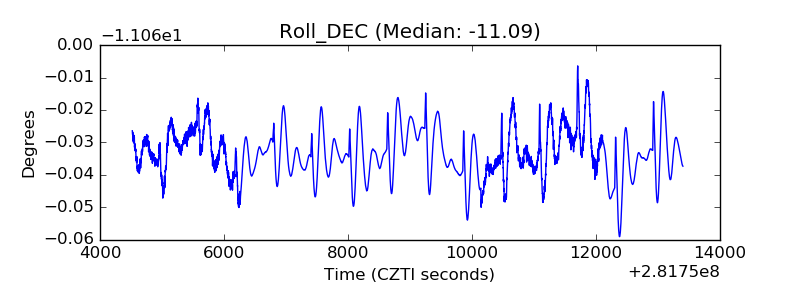 |
| _Roll_RA | 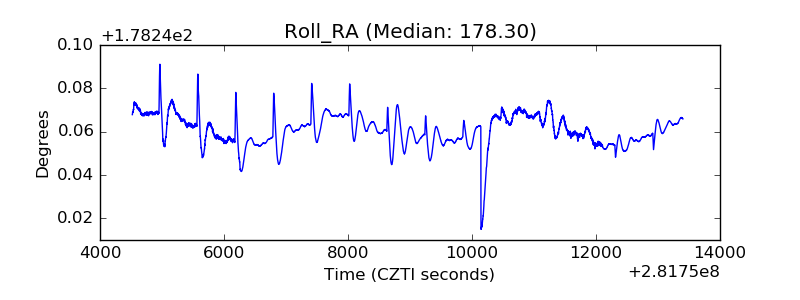 |
| Veto Counter | 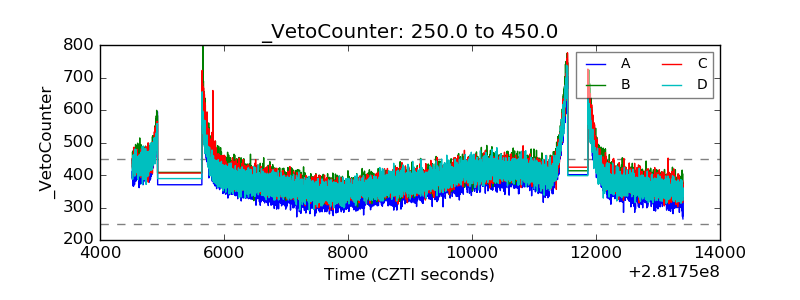 |