| Param | Original file | Final file |
|---|---|---|
| Filename | modeM0/AS1T03_063T01_9000002550_17247cztM0_level2.evt | modeM0/AS1T03_063T01_9000002550_17247cztM0_level2_quad_clean.evt |
| Size (bytes) | 1,126,163,520 | 200,067,840 |
| Size | 1.0 GB | 190.8 MB |
| Events in quadrant A | 7,857,630 | 1,232,838 |
| Events in quadrant B | 8,592,303 | 1,258,284 |
| Events in quadrant C | 8,060,840 | 1,210,946 |
| Events in quadrant D | 8,442,729 | 1,183,128 |
| Mode M9 | |||
|---|---|---|---|
| Quadrant | BADHDUFLAG | Total packets | Discarded packets |
| A | 0 | 11 | 0 |
| B | 0 | 11 | 0 |
| C | 0 | 11 | 0 |
| D | 0 | 11 | 0 |
| Mode SS | |||
|---|---|---|---|
| Quadrant | BADHDUFLAG | Total packets | Discarded packets |
| A | 0 | 346 | 0 |
| B | 0 | 346 | 0 |
| C | 0 | 346 | 0 |
| D | 0 | 346 | 0 |
| Mode M0 | |||
|---|---|---|---|
| Quadrant | BADHDUFLAG | Total packets | Discarded packets |
| A | 0 | 34890 | 3 |
| B | 0 | 36933 | 3 |
| C | 0 | 35003 | 3 |
| D | 0 | 37230 | 3 |
| Quadrant | Total seconds | Saturated seconds | Saturation percentage |
|---|---|---|---|
| A | 17028 | 122 | 0.716467% |
| B | 17029 | 249 | 1.462212% |
| C | 17029 | 216 | 1.268424% |
| D | 17029 | 283 | 1.661871% |
Noise dominated data is calculated using 1-second bins in cleaned event files. If a bin has >2000 counts, and if more than 50% of those come from <1% of pixels, then it is considered to be noise-dominated and hence unusable.
| Quadrant | # 1 sec bins | Bins with >0 counts | Bins with >2000 counts | High rate bins dominated by noise | Noise dominated (total time) | Noise dominated (detector-on time) | Marked lightcurve |
|---|---|---|---|---|---|---|---|
| A | 18118 | 17031 | 0 | 0 | 0.00% | 0.00% | 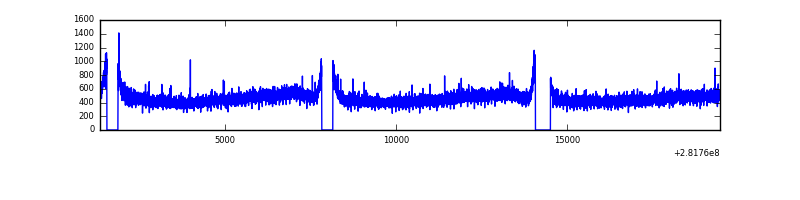 |
| B | 18119 | 17032 | 23 | 23 | 0.13% | 0.14% | 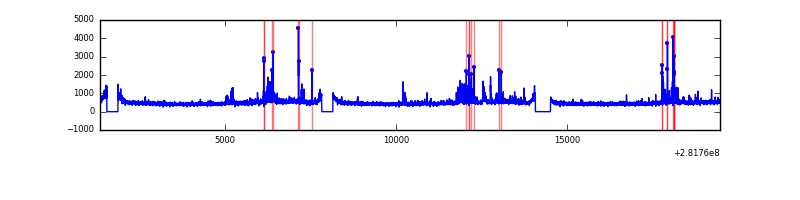 |
| C | 18119 | 17032 | 0 | 0 | 0.00% | 0.00% | 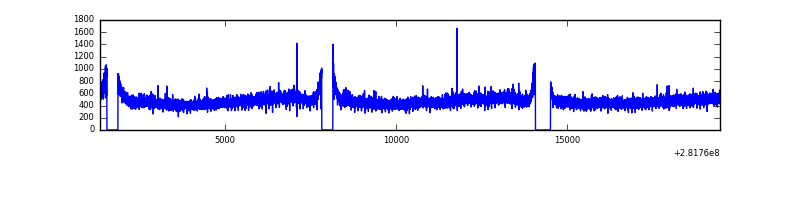 |
| D | 18119 | 17032 | 146 | 146 | 0.81% | 0.86% | 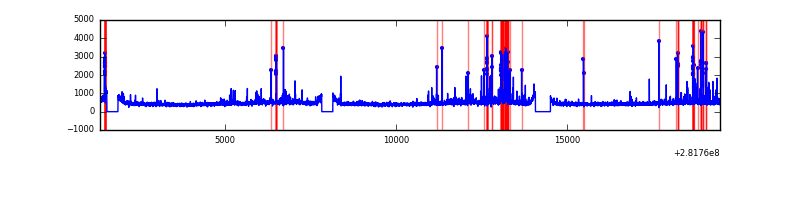 |
Top three noisy pixels from each quadrant. If the there are fewer than three noisy pixels in the level2.evt file, extra rows are filled as -1
| Pixel properties | Quadrant properties | ||||||
|---|---|---|---|---|---|---|---|
| Quadrant | DetID | PixID | Counts | Sigma | Mean | Median | Sigma |
| A | 0 | 226 | 18165 | 38.95 | 2041 | 1994 | 415.2 |
| A | 12 | 194 | 15088 | 31.54 | 2041 | 1994 | 415.2 |
| A | 3 | 137 | 14893 | 31.07 | 2041 | 1994 | 415.2 |
| B | 7 | 220 | 257447 | 648.71 | 2043 | 1986 | 393.8 |
| B | 0 | 197 | 76125 | 188.27 | 2043 | 1986 | 393.8 |
| B | 3 | 209 | 71518 | 176.57 | 2043 | 1986 | 393.8 |
| C | 14 | 238 | 300093 | 643.66 | 1964 | 1979 | 463.2 |
| C | 1 | 16 | 59889 | 125.03 | 1964 | 1979 | 463.2 |
| C | 3 | 233 | 41216 | 84.72 | 1964 | 1979 | 463.2 |
| D | 10 | 70 | 384762 | 789.53 | 1985 | 1925 | 484.9 |
| D | 13 | 189 | 358924 | 736.25 | 1985 | 1925 | 484.9 |
| D | 2 | 234 | 82926 | 167.05 | 1985 | 1925 | 484.9 |
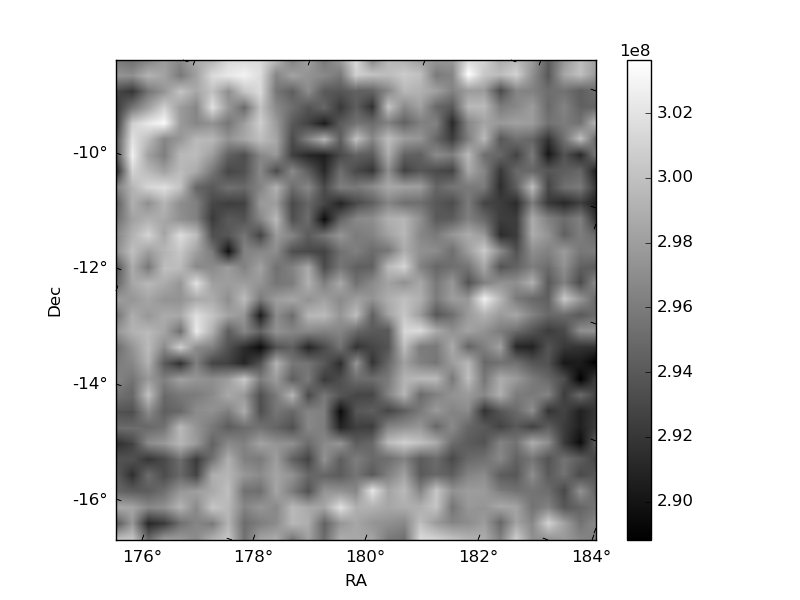
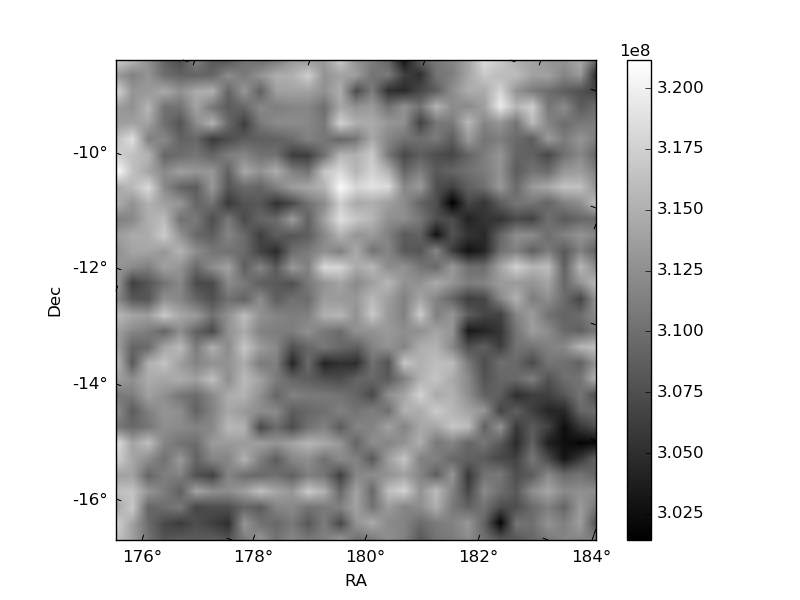
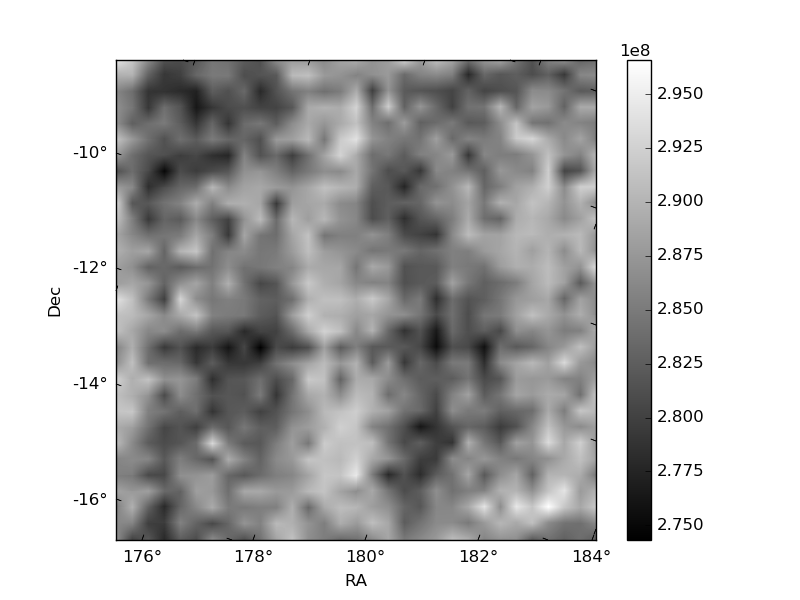
Histogram calculated using DETX and DETY for each event in the final _common_clean file
| Quadrant A |  |
 |
Quadrant B |
|---|---|---|---|
| Quadrant D |  |
 |
Quadrant C |
| Plot type | Count rate plots | Images |
|---|---|---|
| Comparison with Poisson distribution Blue bars denote a histogram of data divided into 1 sec bins. Red curve is a Poisson curve with rate = median count rate of data. |
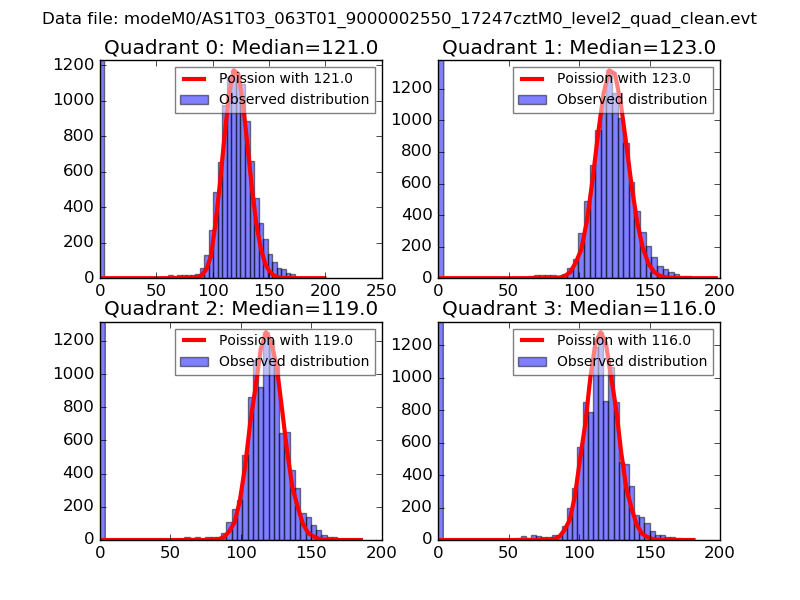 |
 |
| Quadrant-wise count rates Data is divided into 100 sec bins |
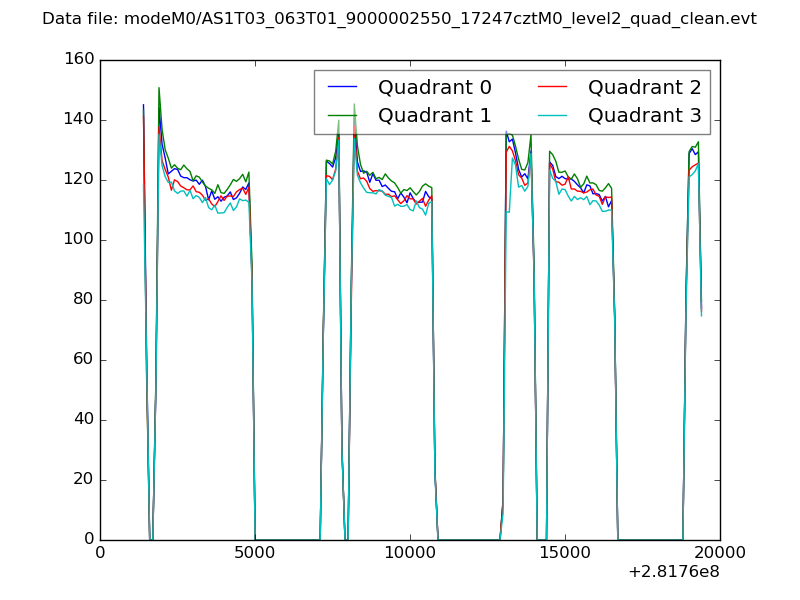 |
|
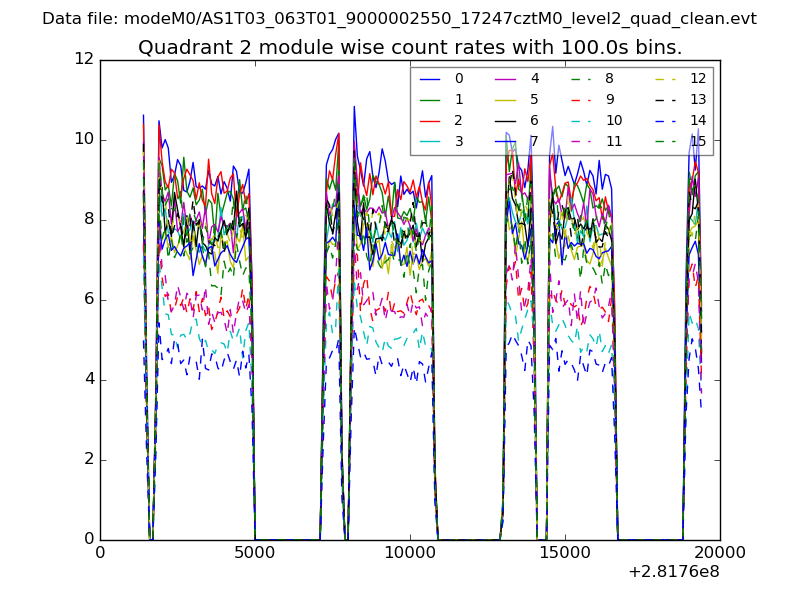
| Module-wise count rates for Quadrant A Data is divided into 100 sec bins |
 |
 |
| Module-wise count rates for Quadrant B Data is divided into 100 sec bins |
 |
 |
| Module-wise count rates for Quadrant C Data is divided into 100 sec bins |
 |
 |
| Module-wise count rates for Quadrant D Data is divided into 100 sec bins |
 |
 |
| Parameter | Plot |
|---|---|
| CZT HV Monitor |  |
| D_VDD |  |
| Temperature 1 |  |
| Veto HV Monitor |  |
| Veto LLD |  |
| Alpha Counter | 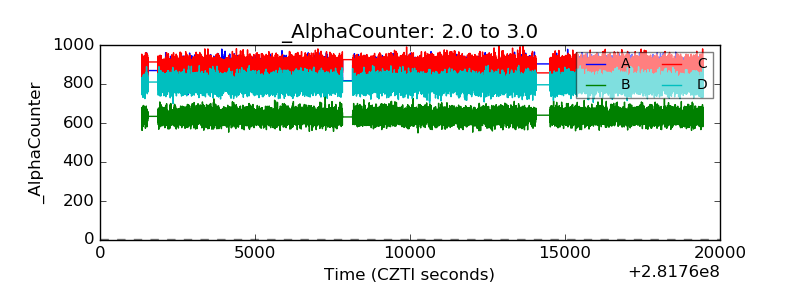 |
| _CPM_Rate | 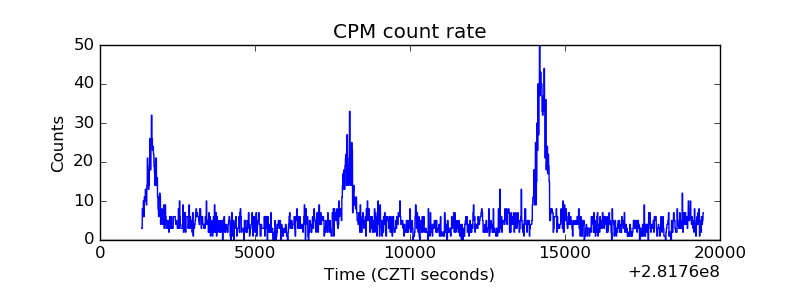 |
| CZT Counter |  |
| +2.5 Volts monitor |  |
| +5 Volts monitor |  |
| _ROLL_ROT |  |
| _Roll_DEC |  |
| _Roll_RA |  |
| Veto Counter |  |