| Param | Original file | Final file |
|---|---|---|
| Filename | modeM0/AS1A05_185T04_9000002552cztM0_level2.fits | modeM0/AS1A05_185T04_9000002552cztM0_level2_quad_clean.evt |
| Size (bytes) | 511,136,640 | 425,108,160 |
| Size | 487.5 MB | 405.4 MB |
| Events in quadrant A | 3,159,326 | 2,447,875 |
| Events in quadrant B | 3,004,404 | 2,403,837 |
| Events in quadrant C | 3,025,724 | 2,267,845 |
| Events in quadrant D | 2,676,214 | 2,138,995 |
| Mode M9 | |||
|---|---|---|---|
| Quadrant | BADHDUFLAG | Total packets | Discarded packets |
| A | 0 | 94 | 0 |
| B | 0 | 94 | 0 |
| C | 0 | 94 | 0 |
| D | 0 | 94 | 0 |
| Mode SS | |||
|---|---|---|---|
| Quadrant | BADHDUFLAG | Total packets | Discarded packets |
| A | 0 | 1068 | 0 |
| B | 0 | 1068 | 0 |
| C | 0 | 1068 | 0 |
| D | 0 | 1068 | 0 |
| Mode M0 | |||
|---|---|---|---|
| Quadrant | BADHDUFLAG | Total packets | Discarded packets |
| A | 0 | 109421 | 0 |
| B | 0 | 111114 | 0 |
| C | 0 | 108689 | 0 |
| D | 0 | 115461 | 0 |
| Quadrant | Total seconds | Saturated seconds | Saturation percentage |
|---|---|---|---|
| A | 52693 | 381 | 0.723056% |
| B | 52693 | 513 | 0.973564% |
| C | 52693 | 584 | 1.108307% |
| D | 52692 | 813 | 1.542929% |
Noise dominated data is calculated using 1-second bins in cleaned event files. If a bin has >2000 counts, and if more than 50% of those come from <1% of pixels, then it is considered to be noise-dominated and hence unusable.
| Quadrant | # 1 sec bins | Bins with >0 counts | Bins with >2000 counts | High rate bins dominated by noise | Noise dominated (total time) | Noise dominated (detector-on time) | Marked lightcurve |
|---|---|---|---|---|---|---|---|
| A | 67247 | 52692 | 0 | 0 | 0.00% | 0.00% |  |
| B | 67247 | 52692 | 0 | 0 | 0.00% | 0.00% |  |
| C | 67247 | 52694 | 0 | 0 | 0.00% | 0.00% |  |
| D | 67247 | 52678 | 0 | 0 | 0.00% | 0.00% | 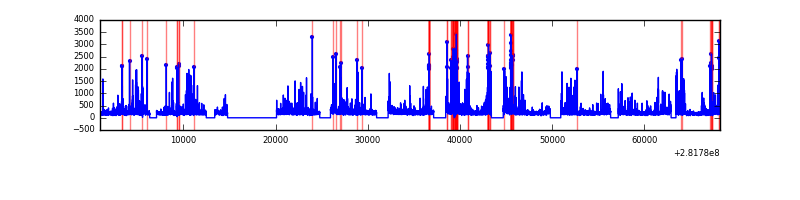 |
Top three noisy pixels from each quadrant. If the there are fewer than three noisy pixels in the level2.evt file, extra rows are filled as -1
| Pixel properties | Quadrant properties | ||||||
|---|---|---|---|---|---|---|---|
| Quadrant | DetID | PixID | Counts | Sigma | Mean | Median | Sigma |
| A | 0 | 29 | 3120 | 11.29 | 823 | 772 | 207.9 |
| A | 7 | 110 | 2580 | 8.7 | 823 | 772 | 207.9 |
| A | 0 | 30 | 2460 | 8.12 | 823 | 772 | 207.9 |
| B | 2 | 9 | 2394 | 10.46 | 794 | 759 | 156.3 |
| B | 14 | 254 | 2015 | 8.04 | 794 | 759 | 156.3 |
| B | 2 | 8 | 1983 | 7.83 | 794 | 759 | 156.3 |
| C | 2 | 191 | 2108 | 6.6 | 799 | 744 | 206.6 |
| C | 12 | 241 | 2085 | 6.49 | 799 | 744 | 206.6 |
| C | 9 | 233 | 2029 | 6.22 | 799 | 744 | 206.6 |
| D | 6 | 67 | 1944 | 6.16 | 762 | 695 | 202.7 |
| D | 3 | 14 | 1889 | 5.89 | 762 | 695 | 202.7 |
| D | 7 | 3 | 1877 | 5.83 | 762 | 695 | 202.7 |
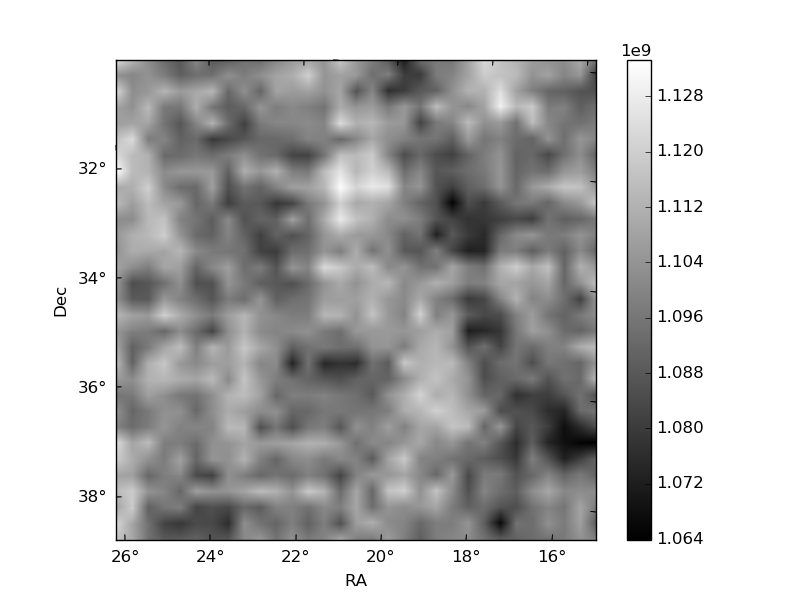
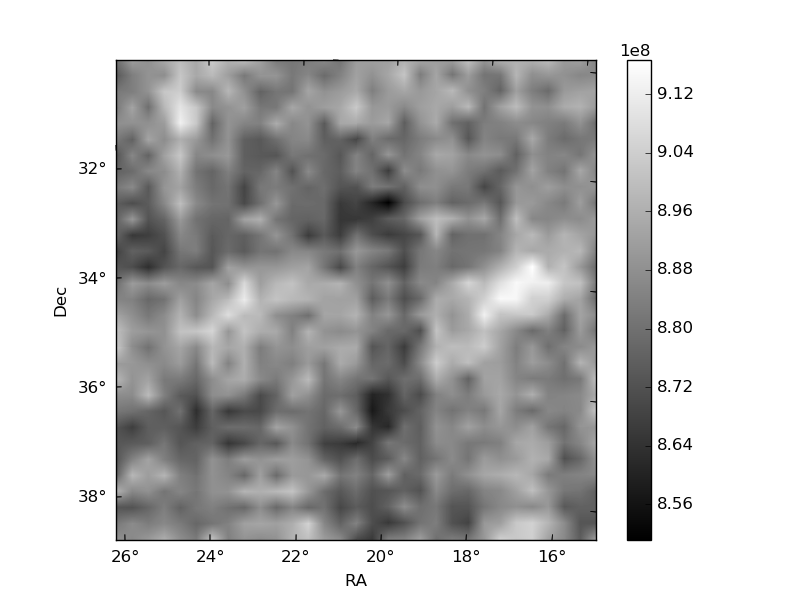
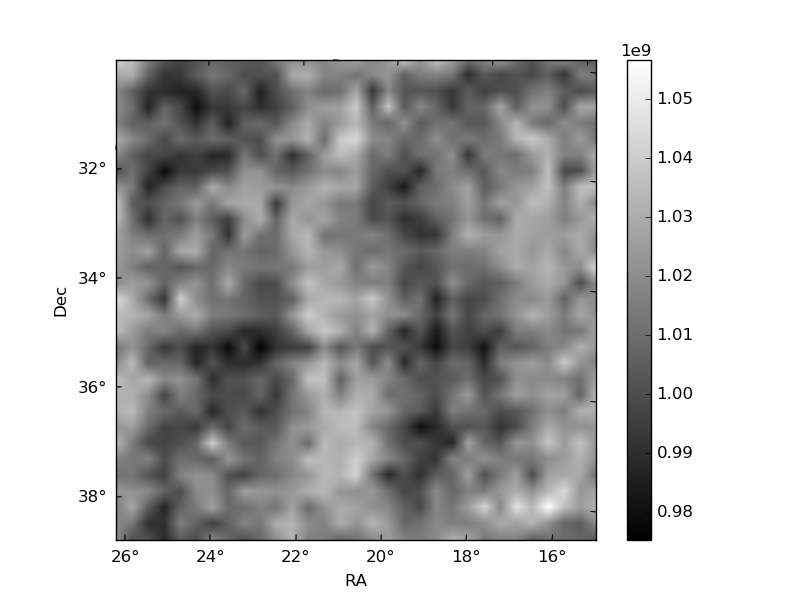
Histogram calculated using DETX and DETY for each event in the final _common_clean file
| Quadrant A | 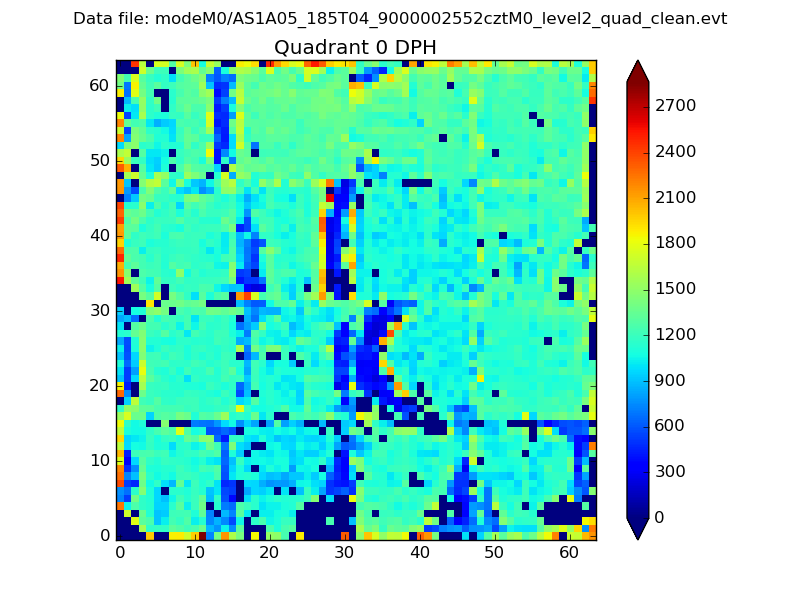 |
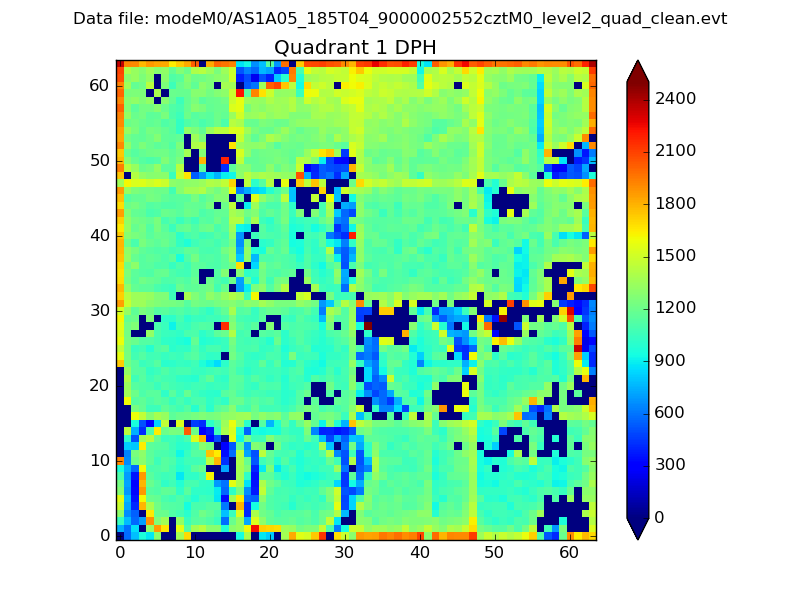 |
Quadrant B |
|---|---|---|---|
| Quadrant D | 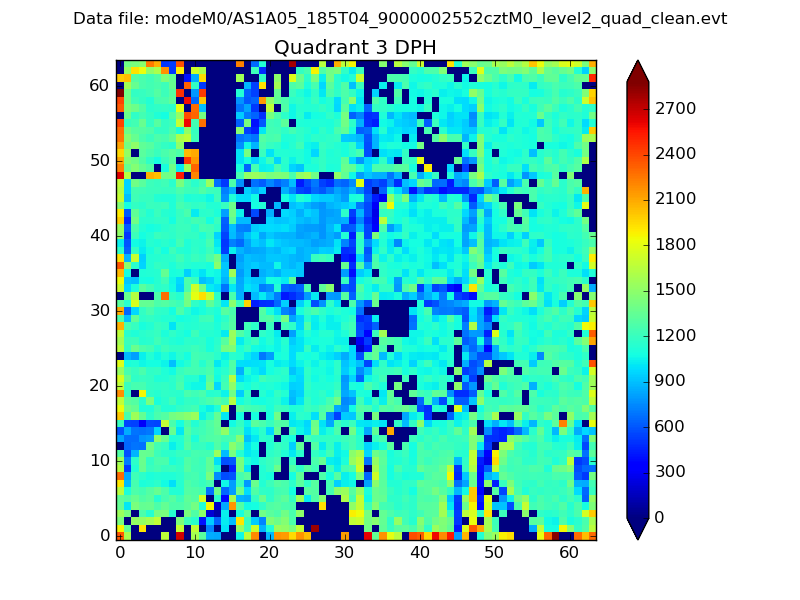 |
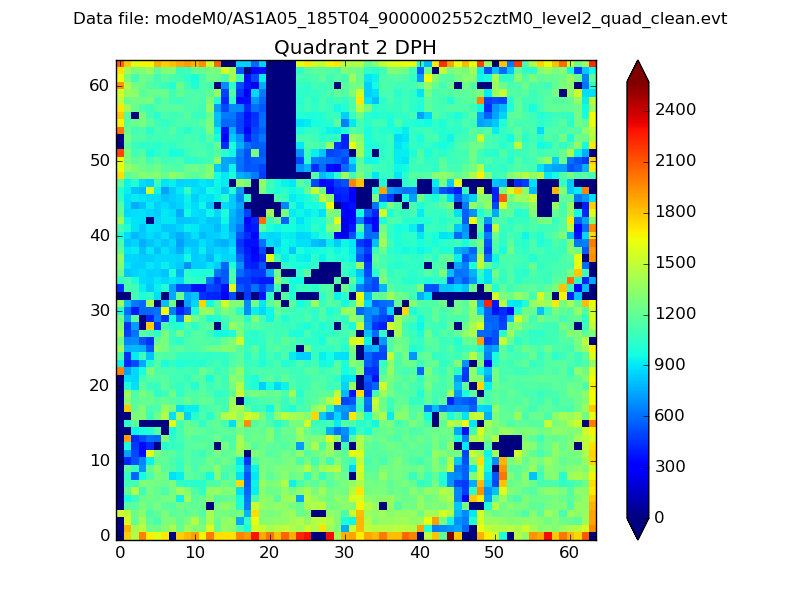 |
Quadrant C |
| Plot type | Count rate plots | Images |
|---|---|---|
| Comparison with Poisson distribution Blue bars denote a histogram of data divided into 1 sec bins. Red curve is a Poisson curve with rate = median count rate of data. |
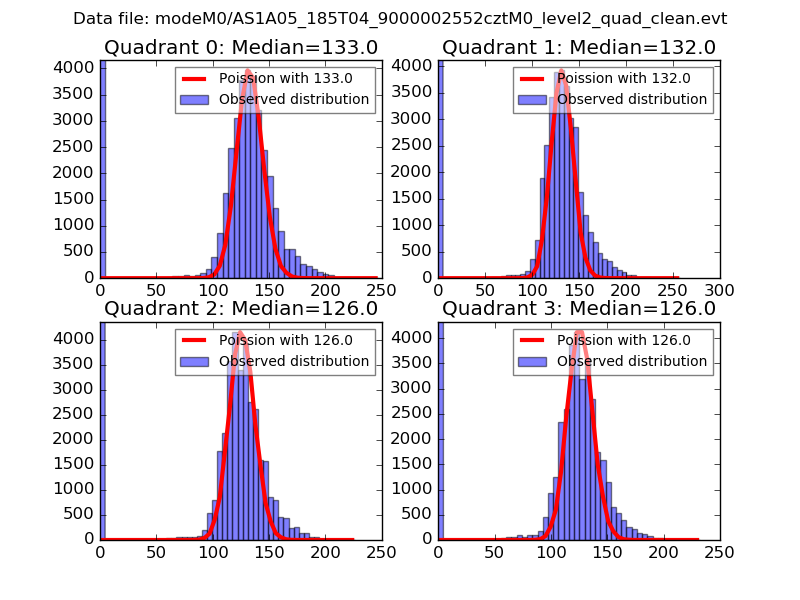 |
 |
| Quadrant-wise count rates Data is divided into 100 sec bins |
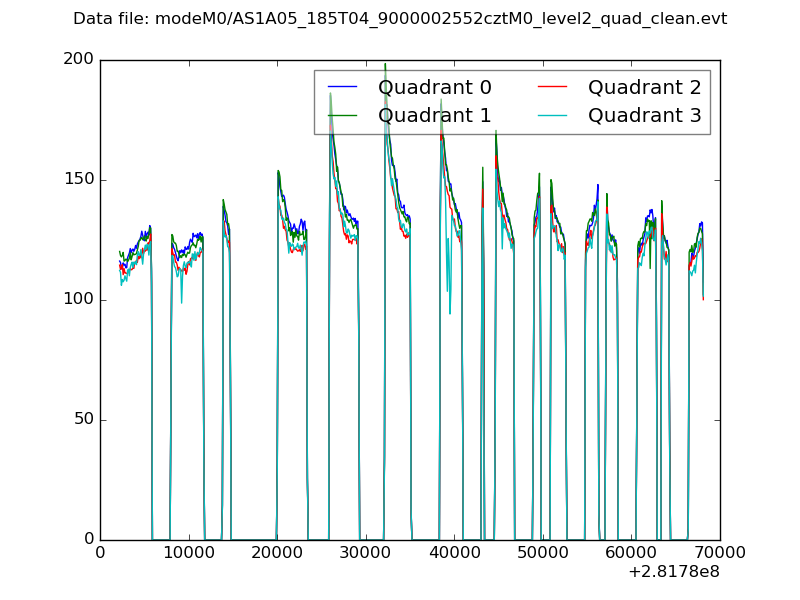 |
|
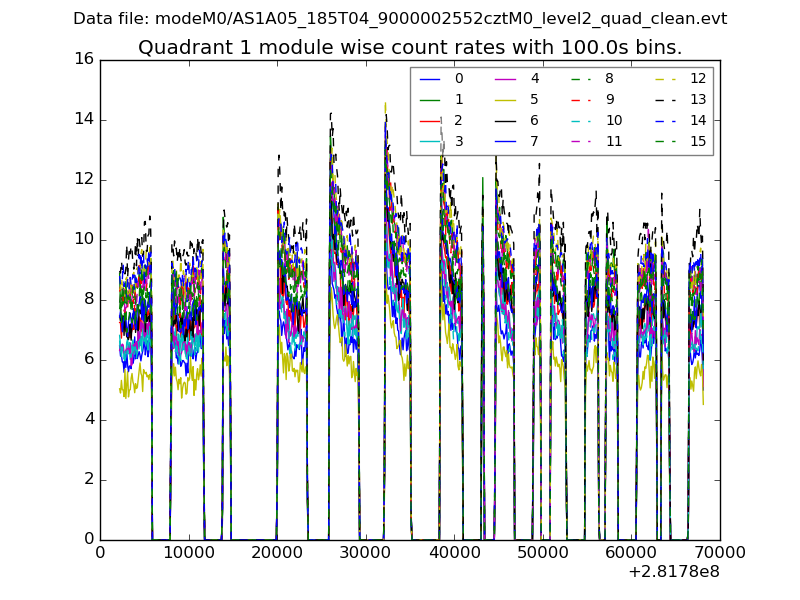
| Module-wise count rates for Quadrant A Data is divided into 100 sec bins |
 |
 |
| Module-wise count rates for Quadrant B Data is divided into 100 sec bins |
 |
 |
| Module-wise count rates for Quadrant C Data is divided into 100 sec bins |
 |
 |
| Module-wise count rates for Quadrant D Data is divided into 100 sec bins |
 |
 |
| Parameter | Plot |
|---|---|
| CZT HV Monitor | 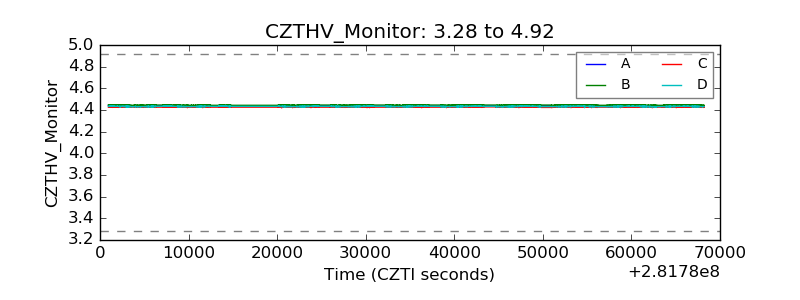 |
| D_VDD | 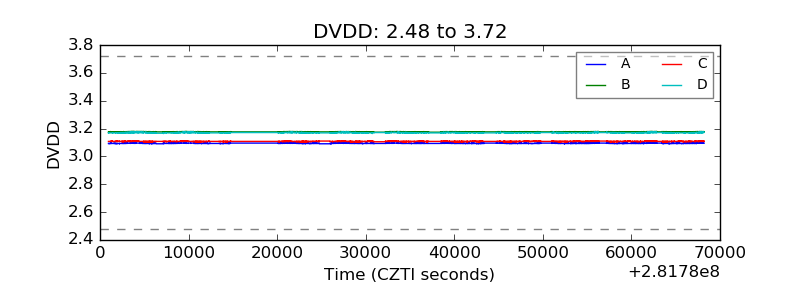 |
| Temperature 1 |  |
| Veto HV Monitor |  |
| Veto LLD | 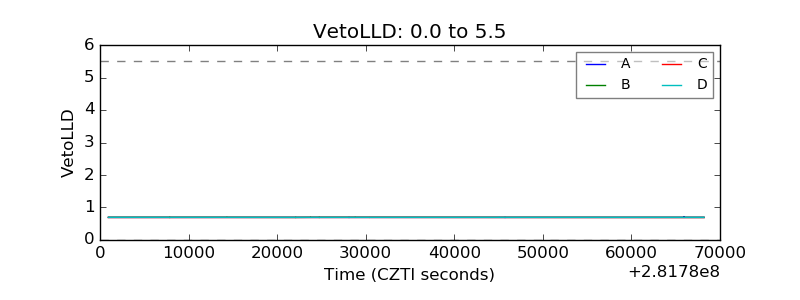 |
| Alpha Counter | 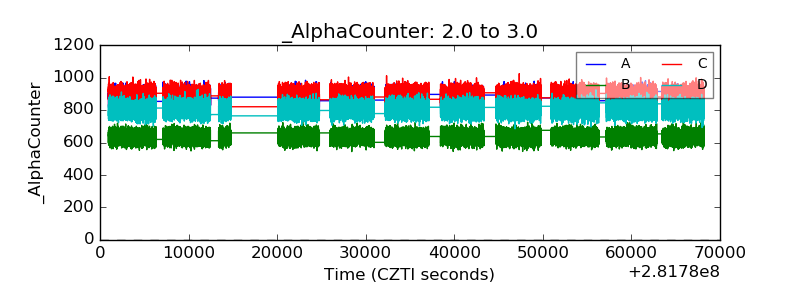 |
| _CPM_Rate | 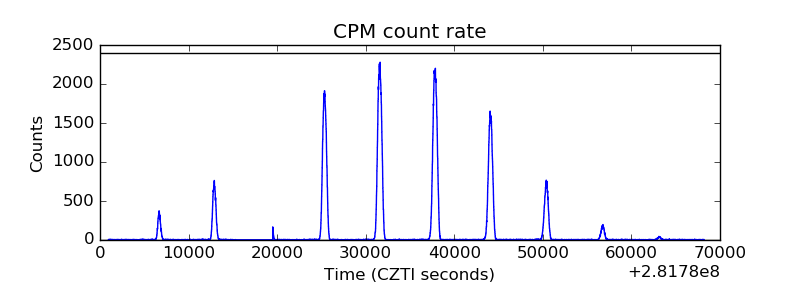 |
| CZT Counter | 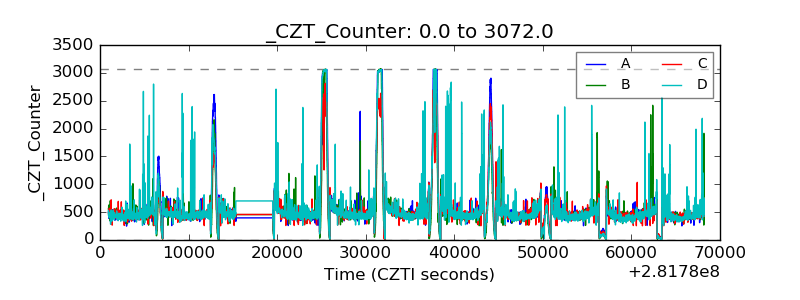 |
| +2.5 Volts monitor |  |
| +5 Volts monitor |  |
| _ROLL_ROT | 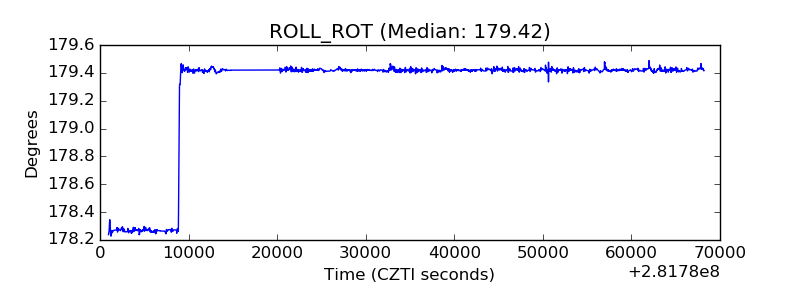 |
| _Roll_DEC | 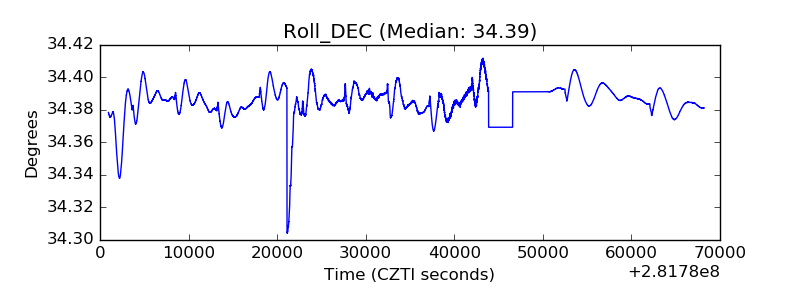 |
| _Roll_RA | 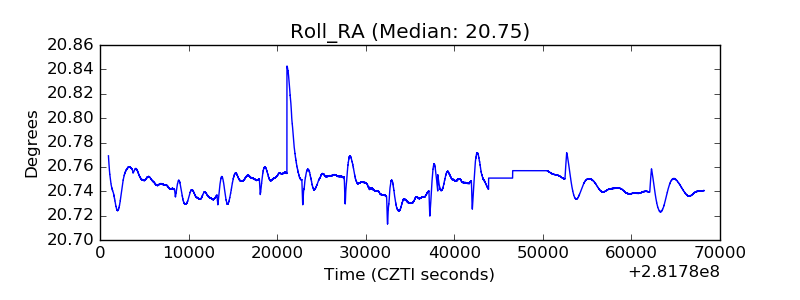 |
| Veto Counter |  |