| Param | Original file | Final file |
|---|---|---|
| Filename | modeM0/AS1A05_185T04_9000002552_17251cztM0_level2.evt | modeM0/AS1A05_185T04_9000002552_17251cztM0_level2_quad_clean.evt |
| Size (bytes) | 412,583,040 | 100,526,400 |
| Size | 393.5 MB | 95.9 MB |
| Events in quadrant A | 2,999,192 | 677,573 |
| Events in quadrant B | 3,046,291 | 673,954 |
| Events in quadrant C | 2,958,153 | 632,929 |
| Events in quadrant D | 3,078,480 | 636,109 |
| Mode M9 | |||
|---|---|---|---|
| Quadrant | BADHDUFLAG | Total packets | Discarded packets |
| A | 0 | 12 | 0 |
| B | 0 | 12 | 0 |
| C | 0 | 12 | 0 |
| D | 0 | 12 | 0 |
| Mode SS | |||
|---|---|---|---|
| Quadrant | BADHDUFLAG | Total packets | Discarded packets |
| A | 0 | 122 | 0 |
| B | 0 | 122 | 0 |
| C | 0 | 122 | 0 |
| D | 0 | 122 | 0 |
| Mode M0 | |||
|---|---|---|---|
| Quadrant | BADHDUFLAG | Total packets | Discarded packets |
| A | 0 | 12976 | 1 |
| B | 0 | 12904 | 1 |
| C | 0 | 12627 | 1 |
| D | 0 | 13187 | 1 |
| Quadrant | Total seconds | Saturated seconds | Saturation percentage |
|---|---|---|---|
| A | 6077 | 52 | 0.855685% |
| B | 6077 | 48 | 0.789863% |
| C | 6077 | 64 | 1.053151% |
| D | 6077 | 69 | 1.135429% |
Noise dominated data is calculated using 1-second bins in cleaned event files. If a bin has >2000 counts, and if more than 50% of those come from <1% of pixels, then it is considered to be noise-dominated and hence unusable.
| Quadrant | # 1 sec bins | Bins with >0 counts | Bins with >2000 counts | High rate bins dominated by noise | Noise dominated (total time) | Noise dominated (detector-on time) | Marked lightcurve |
|---|---|---|---|---|---|---|---|
| A | 7257 | 6078 | 2 | 2 | 0.03% | 0.03% | 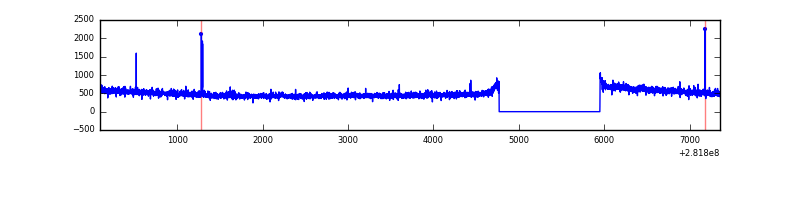 |
| B | 7257 | 6078 | 5 | 5 | 0.07% | 0.08% | 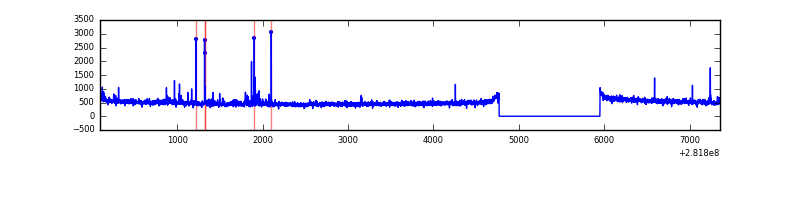 |
| C | 7257 | 6078 | 0 | 0 | 0.00% | 0.00% | 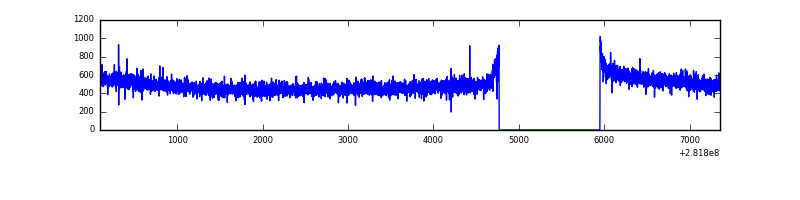 |
| D | 7257 | 6078 | 18 | 18 | 0.25% | 0.30% | 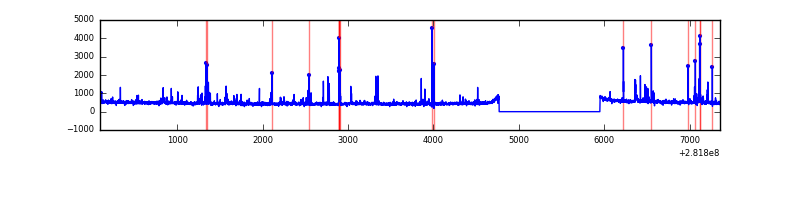 |
Top three noisy pixels from each quadrant. If the there are fewer than three noisy pixels in the level2.evt file, extra rows are filled as -1
| Pixel properties | Quadrant properties | ||||||
|---|---|---|---|---|---|---|---|
| Quadrant | DetID | PixID | Counts | Sigma | Mean | Median | Sigma |
| A | 0 | 23 | 36048 | 229.92 | 766 | 752 | 153.5 |
| A | 15 | 174 | 17944 | 111.99 | 766 | 752 | 153.5 |
| A | 0 | 226 | 8939 | 53.33 | 766 | 752 | 153.5 |
| B | 0 | 197 | 39411 | 270.35 | 754 | 737 | 143.1 |
| B | 12 | 16 | 19044 | 127.98 | 754 | 737 | 143.1 |
| B | 0 | 189 | 16928 | 113.18 | 754 | 737 | 143.1 |
| C | 14 | 238 | 112520 | 673.87 | 720 | 727 | 165.9 |
| C | 3 | 233 | 33168 | 195.55 | 720 | 727 | 165.9 |
| C | 13 | 61 | 5046 | 26.03 | 720 | 727 | 165.9 |
| D | 13 | 189 | 129512 | 714.99 | 742 | 722 | 180.1 |
| D | 10 | 70 | 59897 | 328.52 | 742 | 722 | 180.1 |
| D | 7 | 38 | 47425 | 259.28 | 742 | 722 | 180.1 |
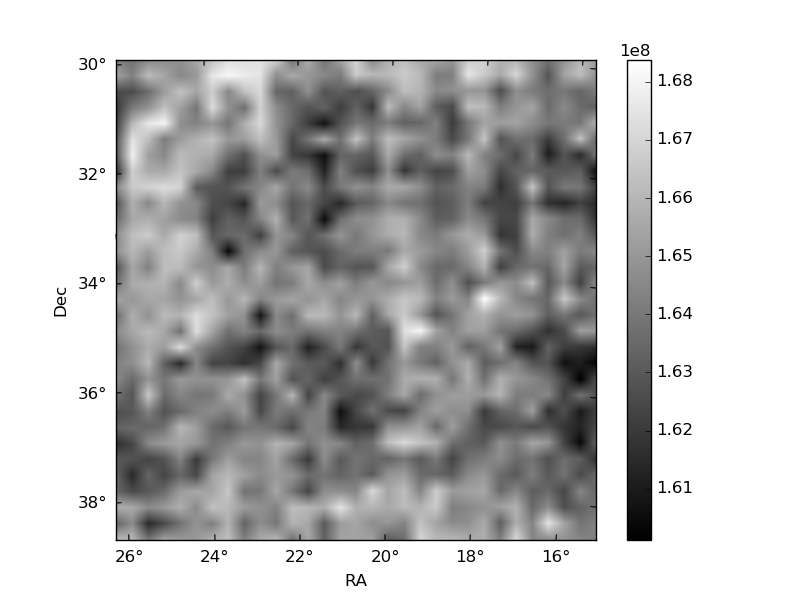
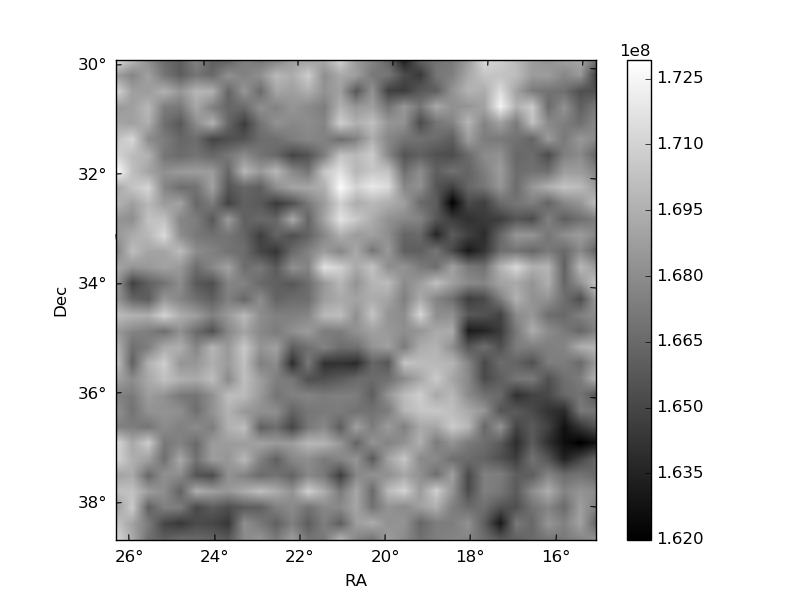
Histogram calculated using DETX and DETY for each event in the final _common_clean file
| Quadrant A | 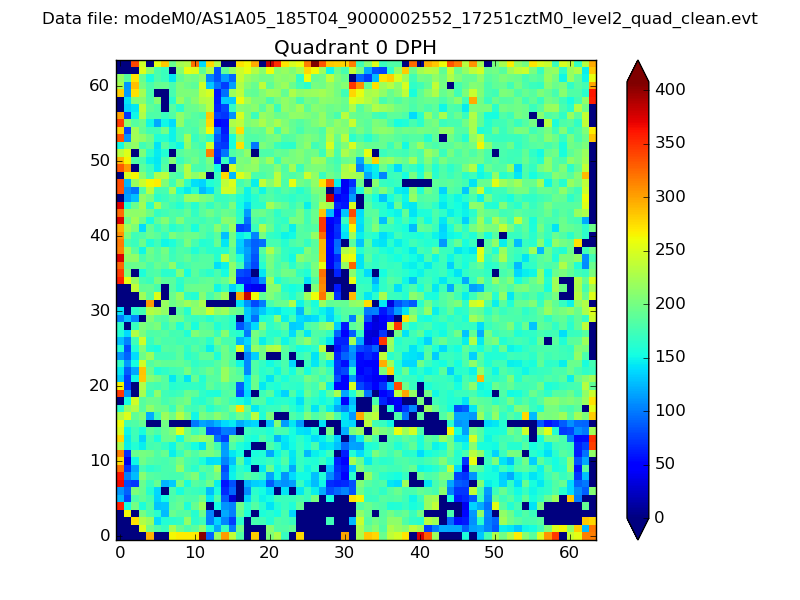 |
 |
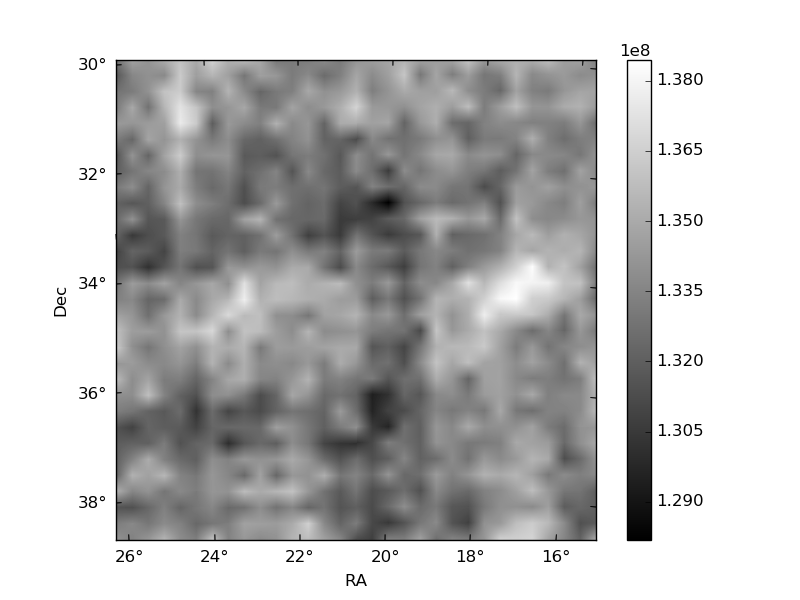
Quadrant B |
|---|---|---|---|
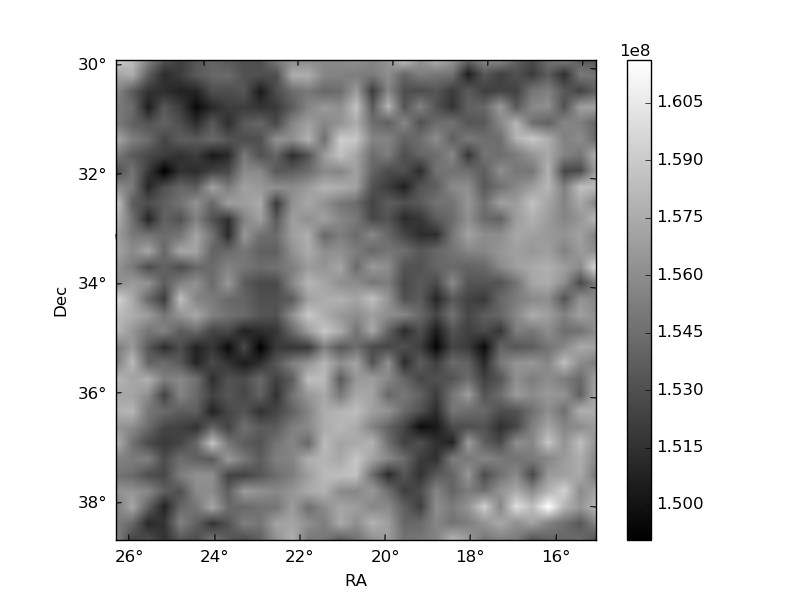
| Quadrant D |  |
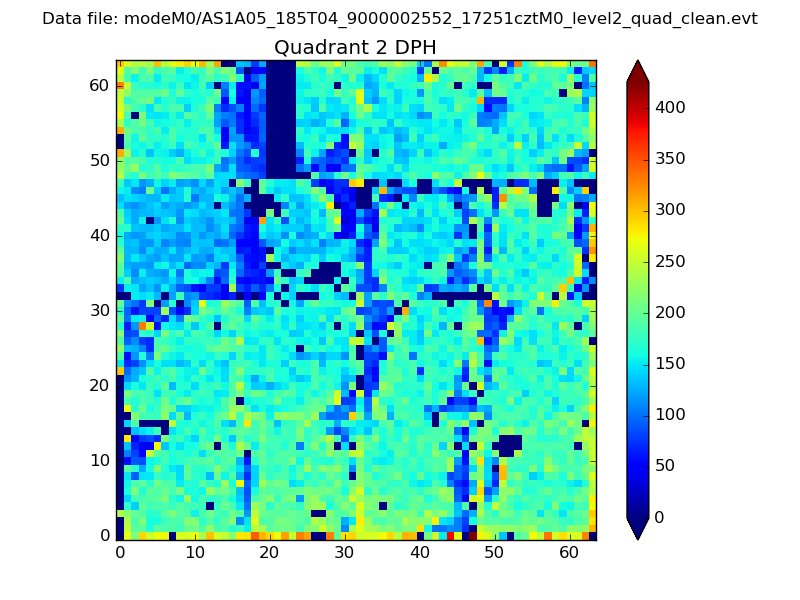 |
Quadrant C |
| Plot type | Count rate plots | Images |
|---|---|---|
| Comparison with Poisson distribution Blue bars denote a histogram of data divided into 1 sec bins. Red curve is a Poisson curve with rate = median count rate of data. |
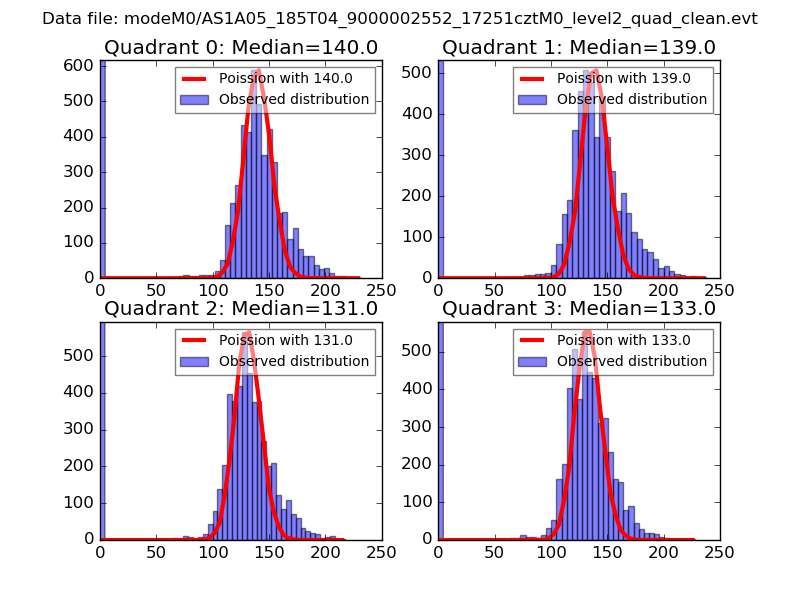 |
 |
| Quadrant-wise count rates Data is divided into 100 sec bins |
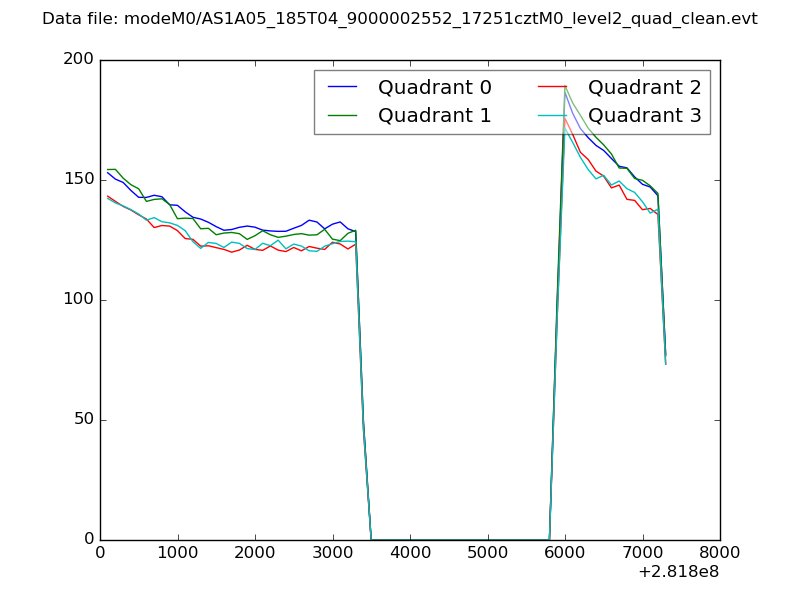 |
|
| Module-wise count rates for Quadrant A Data is divided into 100 sec bins |
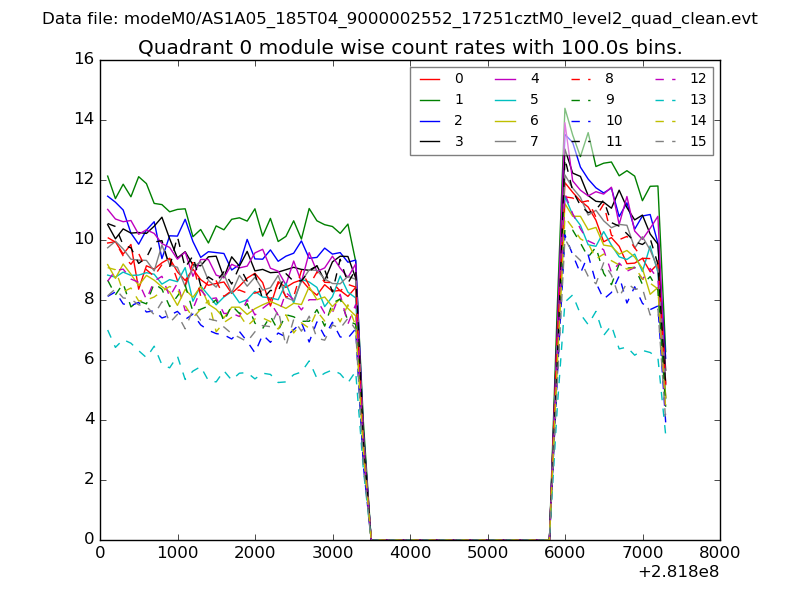 |
 |
| Module-wise count rates for Quadrant B Data is divided into 100 sec bins |
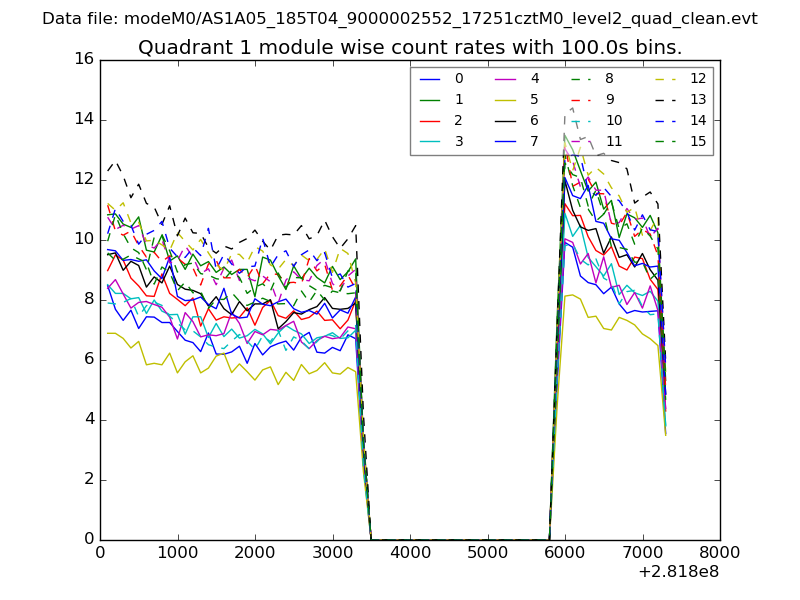 |
 |
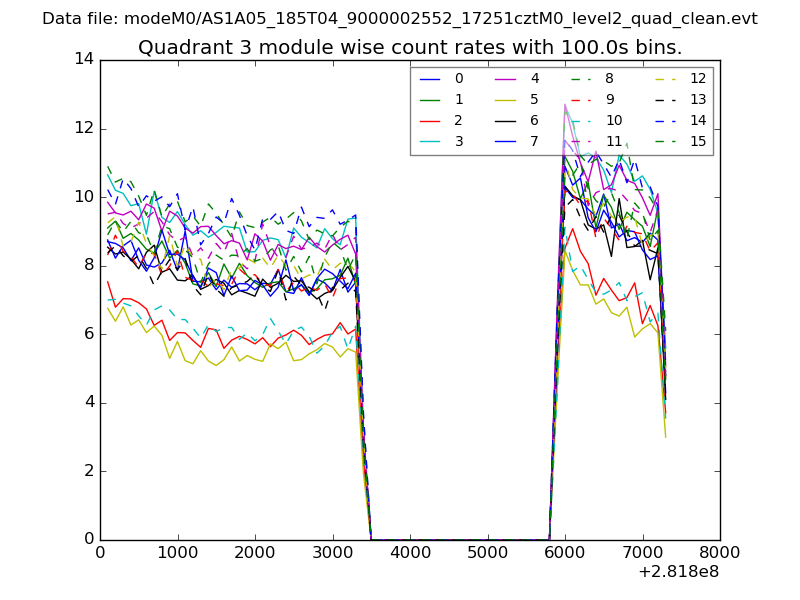
| Module-wise count rates for Quadrant C Data is divided into 100 sec bins |
 |
 |
| Module-wise count rates for Quadrant D Data is divided into 100 sec bins |
 |
 |
| Parameter | Plot |
|---|---|
| CZT HV Monitor |  |
| D_VDD | 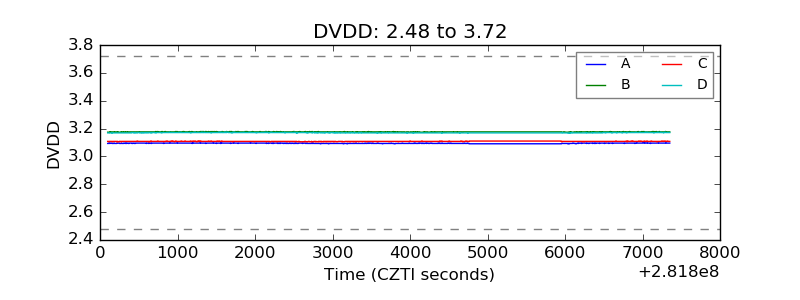 |
| Temperature 1 | 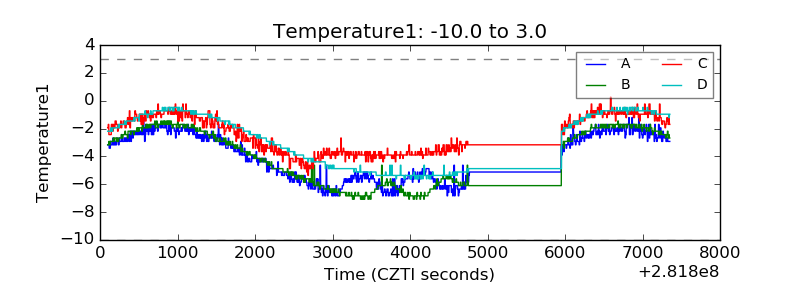 |
| Veto HV Monitor | 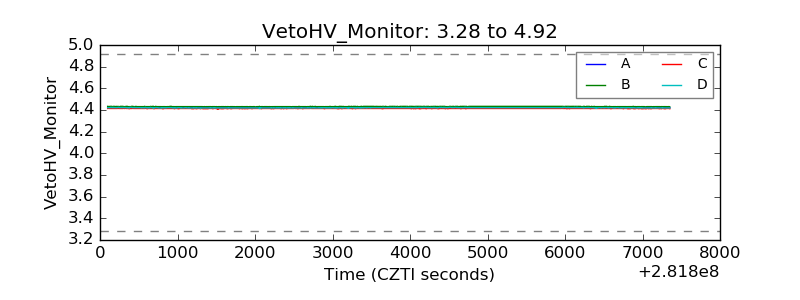 |
| Veto LLD | 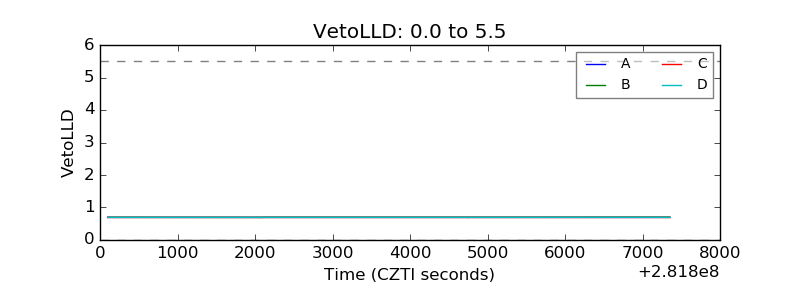 |
| Alpha Counter | 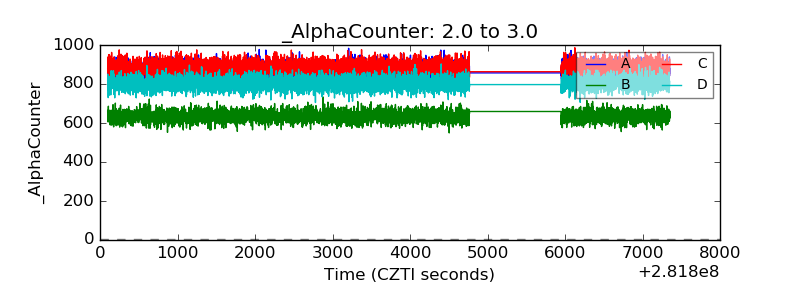 |
| _CPM_Rate | 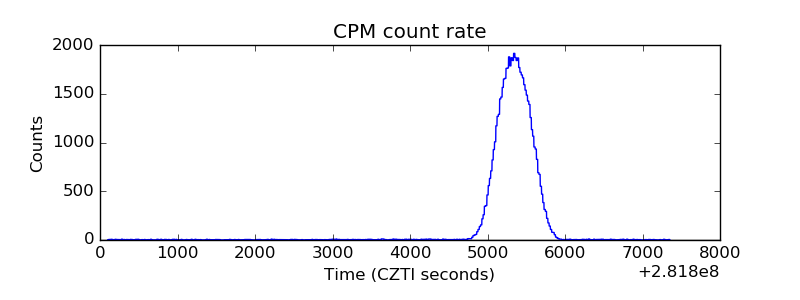 |
| CZT Counter |  |
| +2.5 Volts monitor |  |
| +5 Volts monitor | 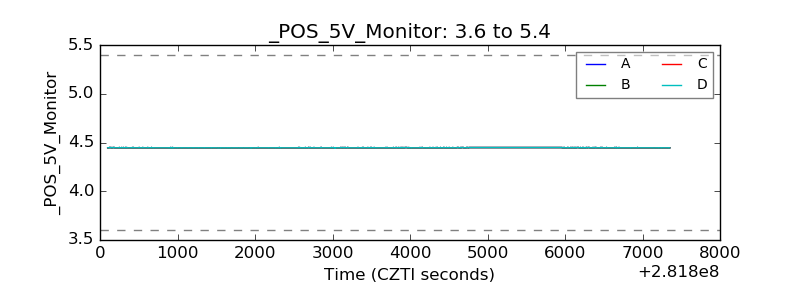 |
| _ROLL_ROT | 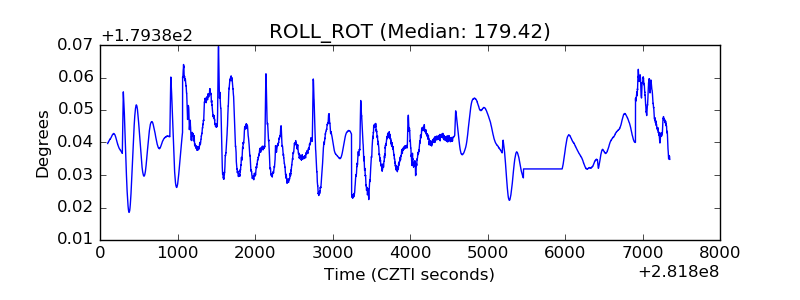 |
| _Roll_DEC | 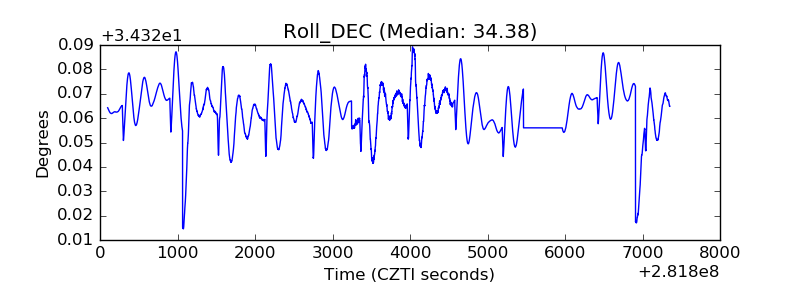 |
| _Roll_RA | 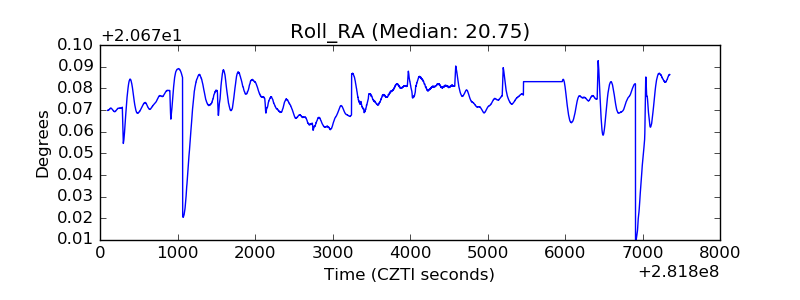 |
| Veto Counter | 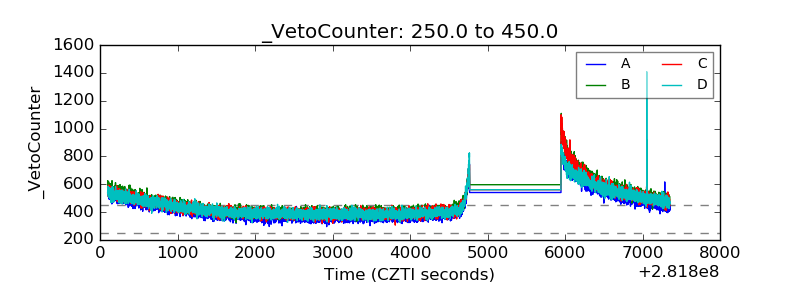 |