| Param | Original file | Final file |
|---|---|---|
| Filename | modeM0/AS1A05_185T04_9000002552_17252cztM0_level2.evt | modeM0/AS1A05_185T04_9000002552_17252cztM0_level2_quad_clean.evt |
| Size (bytes) | 449,196,480 | 106,292,160 |
| Size | 428.4 MB | 101.4 MB |
| Events in quadrant A | 3,393,025 | 716,496 |
| Events in quadrant B | 3,258,857 | 716,120 |
| Events in quadrant C | 3,231,153 | 668,352 |
| Events in quadrant D | 3,287,542 | 673,239 |
| Mode M9 | |||
|---|---|---|---|
| Quadrant | BADHDUFLAG | Total packets | Discarded packets |
| A | 0 | 13 | 0 |
| B | 0 | 13 | 0 |
| C | 0 | 13 | 0 |
| D | 0 | 13 | 0 |
| Mode SS | |||
|---|---|---|---|
| Quadrant | BADHDUFLAG | Total packets | Discarded packets |
| A | 0 | 130 | 0 |
| B | 0 | 130 | 0 |
| C | 0 | 130 | 0 |
| D | 0 | 130 | 0 |
| Mode M0 | |||
|---|---|---|---|
| Quadrant | BADHDUFLAG | Total packets | Discarded packets |
| A | 0 | 14206 | 2 |
| B | 0 | 13729 | 2 |
| C | 0 | 13577 | 3 |
| D | 0 | 13953 | 2 |
| Quadrant | Total seconds | Saturated seconds | Saturation percentage |
|---|---|---|---|
| A | 6376 | 80 | 1.254705% |
| B | 6377 | 63 | 0.987925% |
| C | 6376 | 85 | 1.333124% |
| D | 6376 | 70 | 1.097867% |
Noise dominated data is calculated using 1-second bins in cleaned event files. If a bin has >2000 counts, and if more than 50% of those come from <1% of pixels, then it is considered to be noise-dominated and hence unusable.
| Quadrant | # 1 sec bins | Bins with >0 counts | Bins with >2000 counts | High rate bins dominated by noise | Noise dominated (total time) | Noise dominated (detector-on time) | Marked lightcurve |
|---|---|---|---|---|---|---|---|
| A | 7631 | 6377 | 13 | 13 | 0.17% | 0.20% |  |
| B | 7632 | 6378 | 1 | 1 | 0.01% | 0.02% |  |
| C | 7631 | 6377 | 0 | 0 | 0.00% | 0.00% |  |
| D | 7631 | 6377 | 17 | 17 | 0.22% | 0.27% |  |
Top three noisy pixels from each quadrant. If the there are fewer than three noisy pixels in the level2.evt file, extra rows are filled as -1
| Pixel properties | Quadrant properties | ||||||
|---|---|---|---|---|---|---|---|
| Quadrant | DetID | PixID | Counts | Sigma | Mean | Median | Sigma |
| A | 0 | 23 | 111695 | 662.17 | 833 | 818 | 167.4 |
| A | 15 | 174 | 73708 | 435.31 | 833 | 818 | 167.4 |
| A | 0 | 226 | 14282 | 80.41 | 833 | 818 | 167.4 |
| B | 12 | 111 | 17080 | 104.53 | 823 | 804 | 155.7 |
| B | 11 | 111 | 14745 | 89.53 | 823 | 804 | 155.7 |
| B | 14 | 111 | 11843 | 70.9 | 823 | 804 | 155.7 |
| C | 14 | 238 | 123499 | 679.94 | 784 | 792 | 180.5 |
| C | 3 | 233 | 44712 | 243.37 | 784 | 792 | 180.5 |
| C | 13 | 61 | 5520 | 26.2 | 784 | 792 | 180.5 |
| D | 13 | 189 | 108736 | 554.95 | 810 | 787 | 194.5 |
| D | 10 | 70 | 74458 | 378.73 | 810 | 787 | 194.5 |
| D | 2 | 234 | 24173 | 120.22 | 810 | 787 | 194.5 |
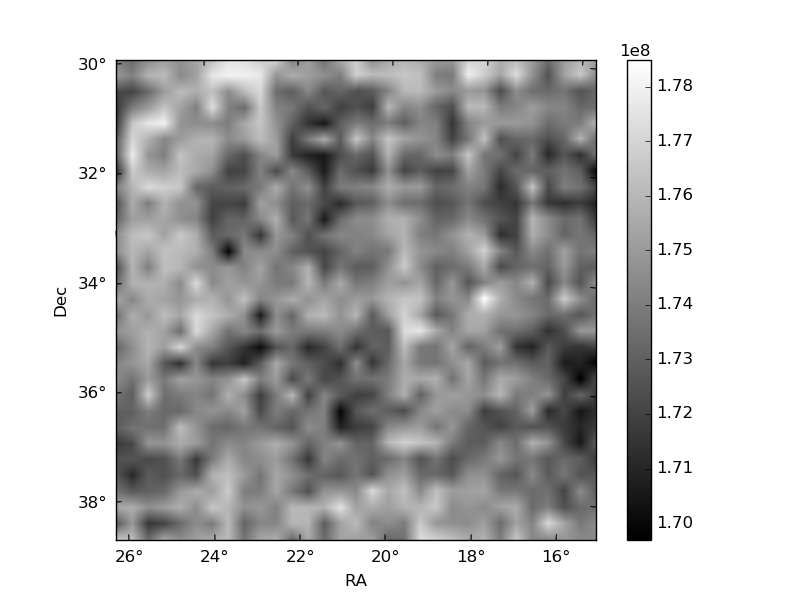
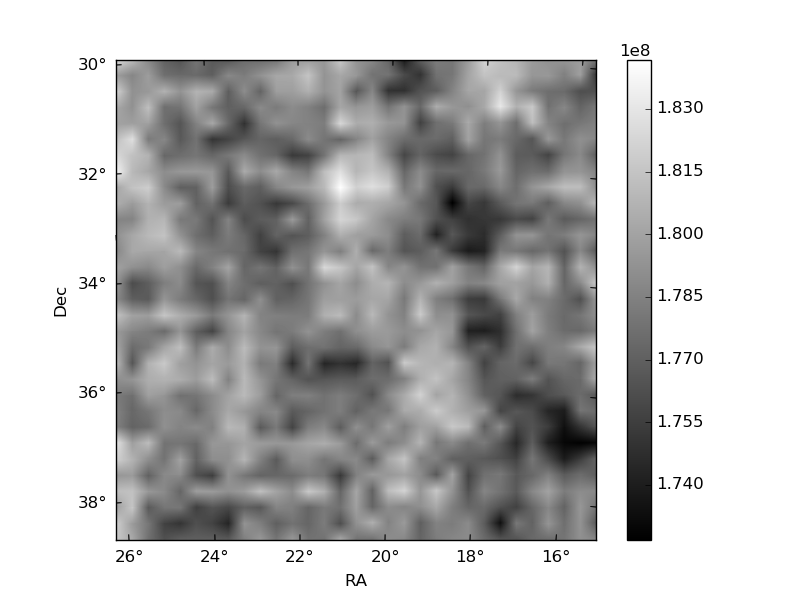
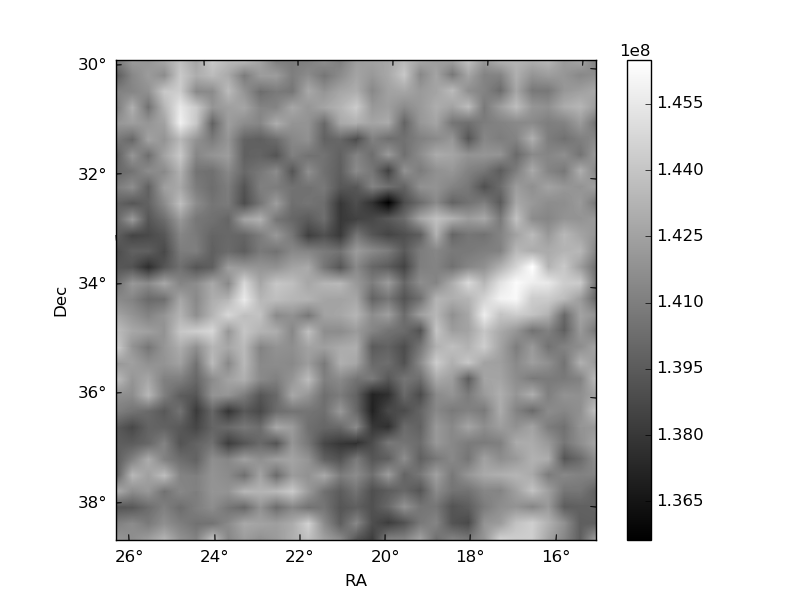
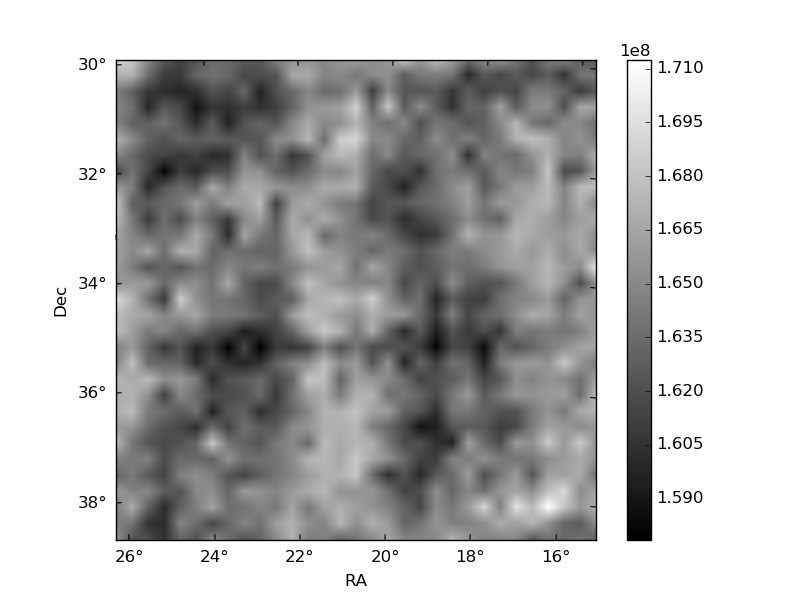
Histogram calculated using DETX and DETY for each event in the final _common_clean file
| Quadrant A | 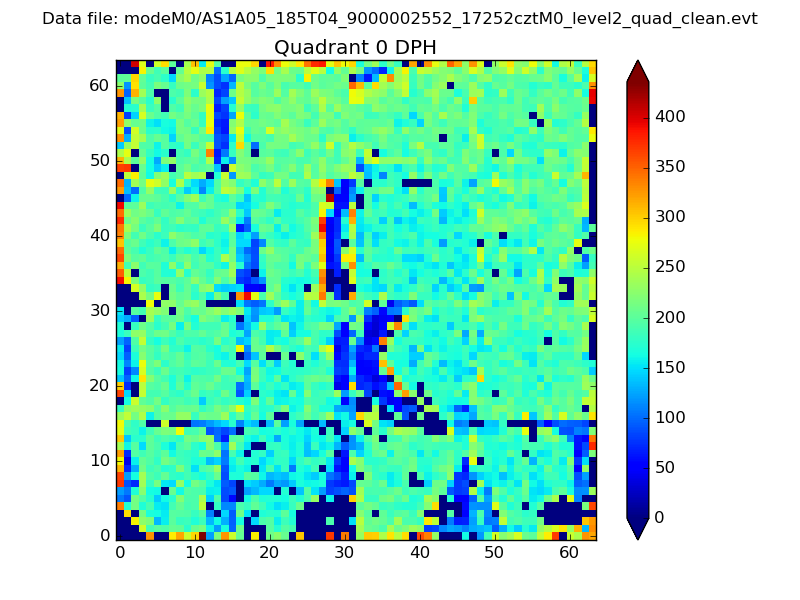 |
 |
Quadrant B |
|---|---|---|---|
| Quadrant D | 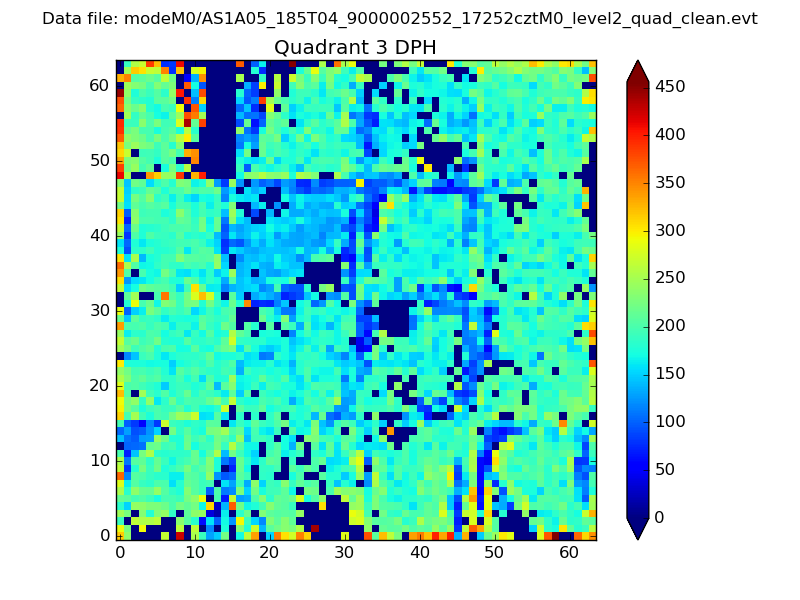 |
 |
Quadrant C |
| Plot type | Count rate plots | Images |
|---|---|---|
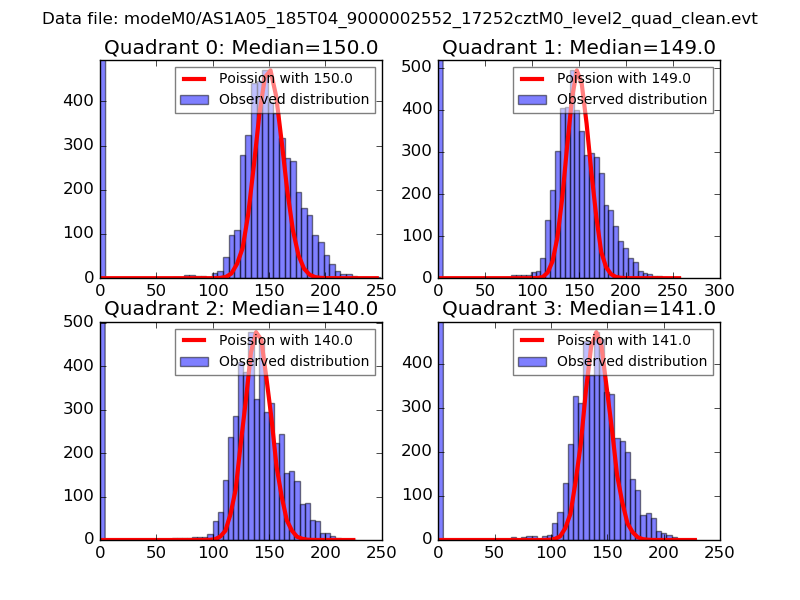
| Comparison with Poisson distribution Blue bars denote a histogram of data divided into 1 sec bins. Red curve is a Poisson curve with rate = median count rate of data. |
 |
 |
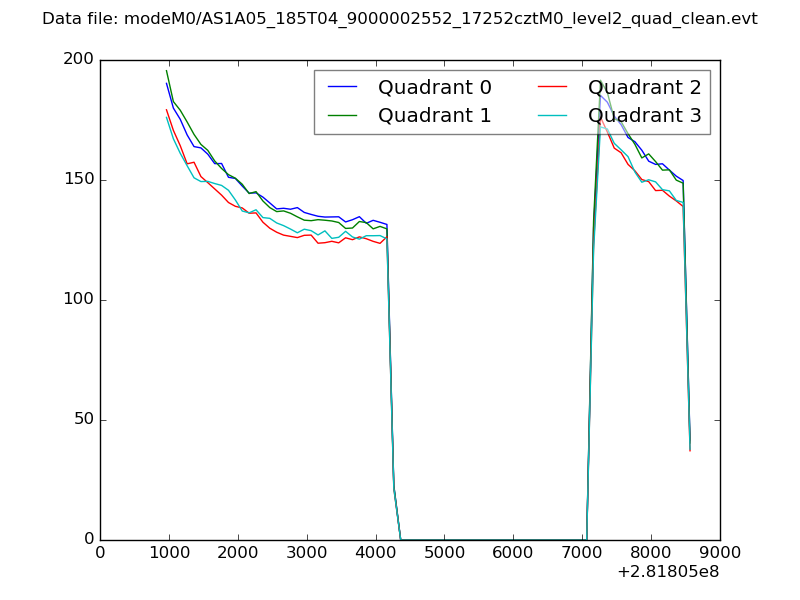
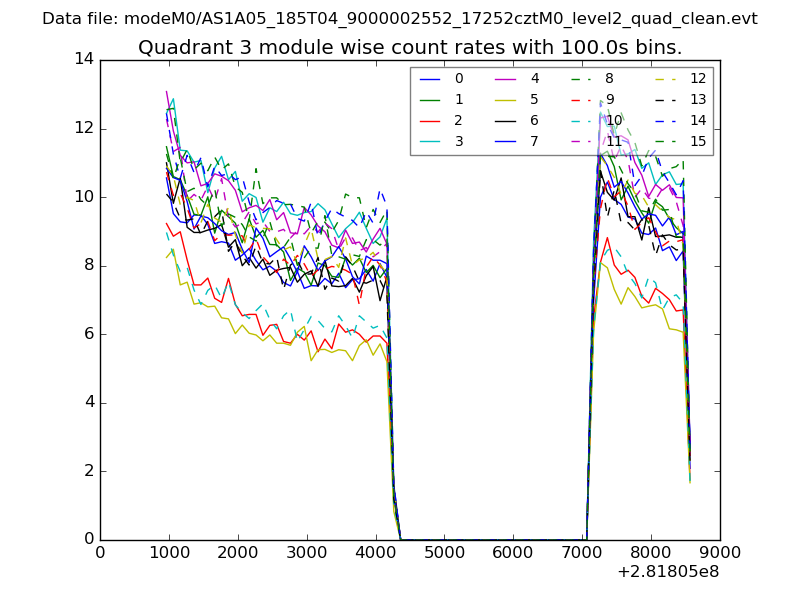
| Quadrant-wise count rates Data is divided into 100 sec bins |
 |
|
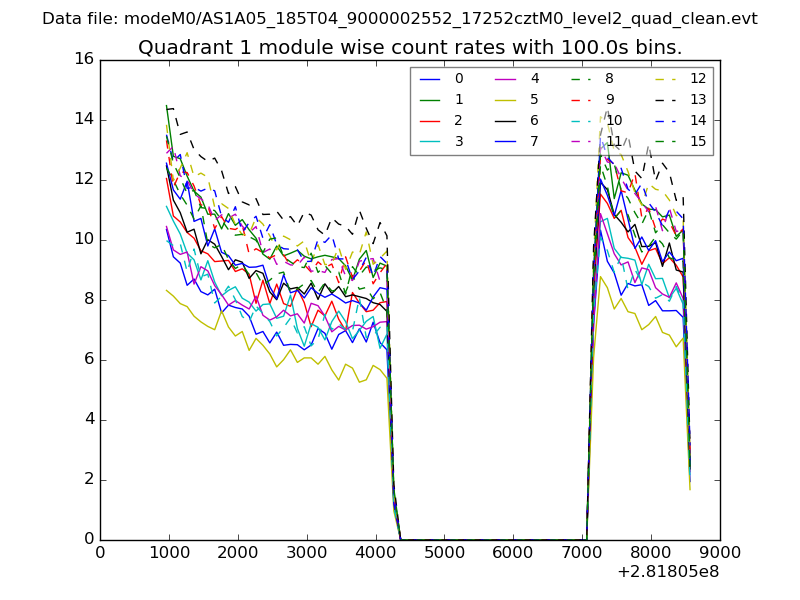
| Module-wise count rates for Quadrant A Data is divided into 100 sec bins |
 |
 |
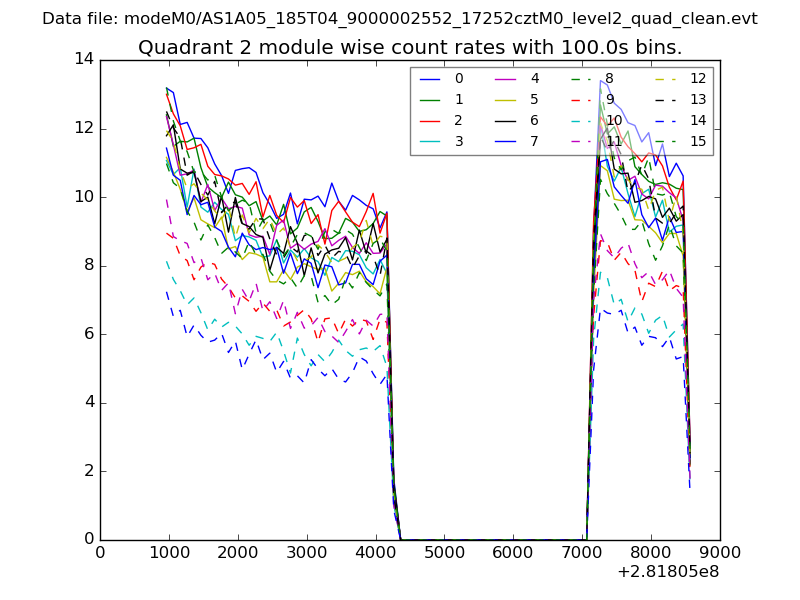
| Module-wise count rates for Quadrant B Data is divided into 100 sec bins |
 |
 |
| Module-wise count rates for Quadrant C Data is divided into 100 sec bins |
 |
 |
| Module-wise count rates for Quadrant D Data is divided into 100 sec bins |
 |
 |
| Parameter | Plot |
|---|---|
| CZT HV Monitor | 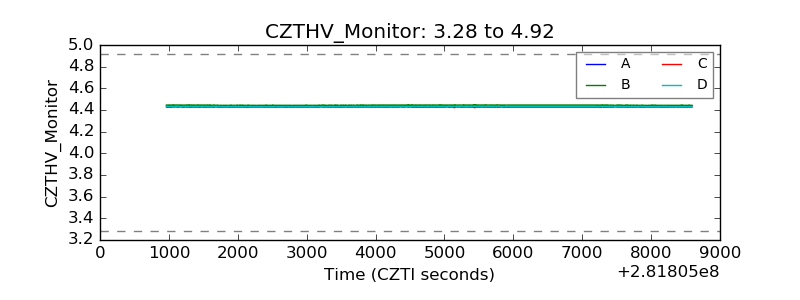 |
| D_VDD | 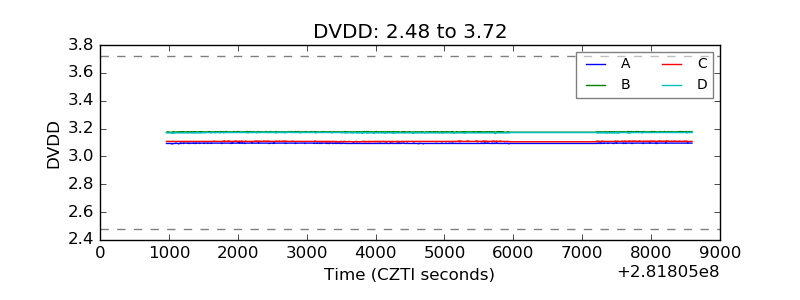 |
| Temperature 1 | 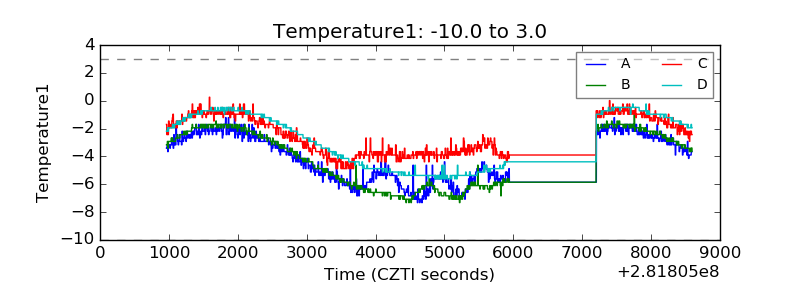 |
| Veto HV Monitor | 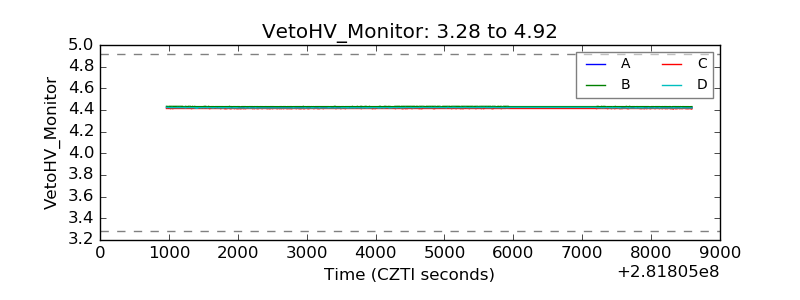 |
| Veto LLD | 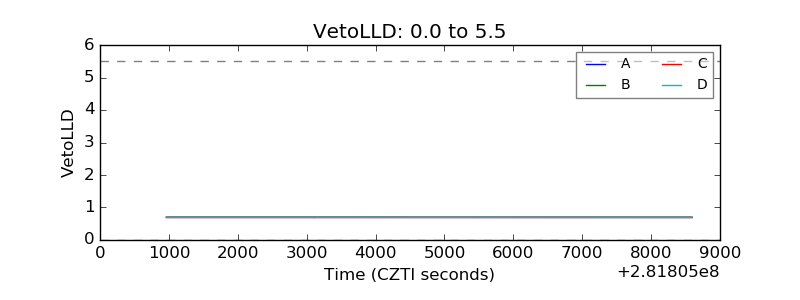 |
| Alpha Counter | 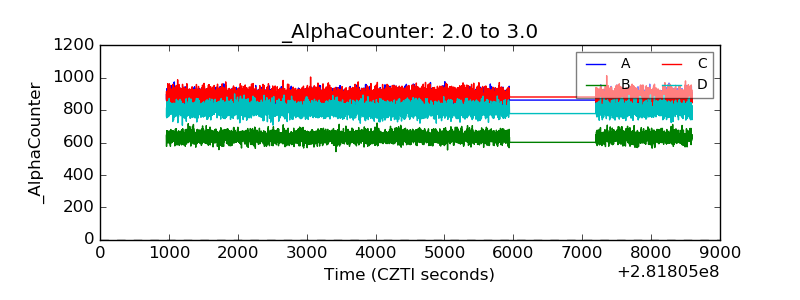 |
| _CPM_Rate | 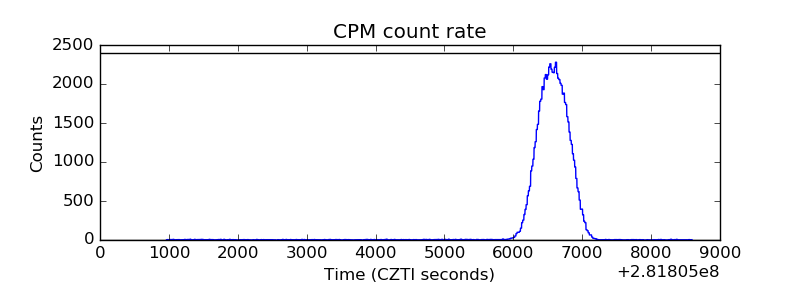 |
| CZT Counter |  |
| +2.5 Volts monitor |  |
| +5 Volts monitor | 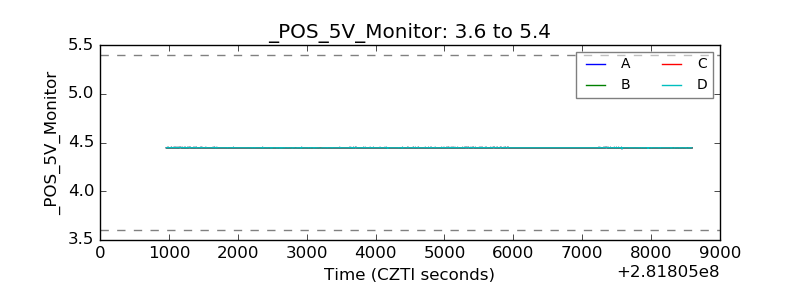 |
| _ROLL_ROT | 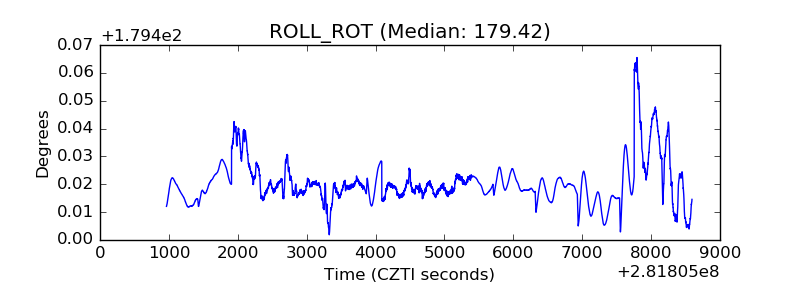 |
| _Roll_DEC | 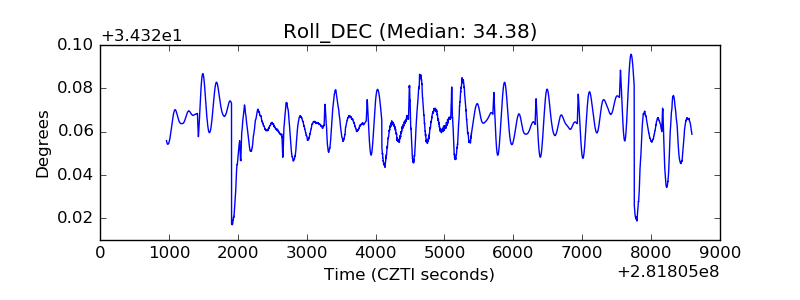 |
| _Roll_RA |  |
| Veto Counter | 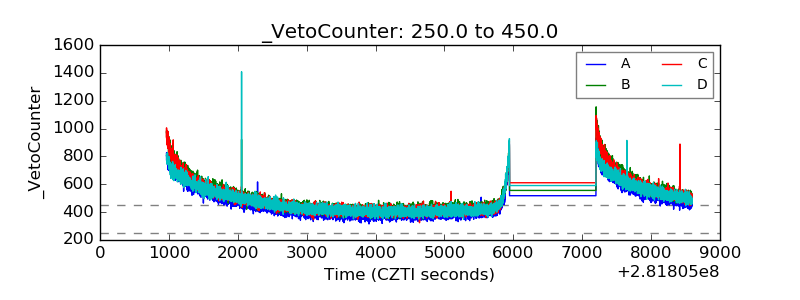 |