| Param | Original file | Final file |
|---|---|---|
| Filename | modeM0/AS1A05_185T04_9000002552_17253cztM0_level2.evt | modeM0/AS1A05_185T04_9000002552_17253cztM0_level2_quad_clean.evt |
| Size (bytes) | 460,376,640 | 97,637,760 |
| Size | 439.0 MB | 93.1 MB |
| Events in quadrant A | 3,207,368 | 654,702 |
| Events in quadrant B | 3,286,098 | 653,763 |
| Events in quadrant C | 3,215,721 | 615,469 |
| Events in quadrant D | 3,808,648 | 596,558 |
| Mode M9 | |||
|---|---|---|---|
| Quadrant | BADHDUFLAG | Total packets | Discarded packets |
| A | 0 | 18 | 0 |
| B | 0 | 19 | 0 |
| C | 0 | 19 | 0 |
| D | 0 | 19 | 0 |
| Mode SS | |||
|---|---|---|---|
| Quadrant | BADHDUFLAG | Total packets | Discarded packets |
| A | 0 | 126 | 0 |
| B | 0 | 126 | 0 |
| C | 0 | 126 | 0 |
| D | 0 | 126 | 0 |
| Mode M0 | |||
|---|---|---|---|
| Quadrant | BADHDUFLAG | Total packets | Discarded packets |
| A | 0 | 13486 | 2 |
| B | 0 | 13740 | 2 |
| C | 0 | 13396 | 2 |
| D | 0 | 15439 | 2 |
| Quadrant | Total seconds | Saturated seconds | Saturation percentage |
|---|---|---|---|
| A | 6257 | 53 | 0.847051% |
| B | 6256 | 50 | 0.799233% |
| C | 6256 | 83 | 1.326726% |
| D | 6256 | 292 | 4.667519% |
Noise dominated data is calculated using 1-second bins in cleaned event files. If a bin has >2000 counts, and if more than 50% of those come from <1% of pixels, then it is considered to be noise-dominated and hence unusable.
| Quadrant | # 1 sec bins | Bins with >0 counts | Bins with >2000 counts | High rate bins dominated by noise | Noise dominated (total time) | Noise dominated (detector-on time) | Marked lightcurve |
|---|---|---|---|---|---|---|---|
| A | 7572 | 6258 | 0 | 0 | 0.00% | 0.00% | 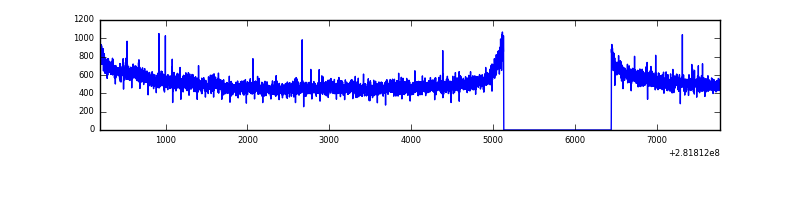 |
| B | 7571 | 6257 | 1 | 1 | 0.01% | 0.02% | 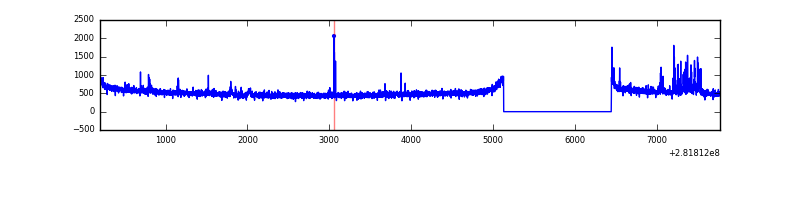 |
| C | 7571 | 6257 | 0 | 0 | 0.00% | 0.00% | 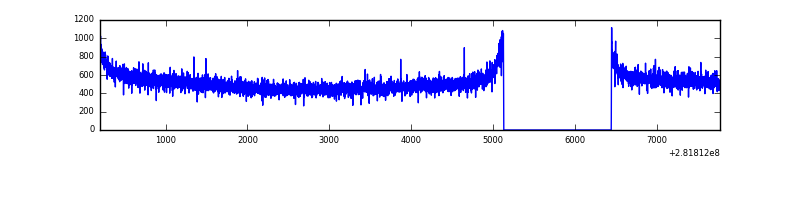 |
| D | 7571 | 6257 | 204 | 204 | 2.69% | 3.26% | 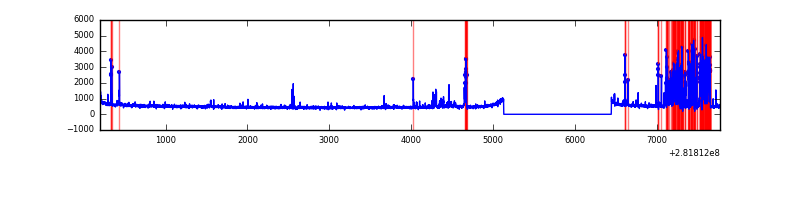 |
Top three noisy pixels from each quadrant. If the there are fewer than three noisy pixels in the level2.evt file, extra rows are filled as -1
| Pixel properties | Quadrant properties | ||||||
|---|---|---|---|---|---|---|---|
| Quadrant | DetID | PixID | Counts | Sigma | Mean | Median | Sigma |
| A | 0 | 23 | 58897 | 356.12 | 817 | 800 | 163.1 |
| A | 0 | 226 | 11105 | 63.17 | 817 | 800 | 163.1 |
| A | 12 | 194 | 6065 | 32.27 | 817 | 800 | 163.1 |
| B | 0 | 189 | 74585 | 483.34 | 811 | 793 | 152.7 |
| B | 12 | 111 | 16642 | 103.81 | 811 | 793 | 152.7 |
| B | 0 | 197 | 15574 | 96.81 | 811 | 793 | 152.7 |
| C | 14 | 238 | 120793 | 669.68 | 775 | 784 | 179.2 |
| C | 3 | 233 | 56199 | 309.23 | 775 | 784 | 179.2 |
| C | 1 | 16 | 14656 | 77.41 | 775 | 784 | 179.2 |
| D | 1 | 52 | 528890 | 2795.0 | 782 | 761 | 189.0 |
| D | 13 | 189 | 237400 | 1252.36 | 782 | 761 | 189.0 |
| D | 10 | 70 | 42326 | 219.97 | 782 | 761 | 189.0 |
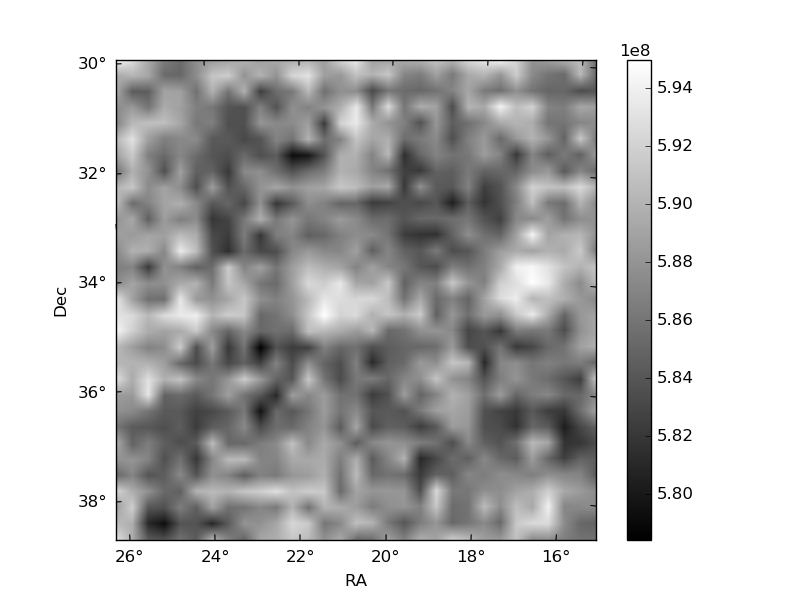
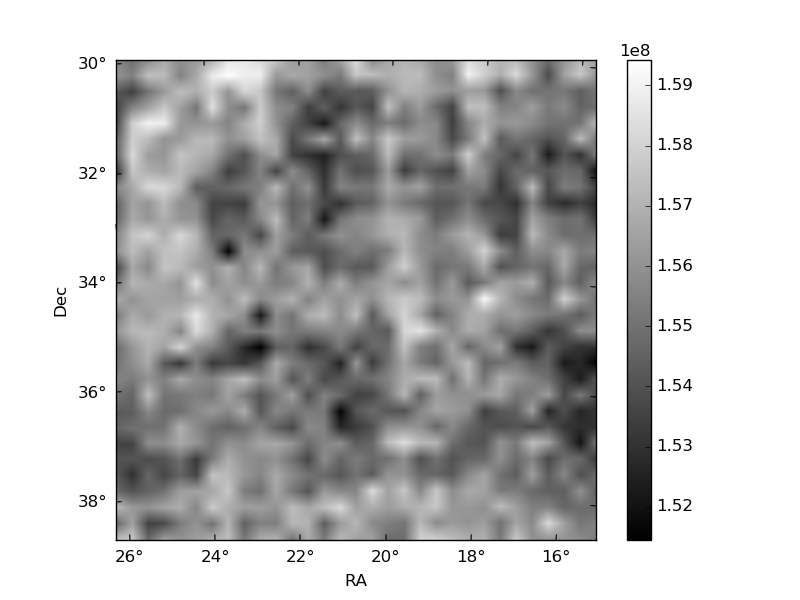
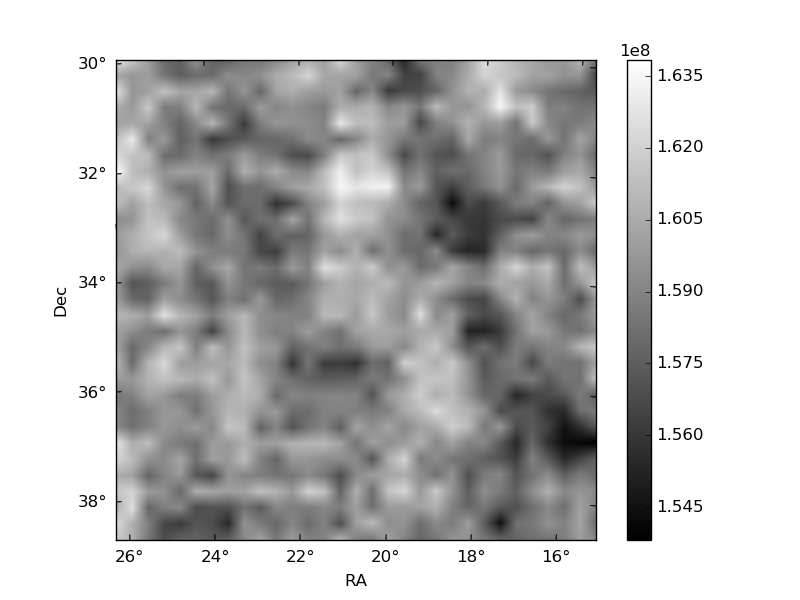
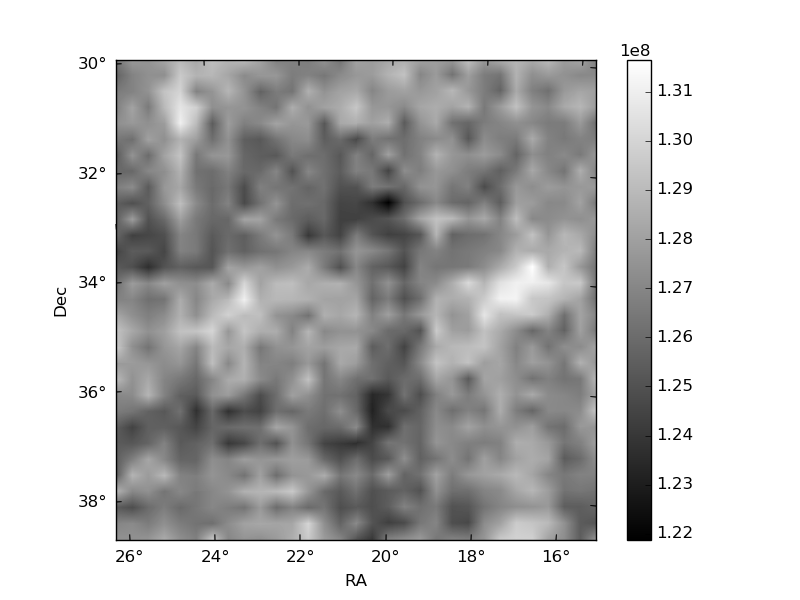
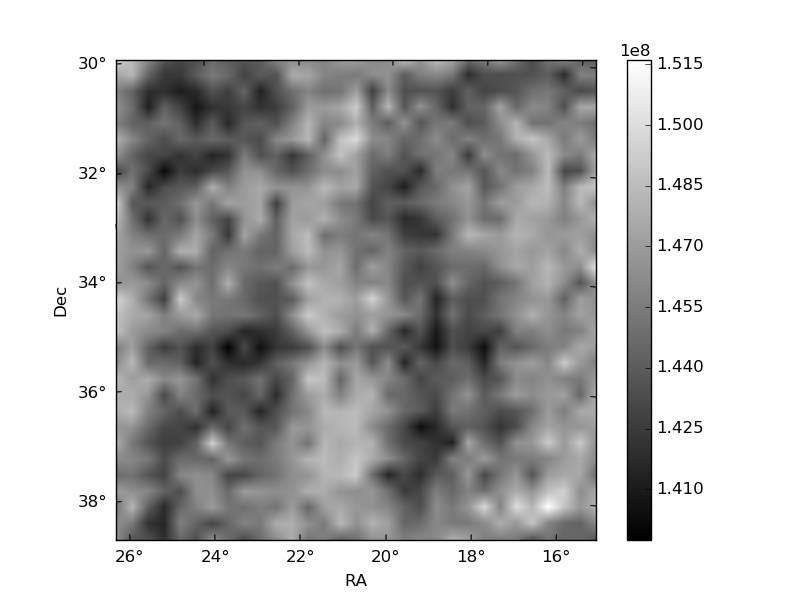
Histogram calculated using DETX and DETY for each event in the final _common_clean file
| Quadrant A | 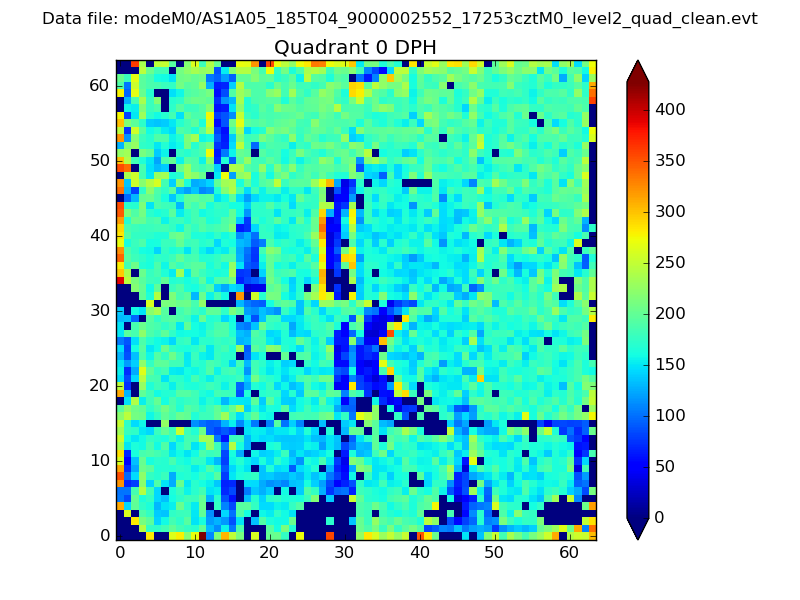 |
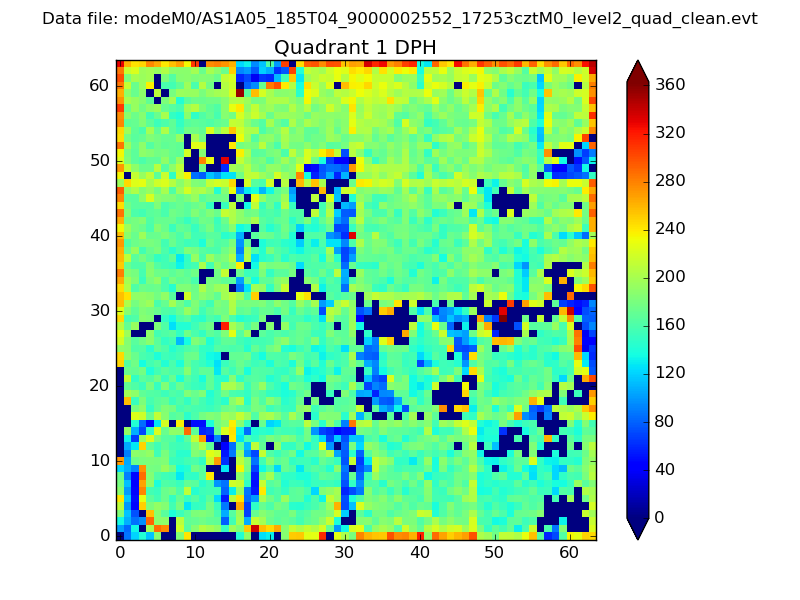 |
Quadrant B |
|---|---|---|---|
| Quadrant D | 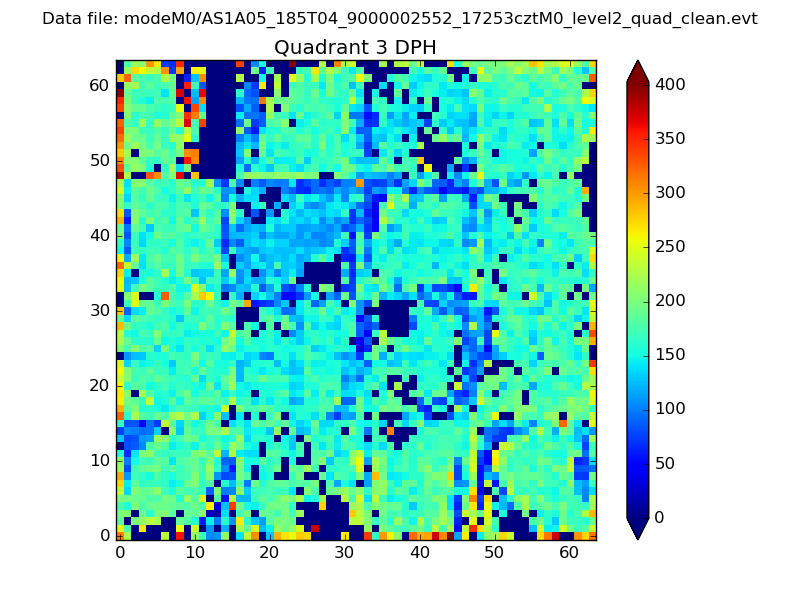 |
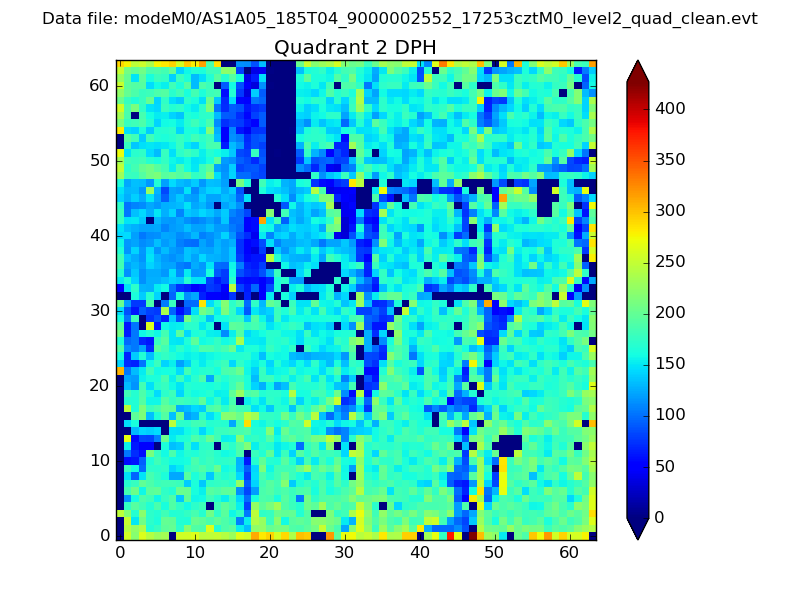 |
Quadrant C |
| Plot type | Count rate plots | Images |
|---|---|---|
| Comparison with Poisson distribution Blue bars denote a histogram of data divided into 1 sec bins. Red curve is a Poisson curve with rate = median count rate of data. |
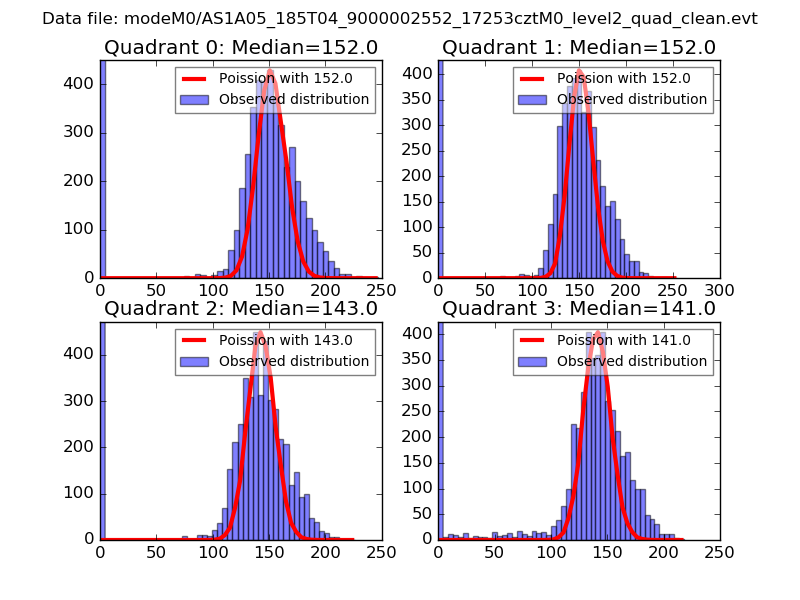 |
 |
| Quadrant-wise count rates Data is divided into 100 sec bins |
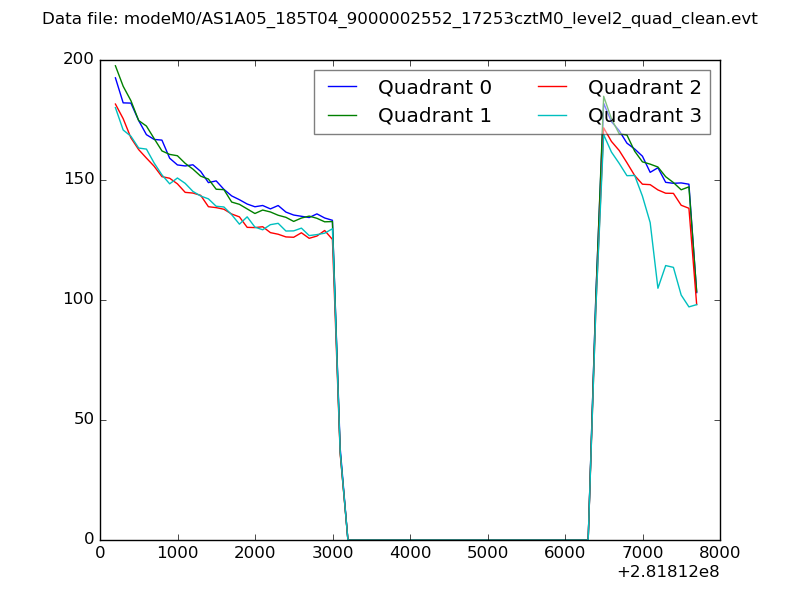 |
|
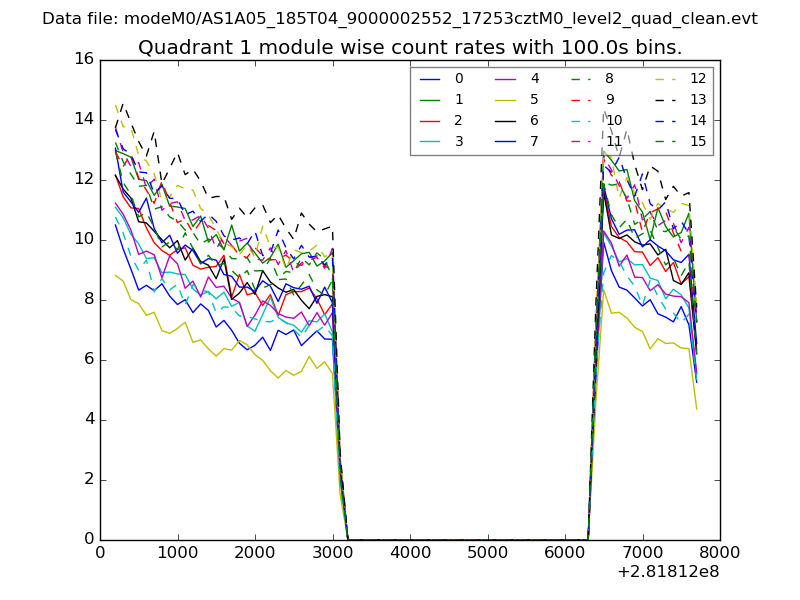
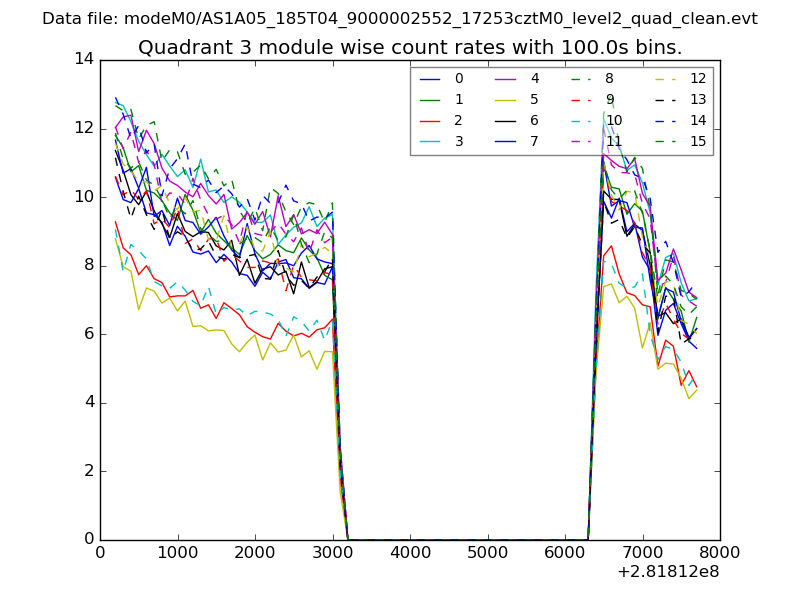
| Module-wise count rates for Quadrant A Data is divided into 100 sec bins |
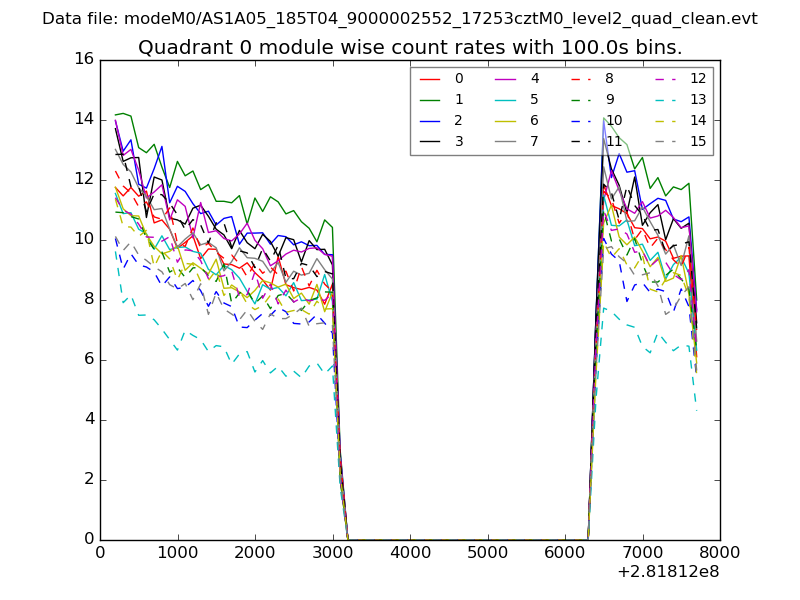 |
 |
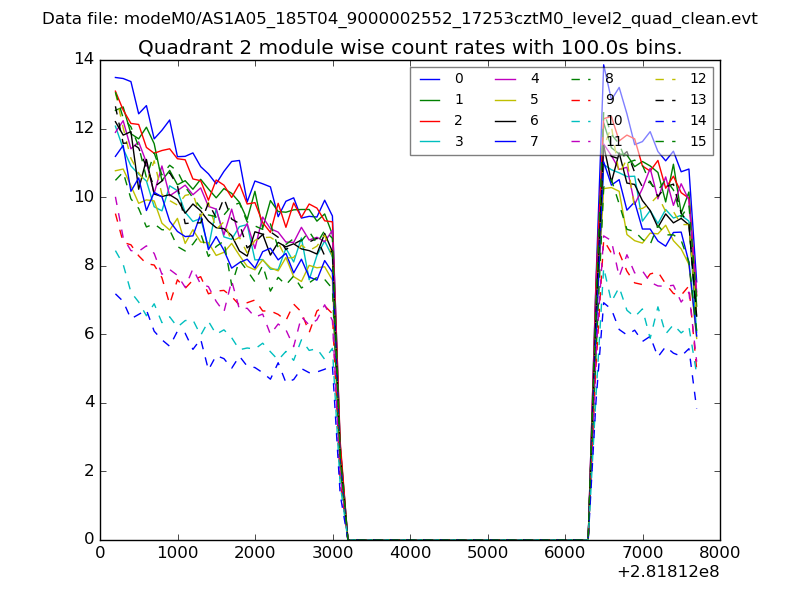
| Module-wise count rates for Quadrant B Data is divided into 100 sec bins |
 |
 |
| Module-wise count rates for Quadrant C Data is divided into 100 sec bins |
 |
 |
| Module-wise count rates for Quadrant D Data is divided into 100 sec bins |
 |
 |
| Parameter | Plot |
|---|---|
| CZT HV Monitor | 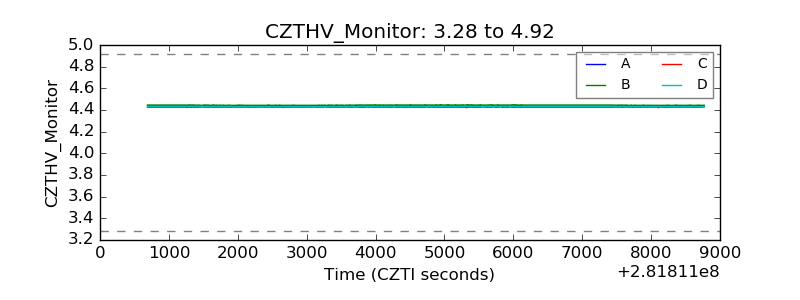 |
| D_VDD | 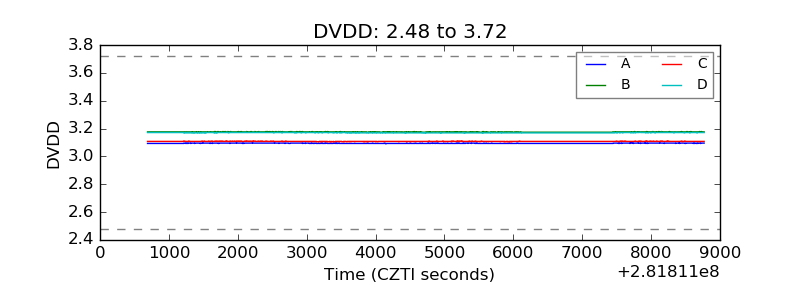 |
| Temperature 1 |  |
| Veto HV Monitor | 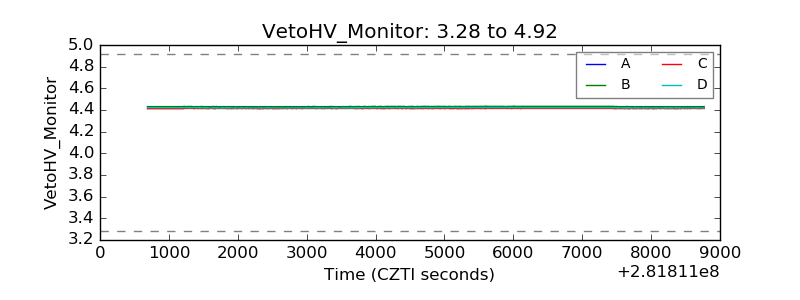 |
| Veto LLD | 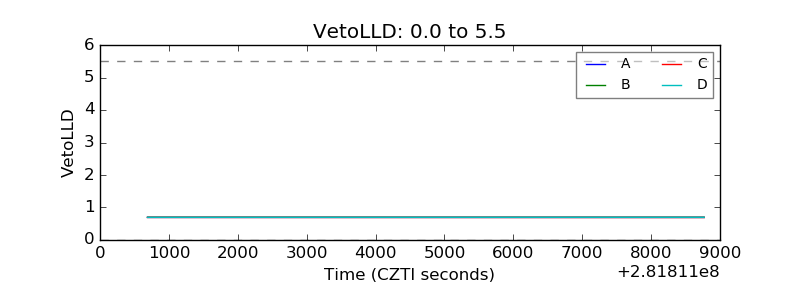 |
| Alpha Counter | 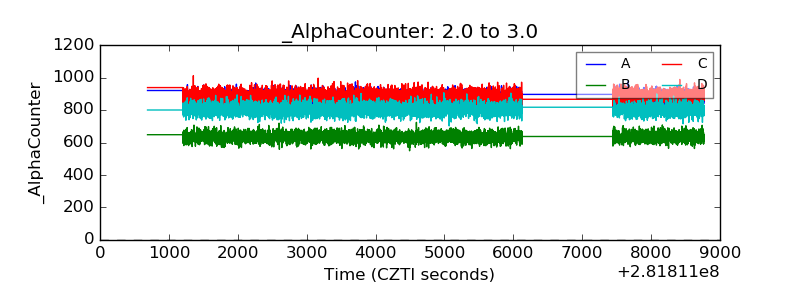 |
| _CPM_Rate | 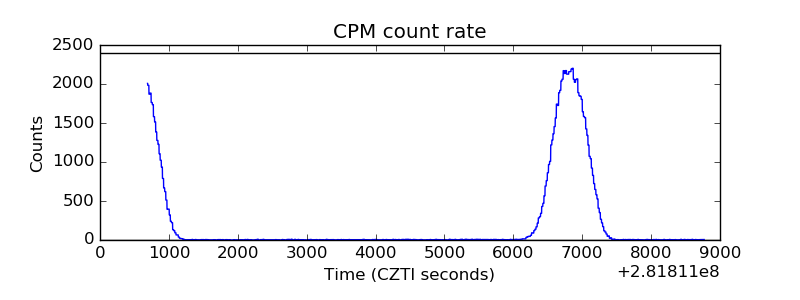 |
| CZT Counter | 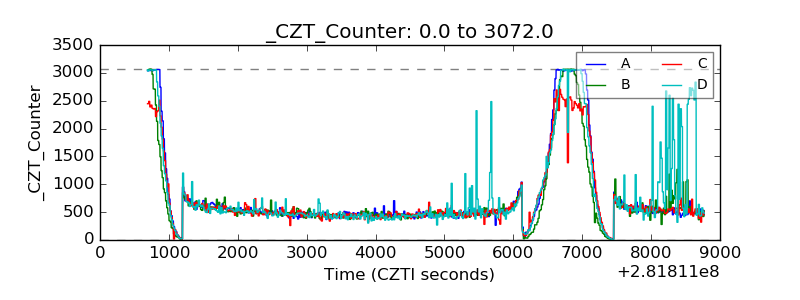 |
| +2.5 Volts monitor | 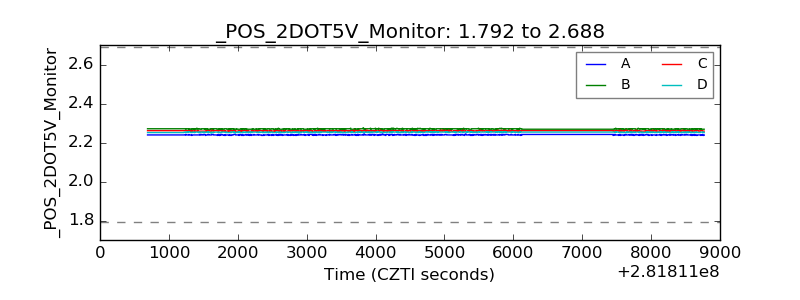 |
| +5 Volts monitor |  |
| _ROLL_ROT | 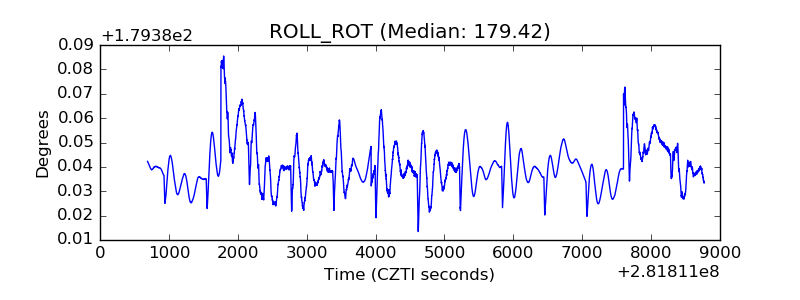 |
| _Roll_DEC | 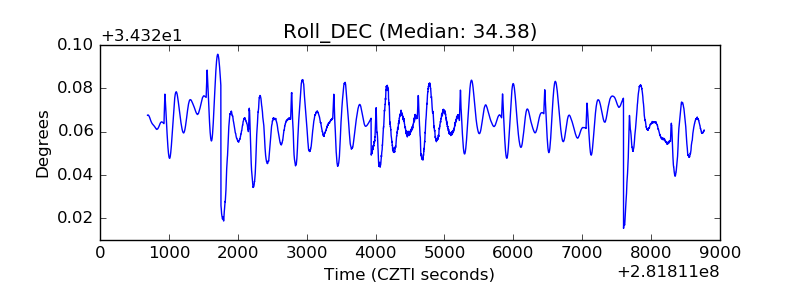 |
| _Roll_RA | 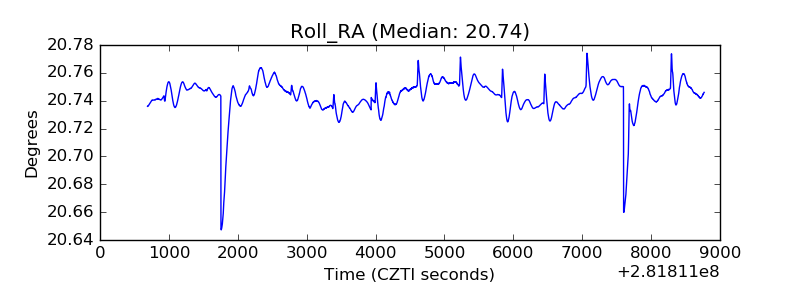 |
| Veto Counter | 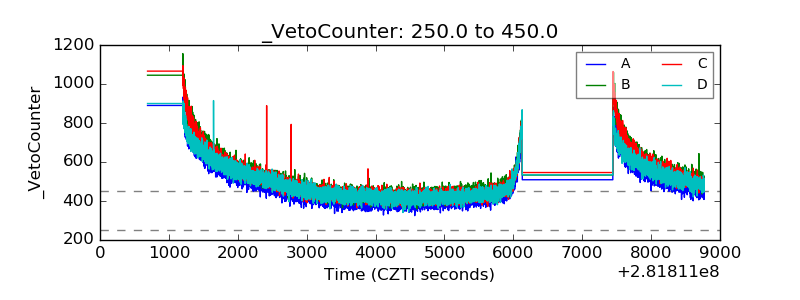 |