| Param | Original file | Final file |
|---|---|---|
| Filename | modeM0/AS1A05_185T04_9000002552_17254cztM0_level2.evt | modeM0/AS1A05_185T04_9000002552_17254cztM0_level2_quad_clean.evt |
| Size (bytes) | 467,642,880 | 92,813,760 |
| Size | 446.0 MB | 88.5 MB |
| Events in quadrant A | 3,174,468 | 614,951 |
| Events in quadrant B | 3,330,921 | 617,433 |
| Events in quadrant C | 3,198,403 | 584,773 |
| Events in quadrant D | 4,030,848 | 553,800 |
| Mode M9 | |||
|---|---|---|---|
| Quadrant | BADHDUFLAG | Total packets | Discarded packets |
| A | 0 | 23 | 0 |
| B | 0 | 24 | 0 |
| C | 0 | 24 | 0 |
| D | 0 | 24 | 0 |
| Mode SS | |||
|---|---|---|---|
| Quadrant | BADHDUFLAG | Total packets | Discarded packets |
| A | 0 | 128 | 0 |
| B | 0 | 128 | 0 |
| C | 0 | 128 | 0 |
| D | 0 | 128 | 0 |
| Mode M0 | |||
|---|---|---|---|
| Quadrant | BADHDUFLAG | Total packets | Discarded packets |
| A | 0 | 13296 | 2 |
| B | 0 | 13909 | 2 |
| C | 0 | 13324 | 2 |
| D | 0 | 16244 | 2 |
| Quadrant | Total seconds | Saturated seconds | Saturation percentage |
|---|---|---|---|
| A | 6299 | 43 | 0.682648% |
| B | 6299 | 53 | 0.841403% |
| C | 6299 | 86 | 1.365296% |
| D | 6299 | 358 | 5.683442% |
Noise dominated data is calculated using 1-second bins in cleaned event files. If a bin has >2000 counts, and if more than 50% of those come from <1% of pixels, then it is considered to be noise-dominated and hence unusable.
| Quadrant | # 1 sec bins | Bins with >0 counts | Bins with >2000 counts | High rate bins dominated by noise | Noise dominated (total time) | Noise dominated (detector-on time) | Marked lightcurve |
|---|---|---|---|---|---|---|---|
| A | 7599 | 6300 | 0 | 0 | 0.00% | 0.00% | 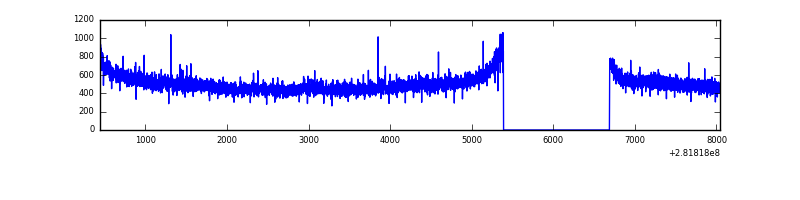 |
| B | 7599 | 6300 | 0 | 0 | 0.00% | 0.00% | 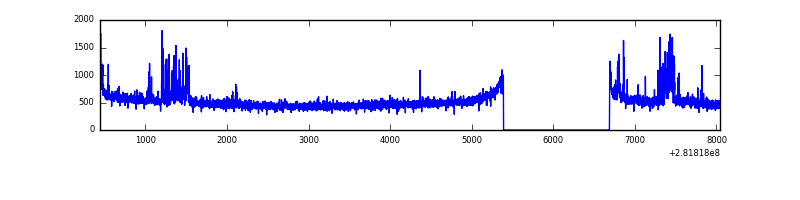 |
| C | 7599 | 6300 | 1 | 1 | 0.01% | 0.02% | 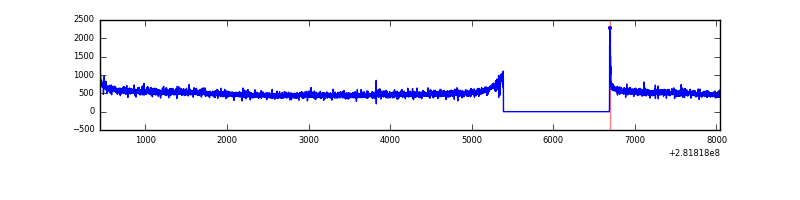 |
| D | 7599 | 6300 | 268 | 268 | 3.53% | 4.25% | 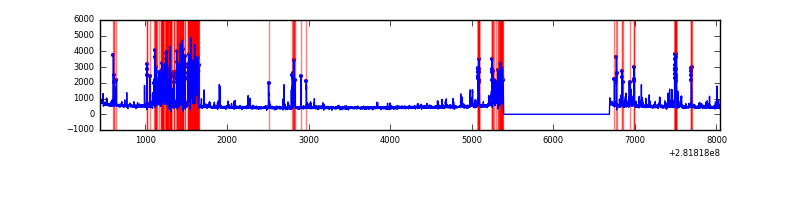 |
Top three noisy pixels from each quadrant. If the there are fewer than three noisy pixels in the level2.evt file, extra rows are filled as -1
| Pixel properties | Quadrant properties | ||||||
|---|---|---|---|---|---|---|---|
| Quadrant | DetID | PixID | Counts | Sigma | Mean | Median | Sigma |
| A | 0 | 23 | 96648 | 597.62 | 799 | 784 | 160.4 |
| A | 0 | 226 | 13065 | 76.56 | 799 | 784 | 160.4 |
| A | 12 | 194 | 5950 | 32.2 | 799 | 784 | 160.4 |
| B | 0 | 189 | 150697 | 991.94 | 798 | 778 | 151.1 |
| B | 0 | 197 | 33921 | 219.29 | 798 | 778 | 151.1 |
| B | 12 | 111 | 16765 | 105.78 | 798 | 778 | 151.1 |
| C | 14 | 238 | 121475 | 676.59 | 767 | 771 | 178.4 |
| C | 3 | 233 | 63150 | 349.65 | 767 | 771 | 178.4 |
| C | 1 | 16 | 25213 | 137.0 | 767 | 771 | 178.4 |
| D | 1 | 52 | 837442 | 4589.53 | 757 | 739 | 182.3 |
| D | 13 | 189 | 165262 | 902.45 | 757 | 739 | 182.3 |
| D | 10 | 70 | 115304 | 628.42 | 757 | 739 | 182.3 |
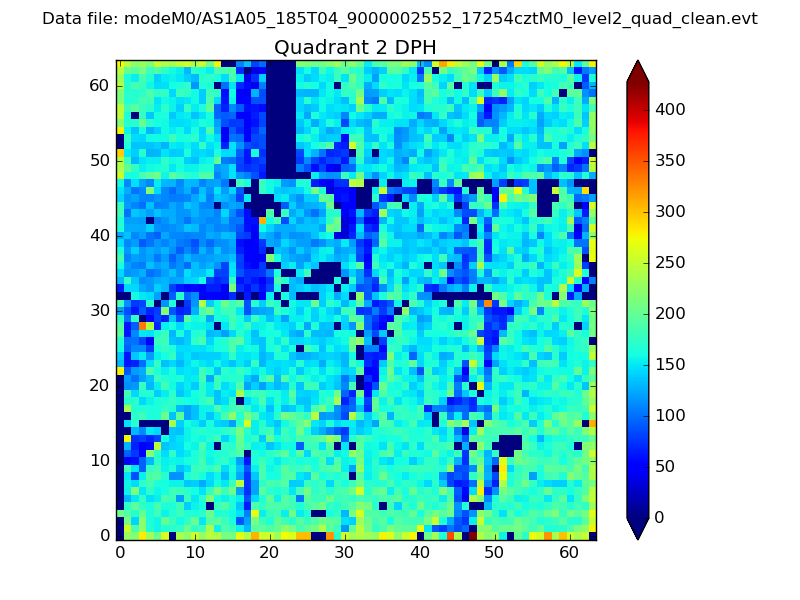
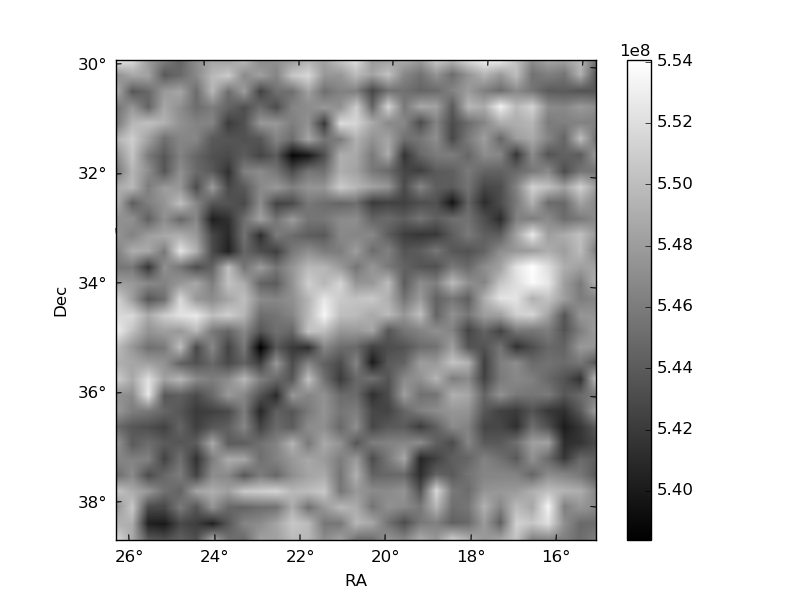
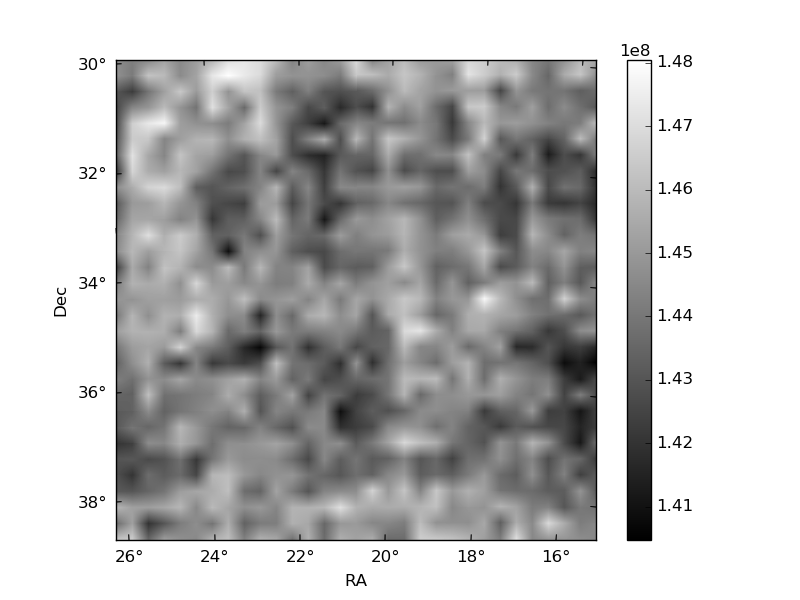
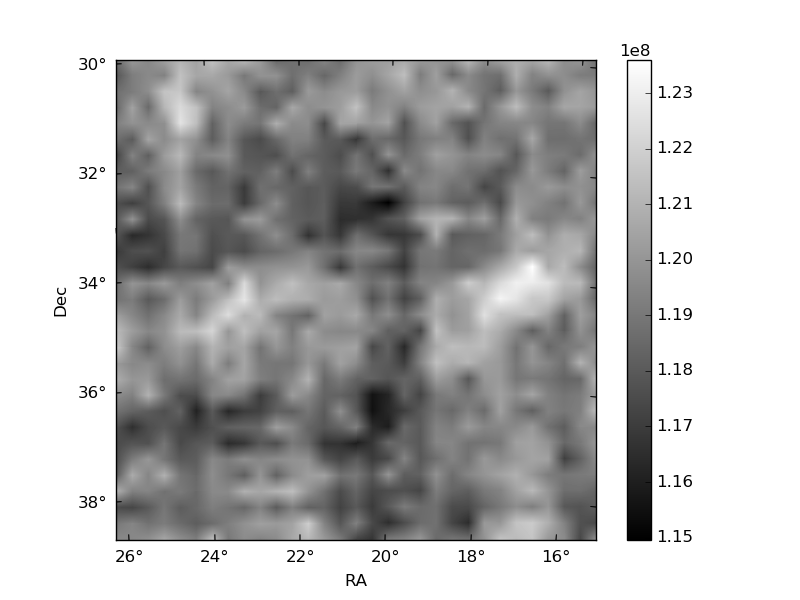
Histogram calculated using DETX and DETY for each event in the final _common_clean file
| Quadrant A | 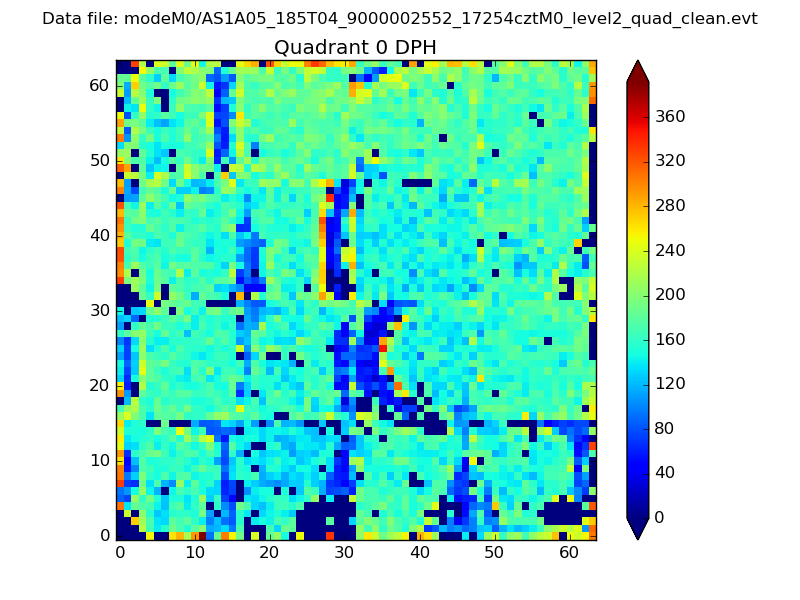 |
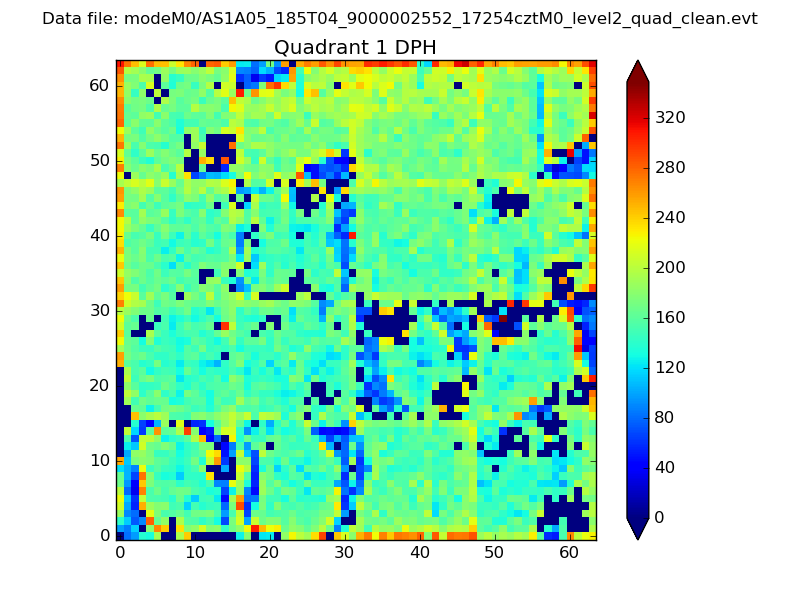 |
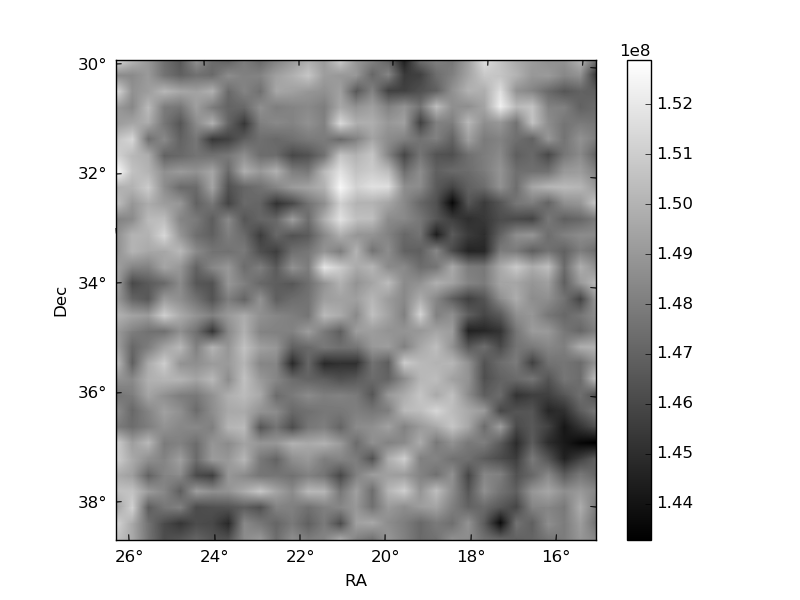
Quadrant B |
|---|---|---|---|
| Quadrant D | 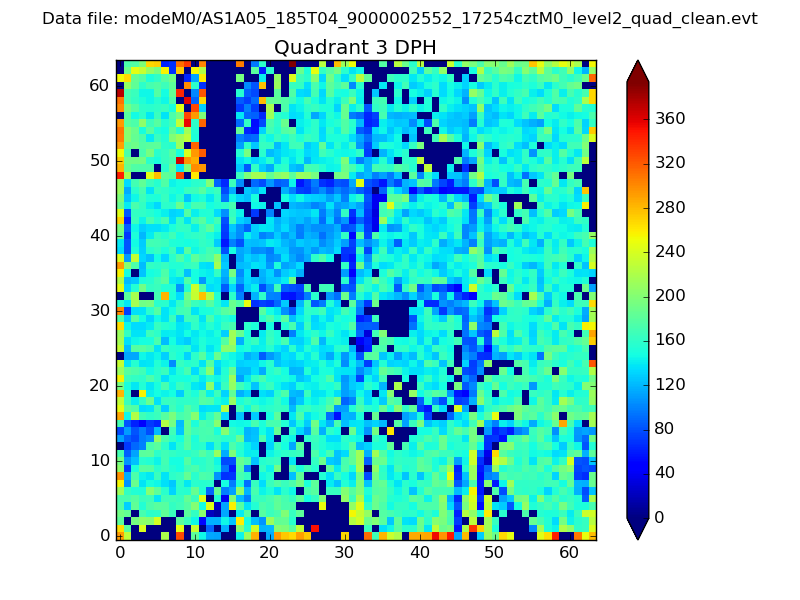 |
 |
Quadrant C |
| Plot type | Count rate plots | Images |
|---|---|---|
| Comparison with Poisson distribution Blue bars denote a histogram of data divided into 1 sec bins. Red curve is a Poisson curve with rate = median count rate of data. |
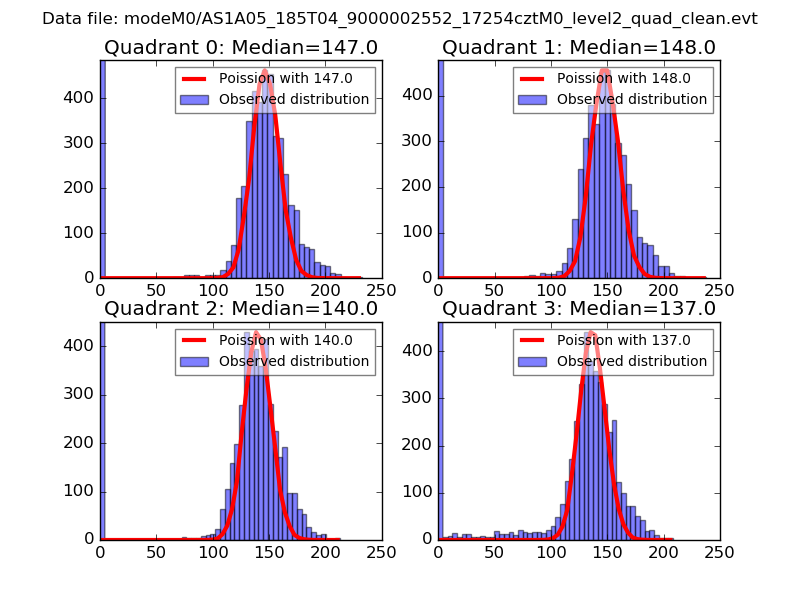 |
 |
| Quadrant-wise count rates Data is divided into 100 sec bins |
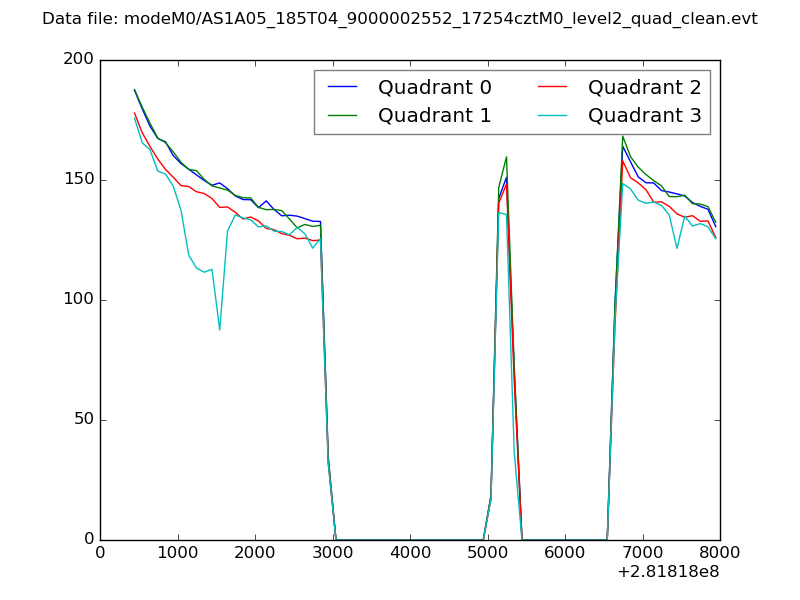 |
|
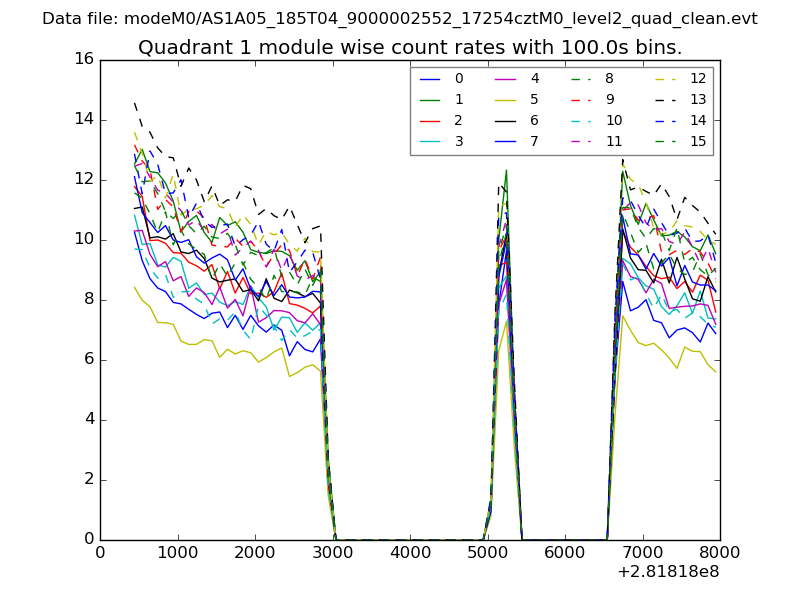
| Module-wise count rates for Quadrant A Data is divided into 100 sec bins |
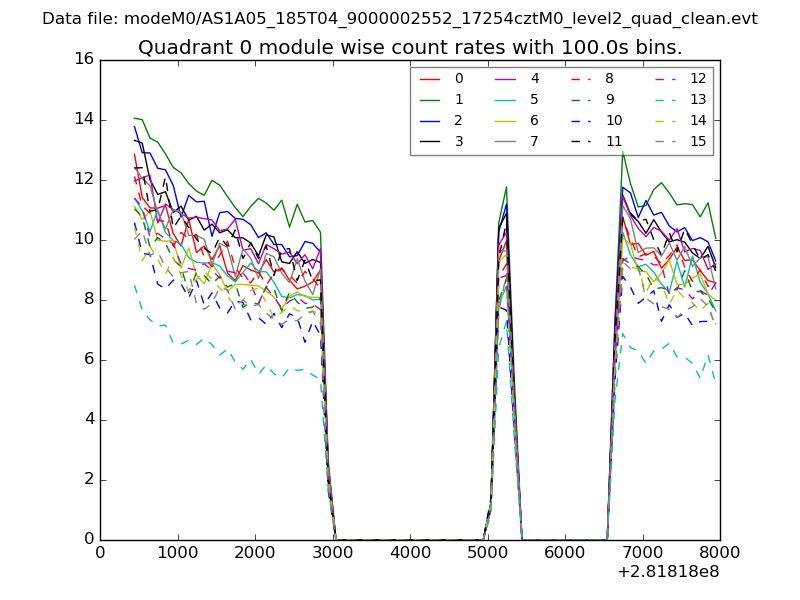 |
 |
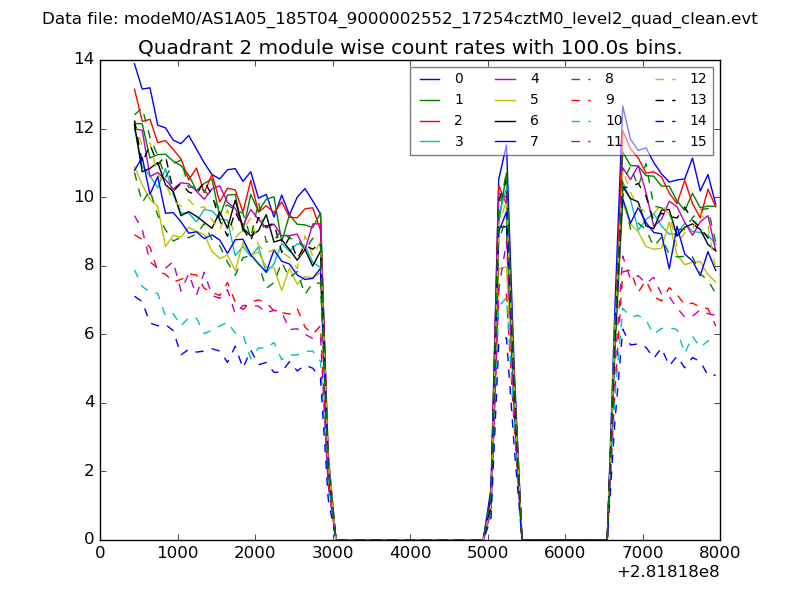
| Module-wise count rates for Quadrant B Data is divided into 100 sec bins |
 |
 |
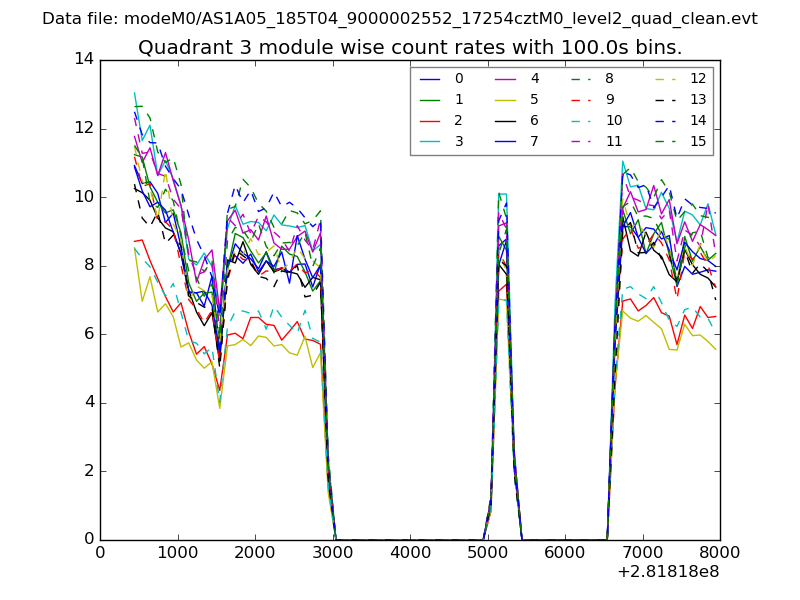
| Module-wise count rates for Quadrant C Data is divided into 100 sec bins |
 |
 |
| Module-wise count rates for Quadrant D Data is divided into 100 sec bins |
 |
 |
| Parameter | Plot |
|---|---|
| CZT HV Monitor | 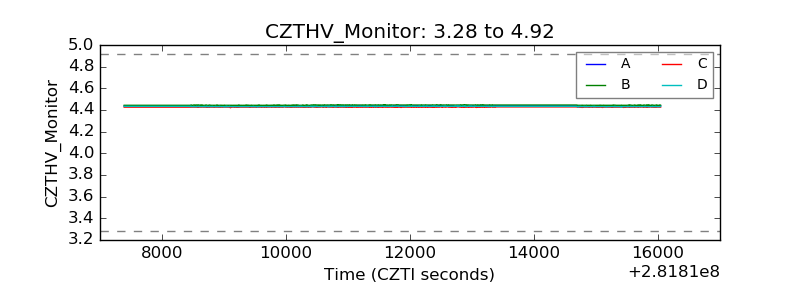 |
| D_VDD | 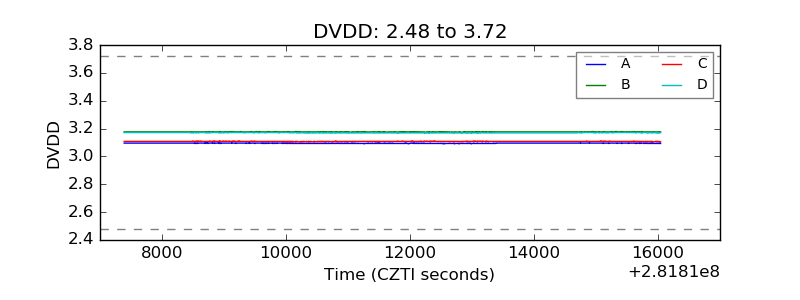 |
| Temperature 1 | 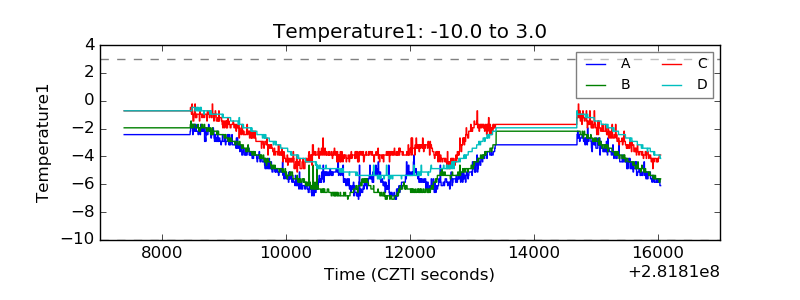 |
| Veto HV Monitor | 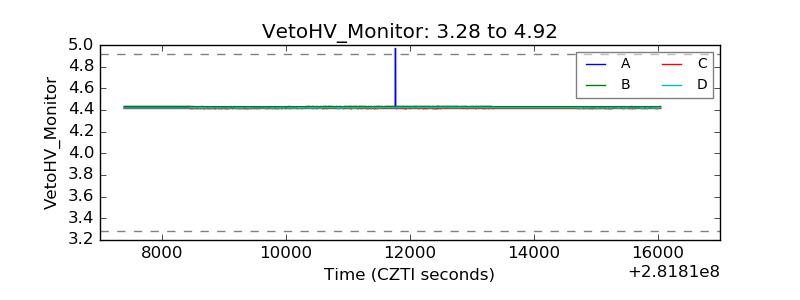 |
| Veto LLD |  |
| Alpha Counter | 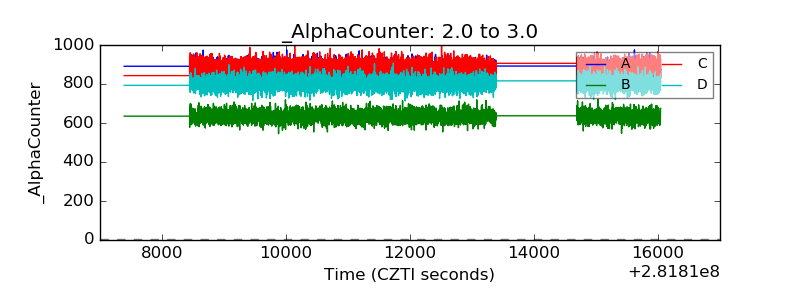 |
| _CPM_Rate | 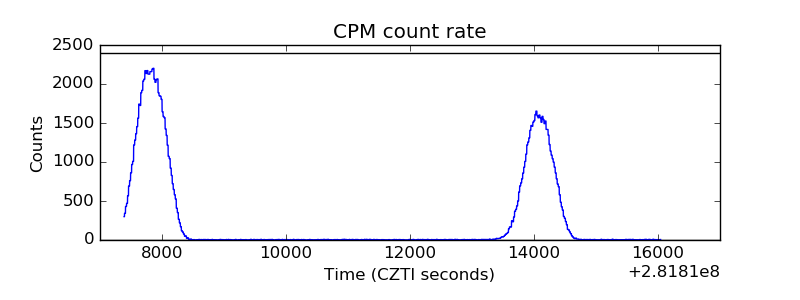 |
| CZT Counter | 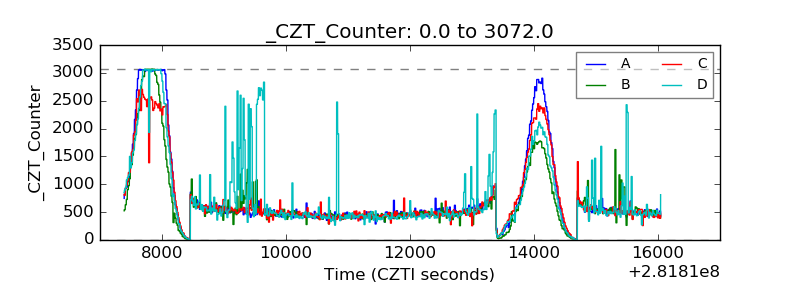 |
| +2.5 Volts monitor |  |
| +5 Volts monitor |  |
| _ROLL_ROT | 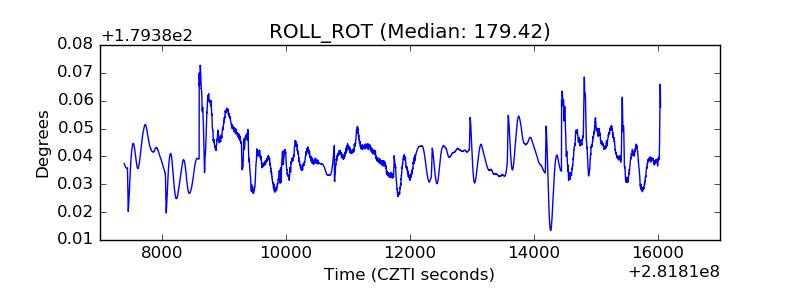 |
| _Roll_DEC | 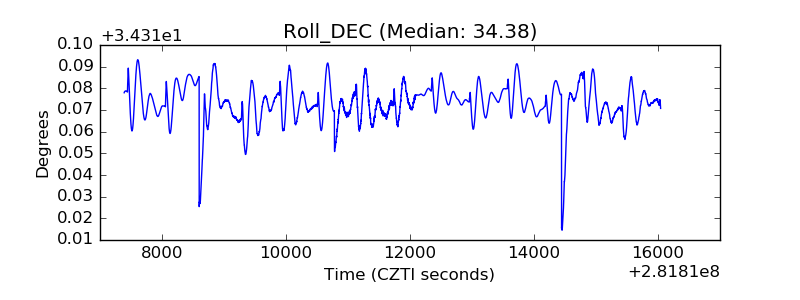 |
| _Roll_RA | 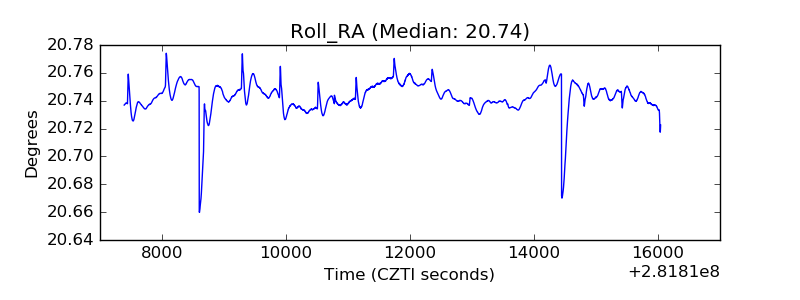 |
| Veto Counter | 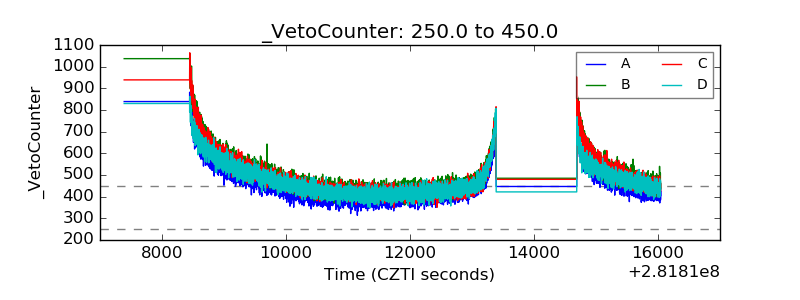 |