| Param | Original file | Final file |
|---|---|---|
| Filename | modeM0/AS1A05_185T04_9000002552_17257cztM0_level2.evt | modeM0/AS1A05_185T04_9000002552_17257cztM0_level2_quad_clean.evt |
| Size (bytes) | 466,004,160 | 91,025,280 |
| Size | 444.4 MB | 86.8 MB |
| Events in quadrant A | 3,318,164 | 578,953 |
| Events in quadrant B | 3,516,929 | 576,789 |
| Events in quadrant C | 3,333,179 | 553,515 |
| Events in quadrant D | 3,459,416 | 550,135 |
| Mode M9 | |||
|---|---|---|---|
| Quadrant | BADHDUFLAG | Total packets | Discarded packets |
| A | 0 | 12 | 0 |
| B | 0 | 13 | 0 |
| C | 0 | 13 | 0 |
| D | 0 | 13 | 0 |
| Mode SS | |||
|---|---|---|---|
| Quadrant | BADHDUFLAG | Total packets | Discarded packets |
| A | 0 | 144 | 0 |
| B | 0 | 144 | 0 |
| C | 0 | 144 | 0 |
| D | 0 | 144 | 0 |
| Mode M0 | |||
|---|---|---|---|
| Quadrant | BADHDUFLAG | Total packets | Discarded packets |
| A | 0 | 14567 | 2 |
| B | 0 | 15320 | 2 |
| C | 0 | 14637 | 3 |
| D | 0 | 15360 | 2 |
| Quadrant | Total seconds | Saturated seconds | Saturation percentage |
|---|---|---|---|
| A | 7142 | 17 | 0.238029% |
| B | 7142 | 97 | 1.358163% |
| C | 7141 | 61 | 0.854222% |
| D | 7141 | 40 | 0.560146% |
Noise dominated data is calculated using 1-second bins in cleaned event files. If a bin has >2000 counts, and if more than 50% of those come from <1% of pixels, then it is considered to be noise-dominated and hence unusable.
| Quadrant | # 1 sec bins | Bins with >0 counts | Bins with >2000 counts | High rate bins dominated by noise | Noise dominated (total time) | Noise dominated (detector-on time) | Marked lightcurve |
|---|---|---|---|---|---|---|---|
| A | 7677 | 7143 | 0 | 0 | 0.00% | 0.00% | 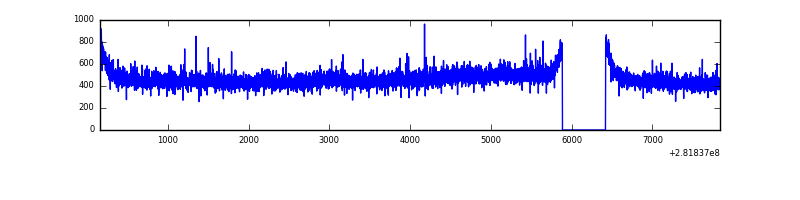 |
| B | 7677 | 7143 | 37 | 37 | 0.48% | 0.52% | 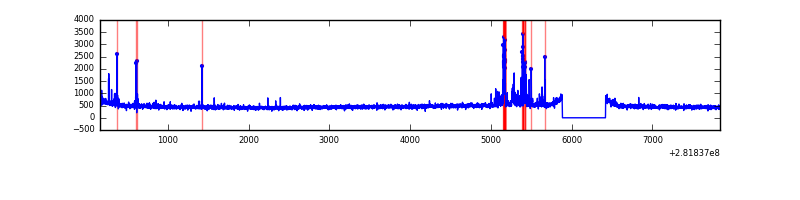 |
| C | 7676 | 7142 | 0 | 0 | 0.00% | 0.00% | 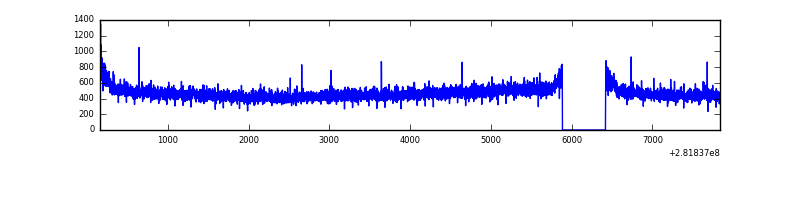 |
| D | 7676 | 7142 | 18 | 18 | 0.23% | 0.25% | 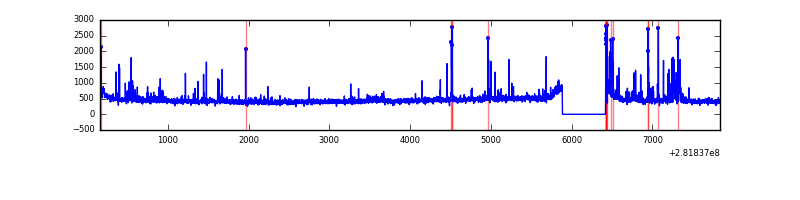 |
Top three noisy pixels from each quadrant. If the there are fewer than three noisy pixels in the level2.evt file, extra rows are filled as -1
| Pixel properties | Quadrant properties | ||||||
|---|---|---|---|---|---|---|---|
| Quadrant | DetID | PixID | Counts | Sigma | Mean | Median | Sigma |
| A | 0 | 23 | 82218 | 474.22 | 839 | 819 | 171.6 |
| A | 0 | 226 | 12393 | 67.43 | 839 | 819 | 171.6 |
| A | 12 | 194 | 6167 | 31.16 | 839 | 819 | 171.6 |
| B | 7 | 220 | 160461 | 984.98 | 839 | 816 | 162.1 |
| B | 0 | 197 | 37262 | 224.86 | 839 | 816 | 162.1 |
| B | 12 | 111 | 18975 | 112.04 | 839 | 816 | 162.1 |
| C | 14 | 238 | 125340 | 654.78 | 810 | 812 | 190.2 |
| C | 3 | 233 | 41183 | 212.27 | 810 | 812 | 190.2 |
| C | 0 | 79 | 7091 | 33.02 | 810 | 812 | 190.2 |
| D | 10 | 70 | 108013 | 537.12 | 819 | 793 | 199.6 |
| D | 1 | 52 | 70696 | 350.18 | 819 | 793 | 199.6 |
| D | 13 | 189 | 61215 | 302.69 | 819 | 793 | 199.6 |
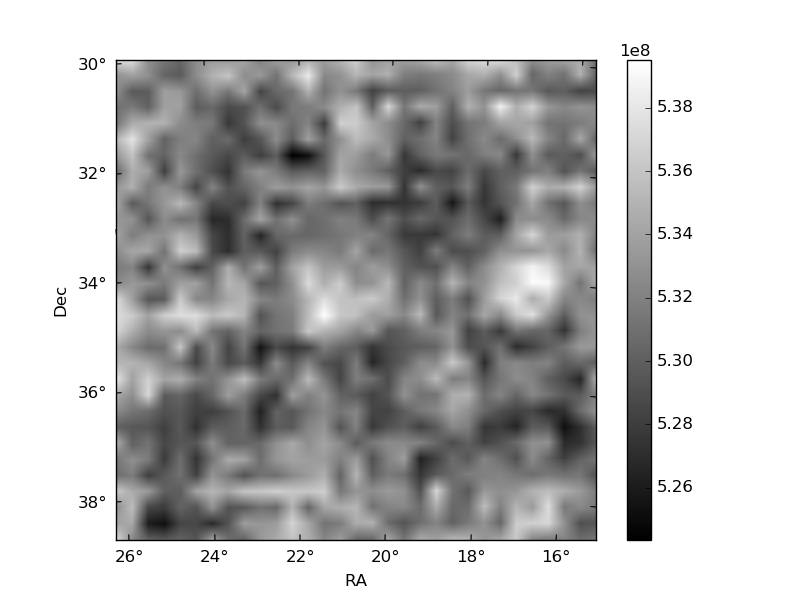
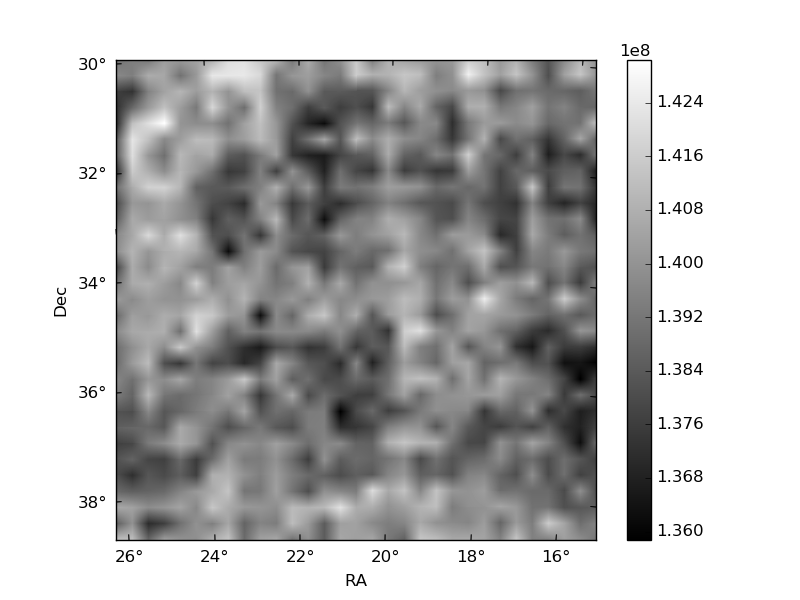
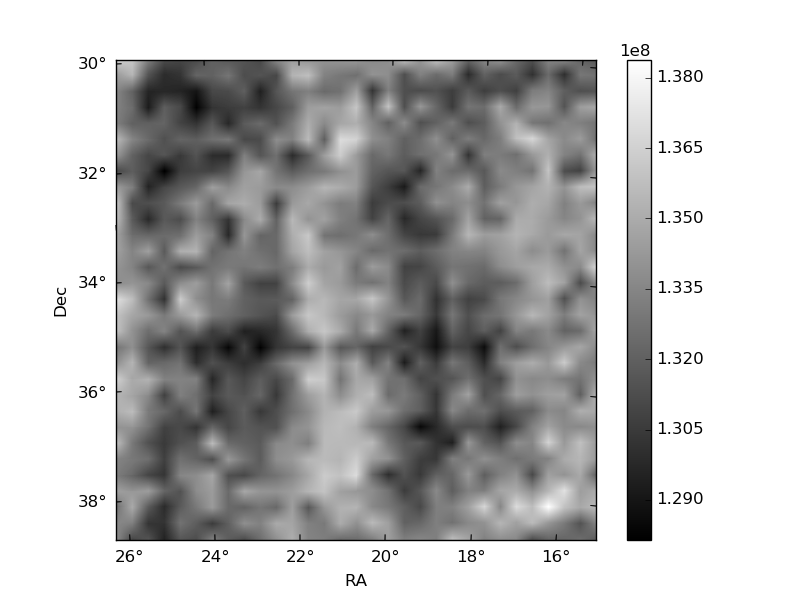
Histogram calculated using DETX and DETY for each event in the final _common_clean file
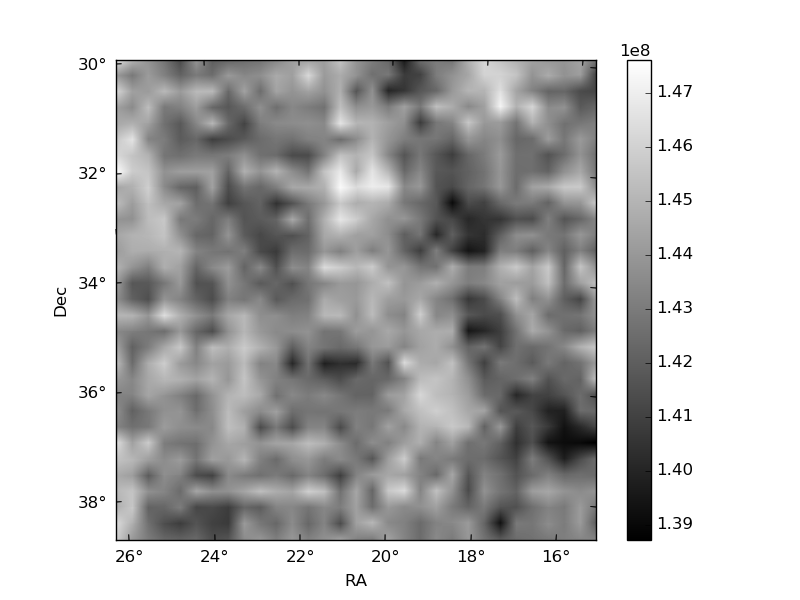
| Quadrant A | 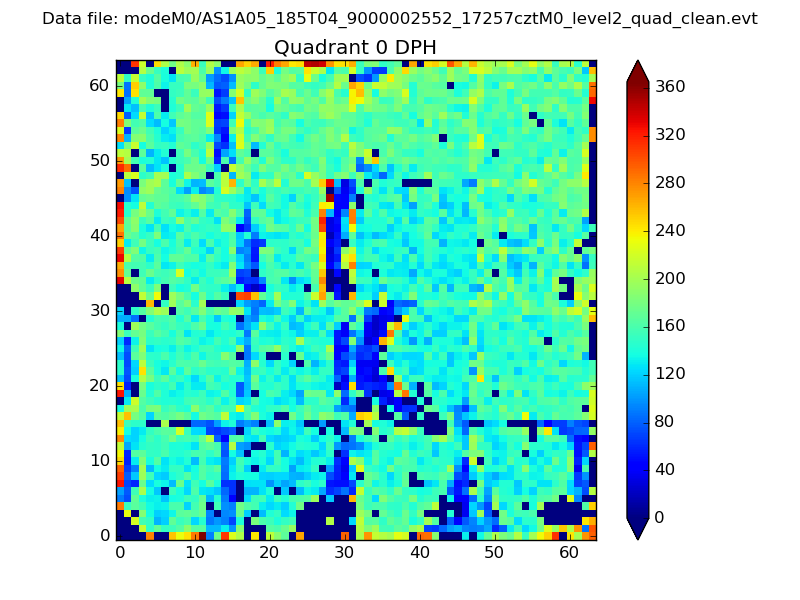 |
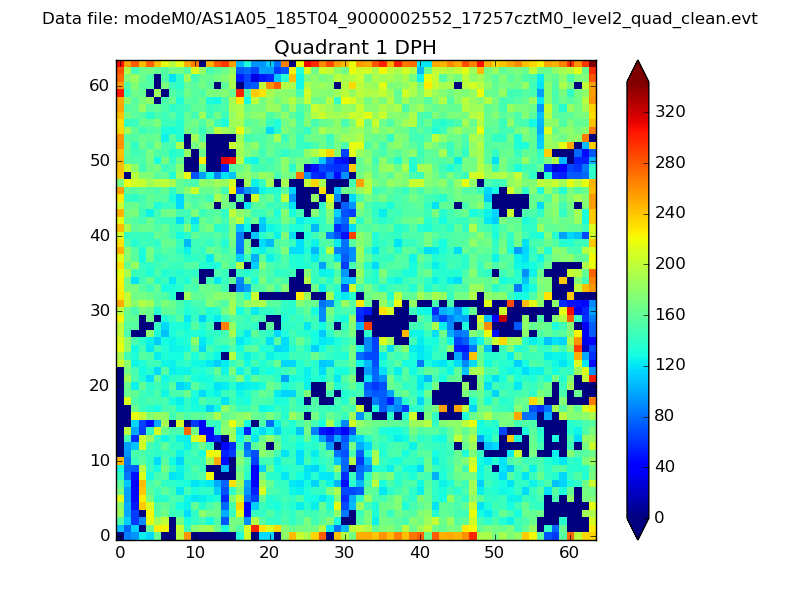 |
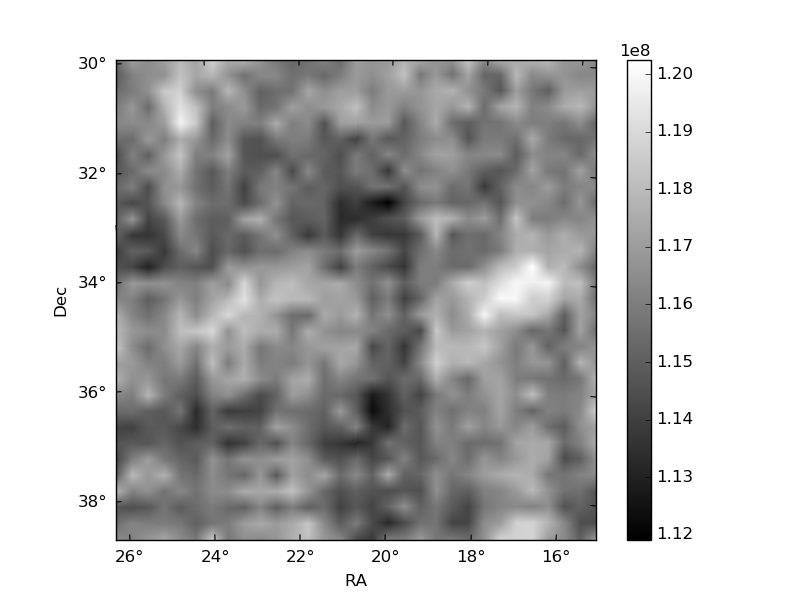
Quadrant B |
|---|---|---|---|
| Quadrant D | 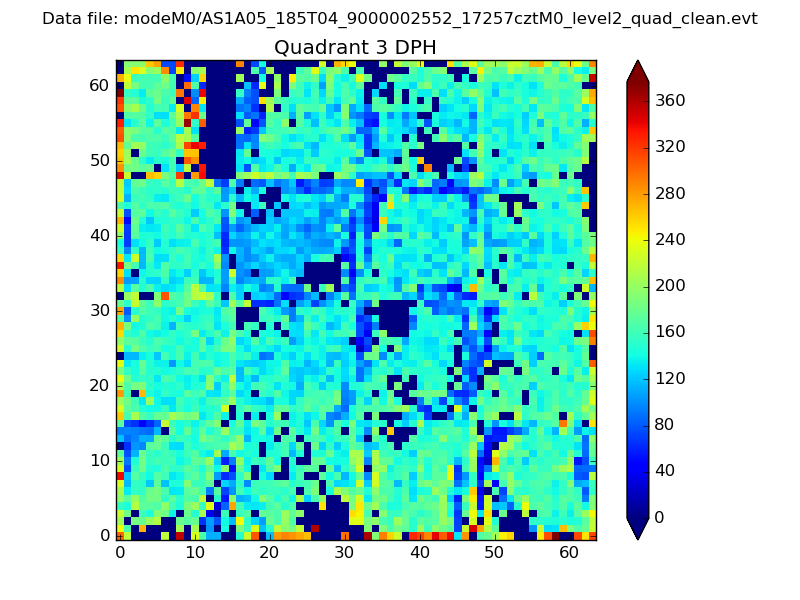 |
 |
Quadrant C |
| Plot type | Count rate plots | Images |
|---|---|---|
| Comparison with Poisson distribution Blue bars denote a histogram of data divided into 1 sec bins. Red curve is a Poisson curve with rate = median count rate of data. |
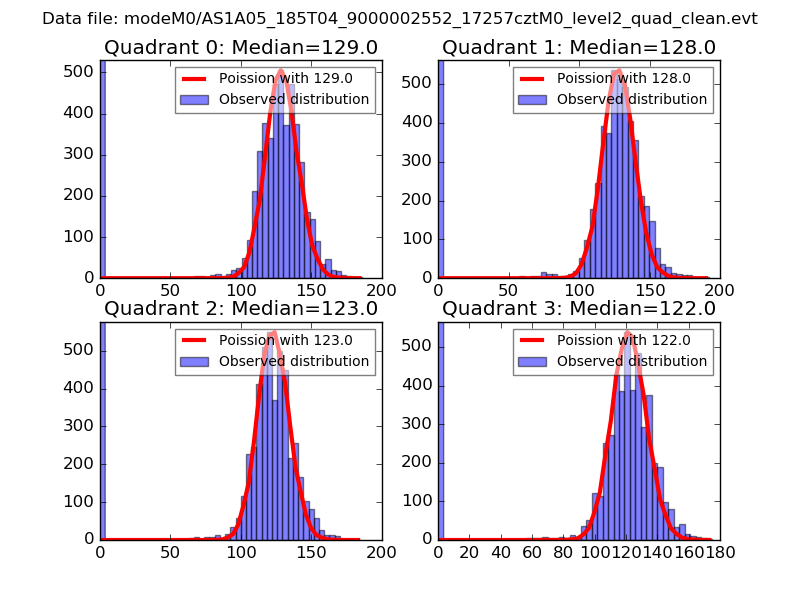 |
 |
| Quadrant-wise count rates Data is divided into 100 sec bins |
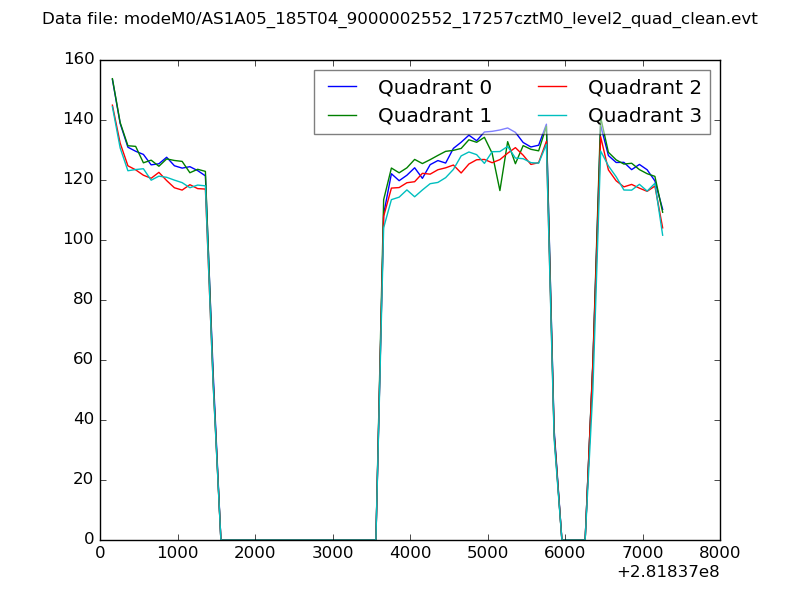 |
|
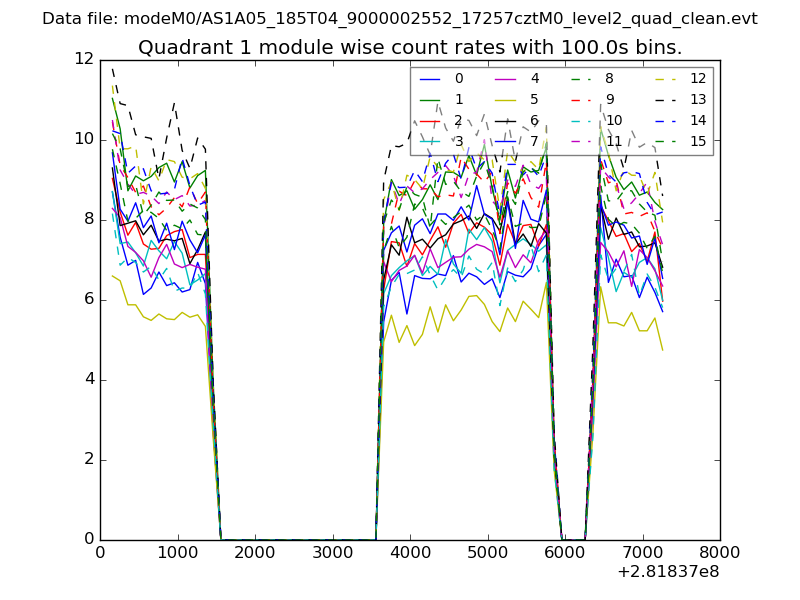
| Module-wise count rates for Quadrant A Data is divided into 100 sec bins |
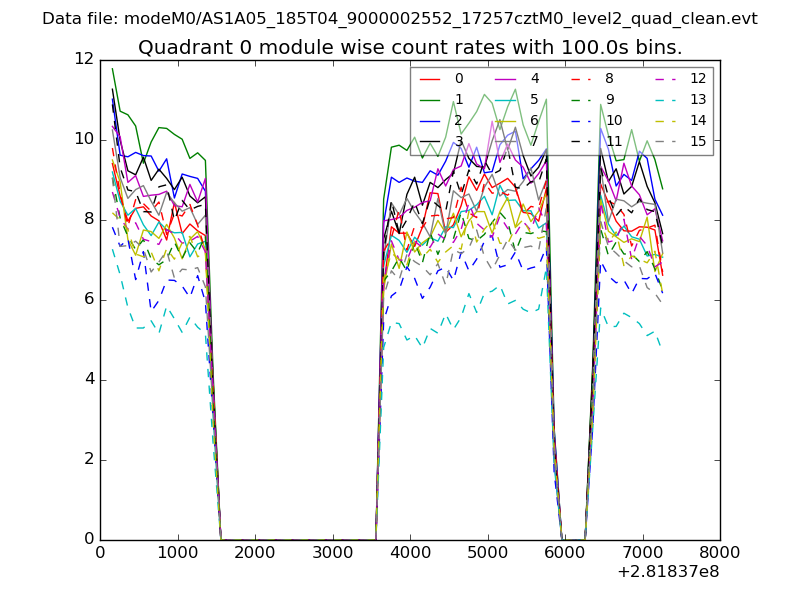 |
 |
| Module-wise count rates for Quadrant B Data is divided into 100 sec bins |
 |
 |
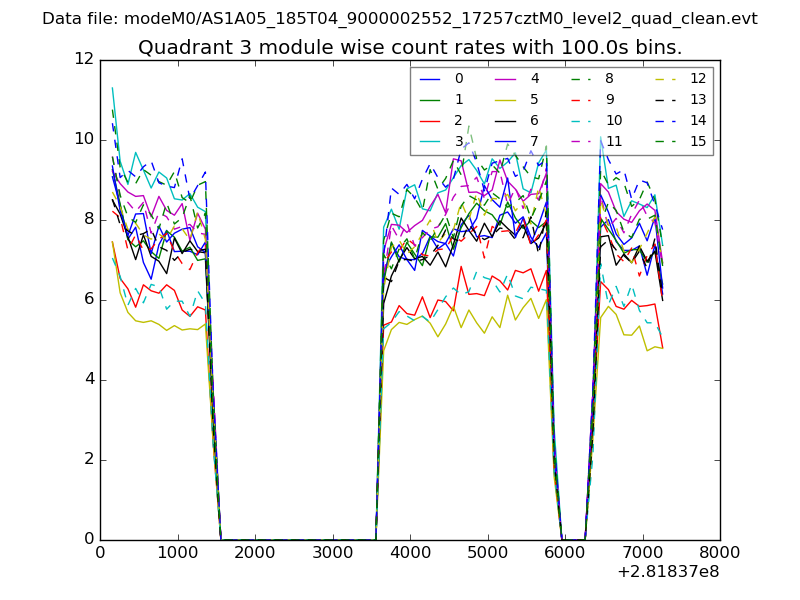
| Module-wise count rates for Quadrant C Data is divided into 100 sec bins |
 |
 |
| Module-wise count rates for Quadrant D Data is divided into 100 sec bins |
 |
 |
| Parameter | Plot |
|---|---|
| CZT HV Monitor | 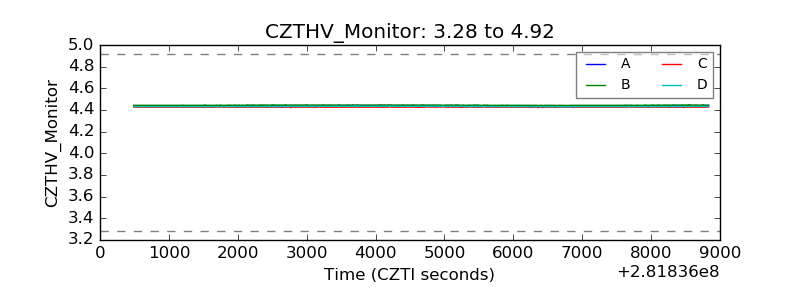 |
| D_VDD | 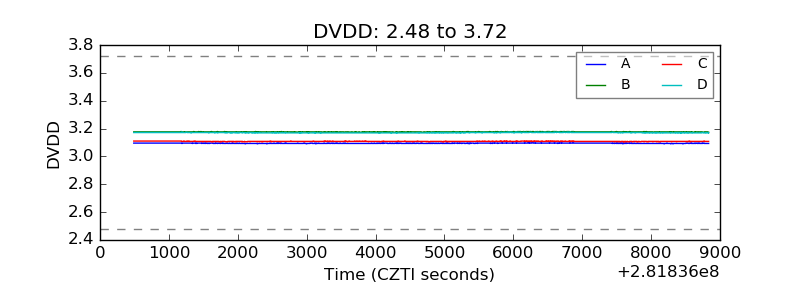 |
| Temperature 1 | 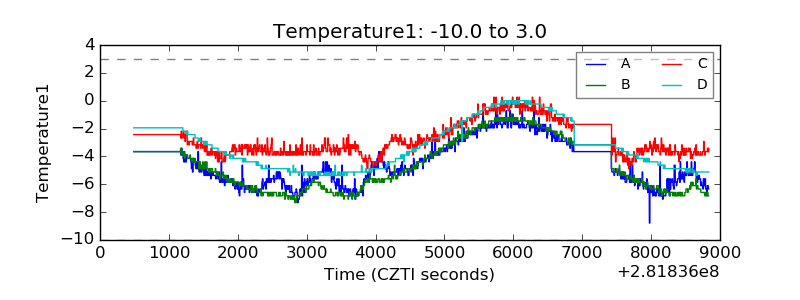 |
| Veto HV Monitor | 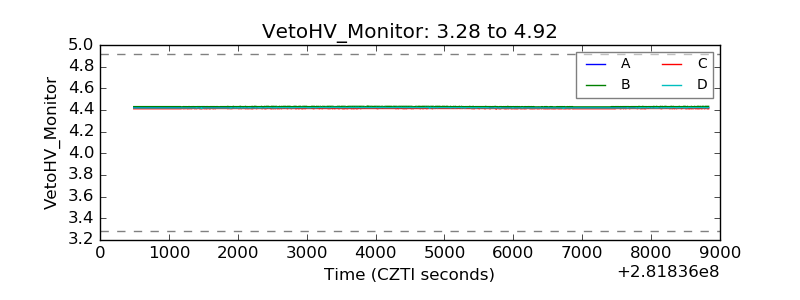 |
| Veto LLD |  |
| Alpha Counter | 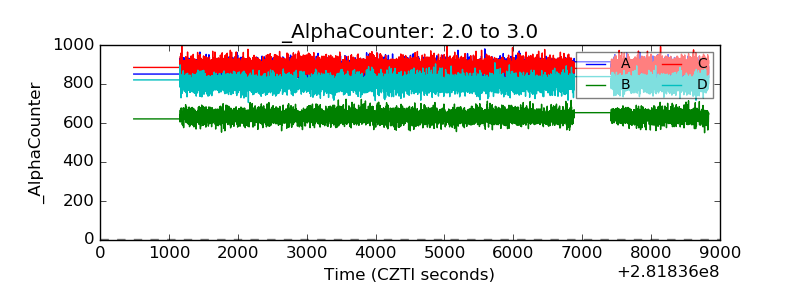 |
| _CPM_Rate | 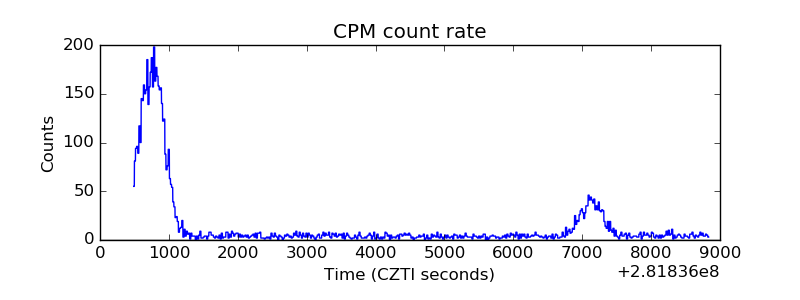 |
| CZT Counter | 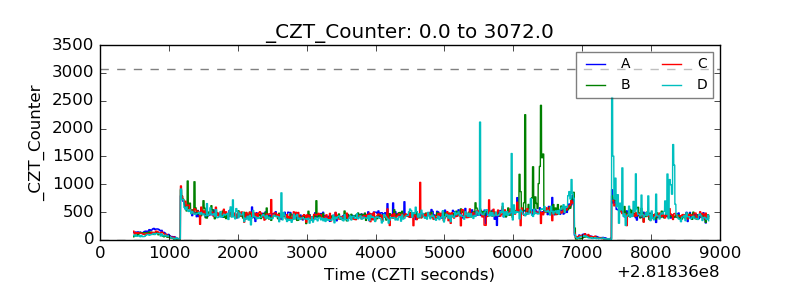 |
| +2.5 Volts monitor |  |
| +5 Volts monitor | 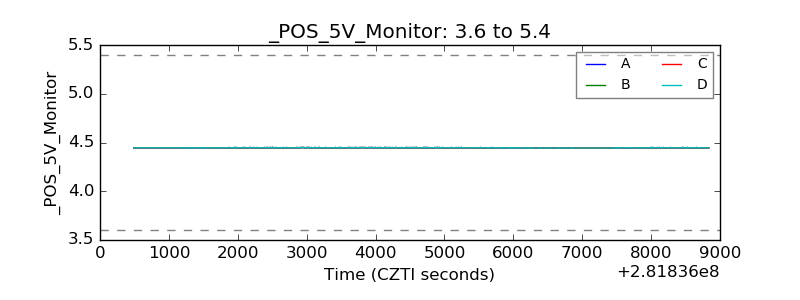 |
| _ROLL_ROT | 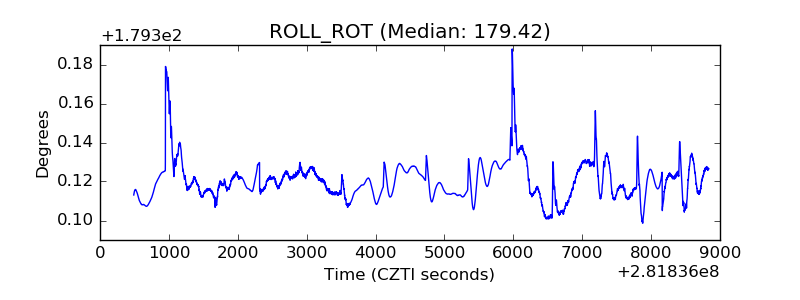 |
| _Roll_DEC | 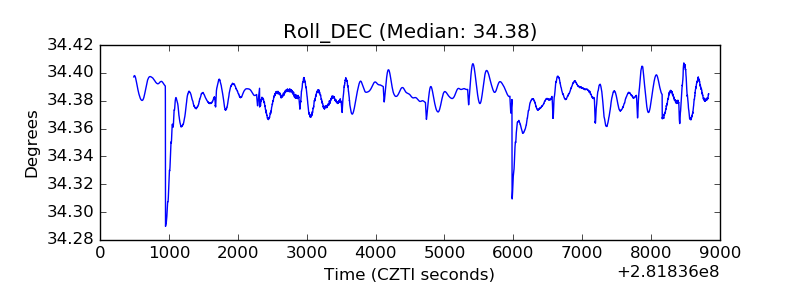 |
| _Roll_RA | 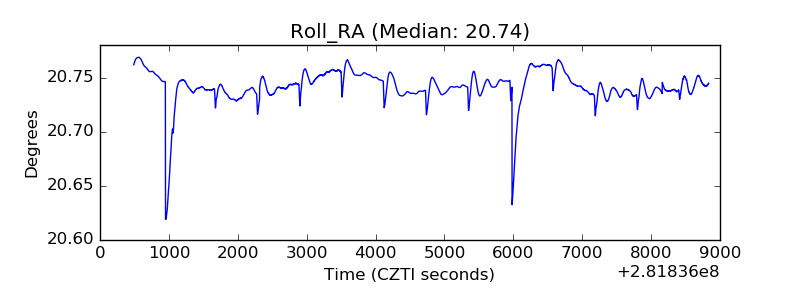 |
| Veto Counter | 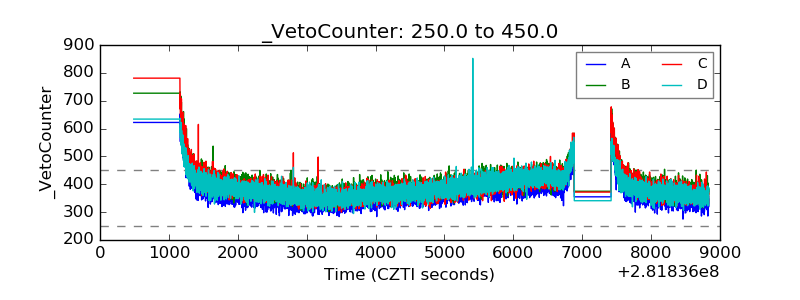 |