| Param | Original file | Final file |
|---|---|---|
| Filename | modeM0/AS1A05_185T04_9000002552_17263cztM0_level2.evt | modeM0/AS1A05_185T04_9000002552_17263cztM0_level2_quad_clean.evt |
| Size (bytes) | 259,338,240 | 42,744,960 |
| Size | 247.3 MB | 40.8 MB |
| Events in quadrant A | 1,837,871 | 254,556 |
| Events in quadrant B | 1,918,284 | 254,908 |
| Events in quadrant C | 1,847,060 | 244,445 |
| Events in quadrant D | 1,961,779 | 242,338 |
| Mode SS | |||
|---|---|---|---|
| Quadrant | BADHDUFLAG | Total packets | Discarded packets |
| A | 0 | 86 | 0 |
| B | 0 | 86 | 0 |
| C | 0 | 86 | 0 |
| D | 0 | 86 | 0 |
| Mode M0 | |||
|---|---|---|---|
| Quadrant | BADHDUFLAG | Total packets | Discarded packets |
| A | 0 | 8469 | 0 |
| B | 0 | 8646 | 0 |
| C | 0 | 8460 | 0 |
| D | 0 | 9006 | 0 |
| Quadrant | Total seconds | Saturated seconds | Saturation percentage |
|---|---|---|---|
| A | 4220 | 3 | 0.071090% |
| B | 4221 | 5 | 0.118455% |
| C | 4221 | 8 | 0.189529% |
| D | 4221 | 22 | 0.521204% |
Noise dominated data is calculated using 1-second bins in cleaned event files. If a bin has >2000 counts, and if more than 50% of those come from <1% of pixels, then it is considered to be noise-dominated and hence unusable.
| Quadrant | # 1 sec bins | Bins with >0 counts | Bins with >2000 counts | High rate bins dominated by noise | Noise dominated (total time) | Noise dominated (detector-on time) | Marked lightcurve |
|---|---|---|---|---|---|---|---|
| A | 4220 | 4220 | 0 | 0 | 0.00% | 0.00% | 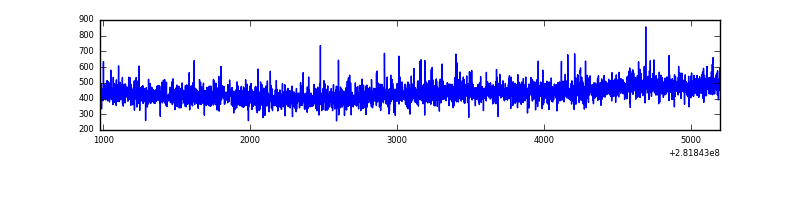 |
| B | 4221 | 4221 | 2 | 2 | 0.05% | 0.05% | 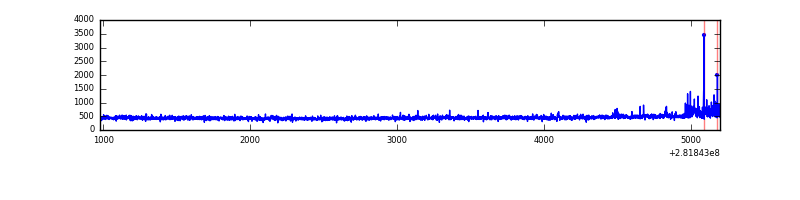 |
| C | 4221 | 4221 | 0 | 0 | 0.00% | 0.00% | 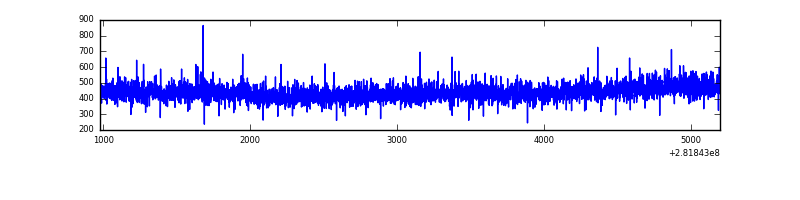 |
| D | 4221 | 4221 | 20 | 20 | 0.47% | 0.47% | 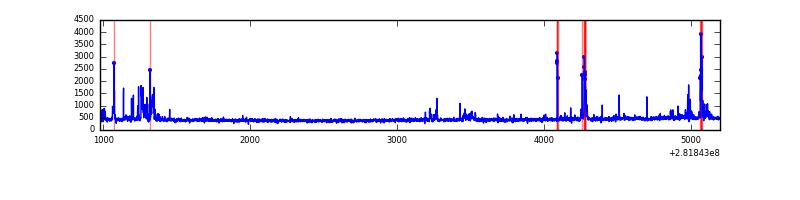 |
Top three noisy pixels from each quadrant. If the there are fewer than three noisy pixels in the level2.evt file, extra rows are filled as -1
| Pixel properties | Quadrant properties | ||||||
|---|---|---|---|---|---|---|---|
| Quadrant | DetID | PixID | Counts | Sigma | Mean | Median | Sigma |
| A | 0 | 23 | 11852 | 117.47 | 474 | 464 | 96.9 |
| A | 0 | 226 | 4746 | 44.17 | 474 | 464 | 96.9 |
| A | 3 | 137 | 3531 | 31.64 | 474 | 464 | 96.9 |
| B | 7 | 220 | 46848 | 497.99 | 473 | 461 | 93.1 |
| B | 12 | 111 | 10933 | 112.42 | 473 | 461 | 93.1 |
| B | 11 | 111 | 9224 | 94.08 | 473 | 461 | 93.1 |
| C | 14 | 238 | 71162 | 662.54 | 453 | 455 | 106.7 |
| C | 3 | 233 | 9589 | 85.59 | 453 | 455 | 106.7 |
| C | 13 | 61 | 3286 | 26.53 | 453 | 455 | 106.7 |
| D | 1 | 52 | 88991 | 784.13 | 459 | 446 | 112.9 |
| D | 11 | 176 | 52292 | 459.13 | 459 | 446 | 112.9 |
| D | 10 | 70 | 35803 | 313.11 | 459 | 446 | 112.9 |
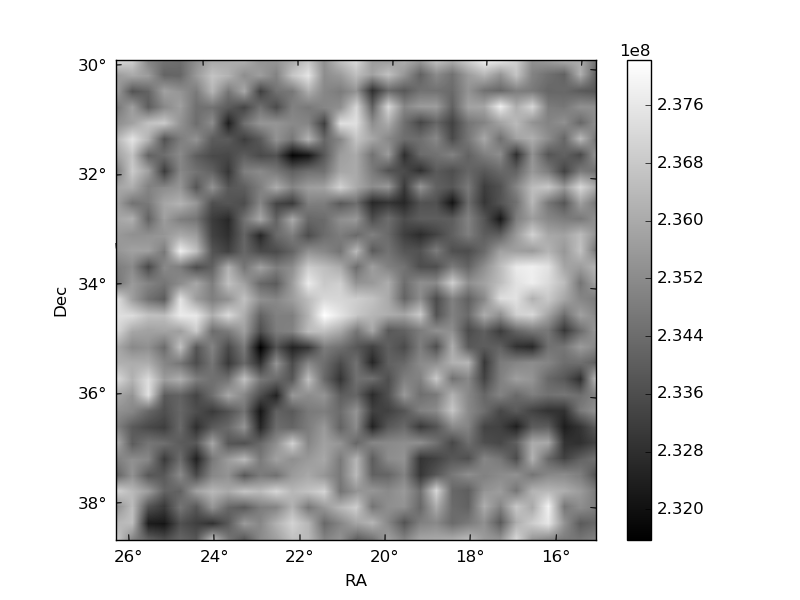
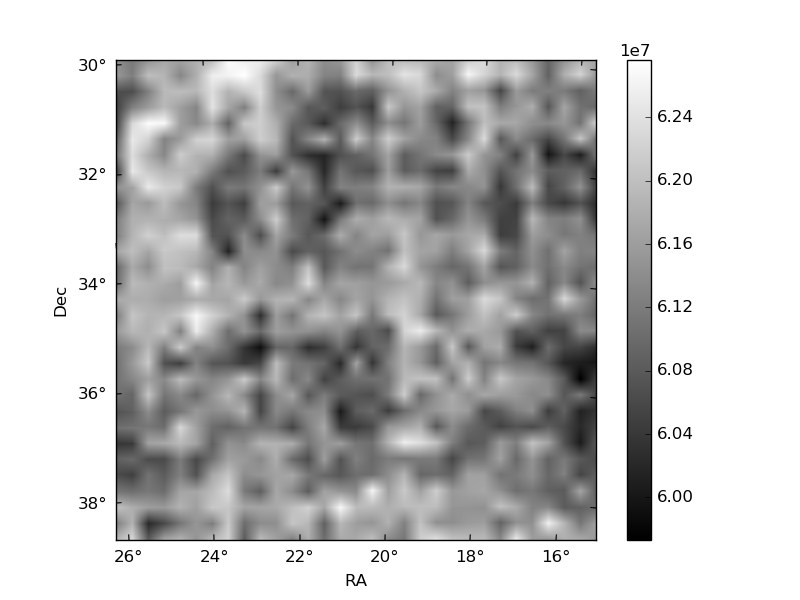
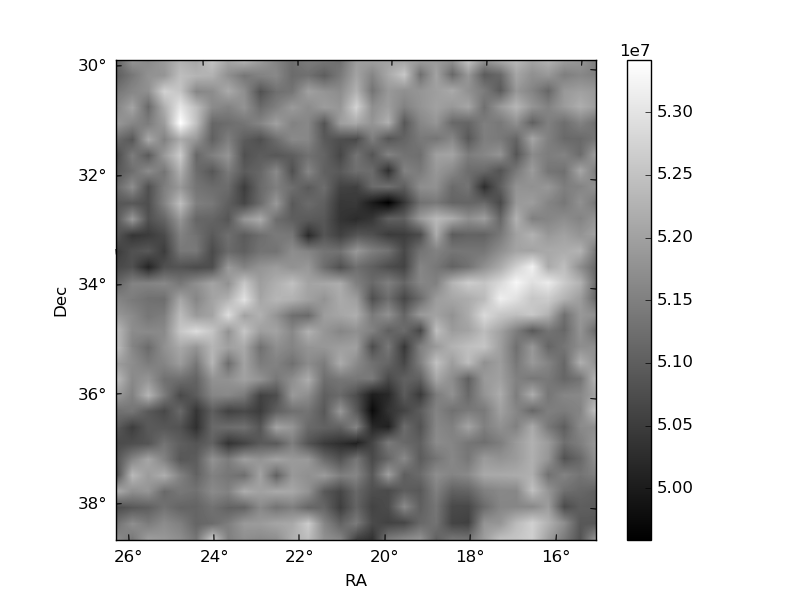
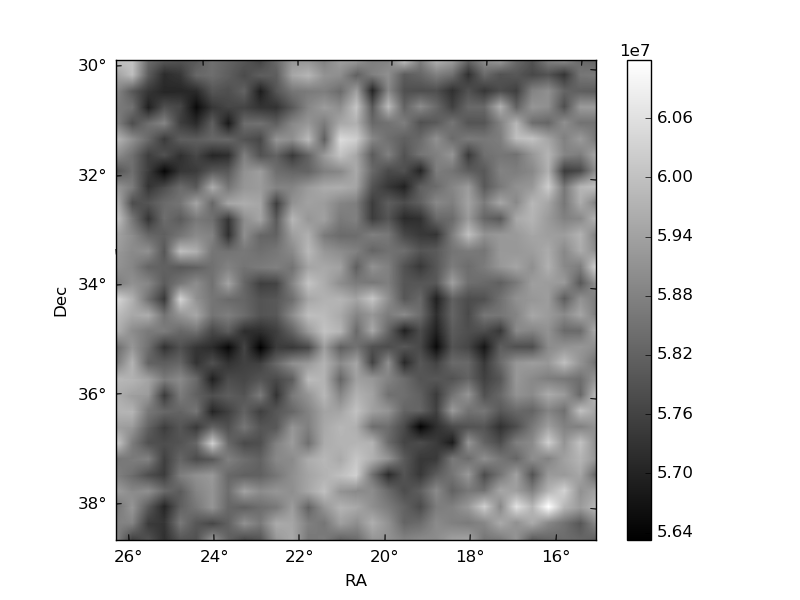
Histogram calculated using DETX and DETY for each event in the final _common_clean file
| Quadrant A | 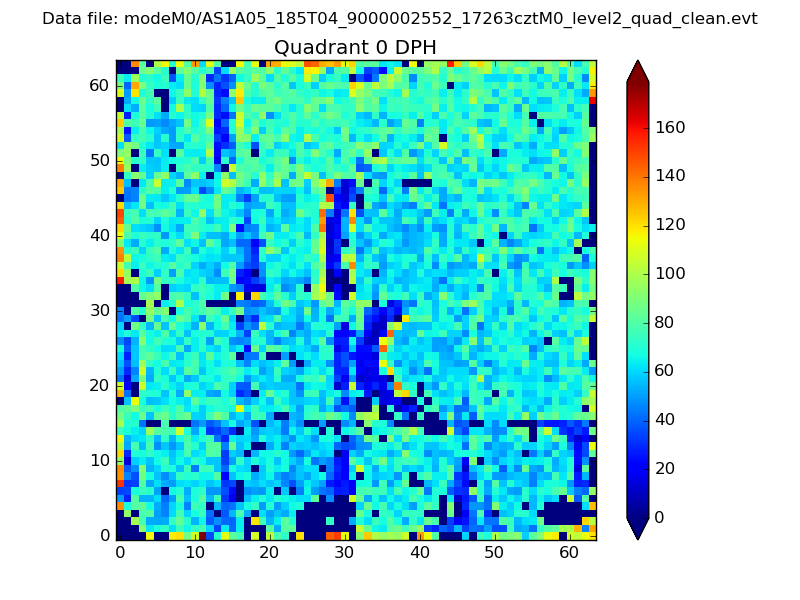 |
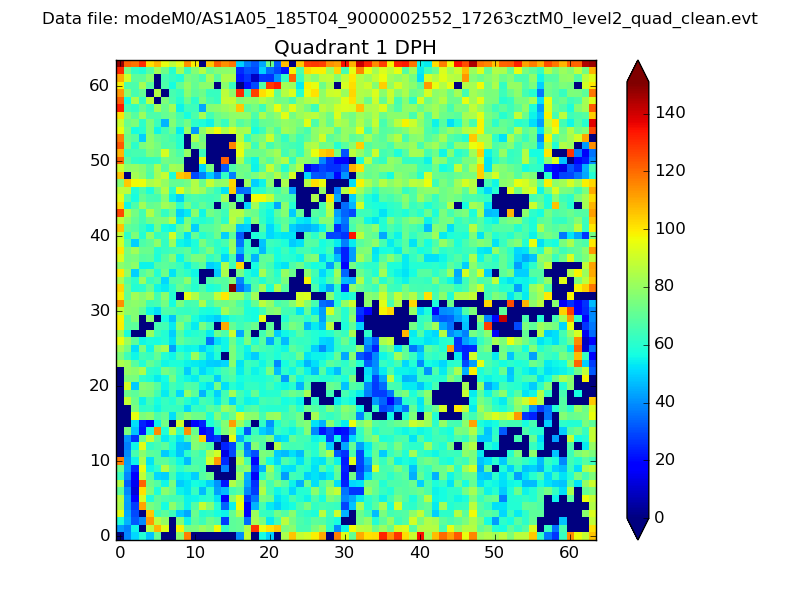 |
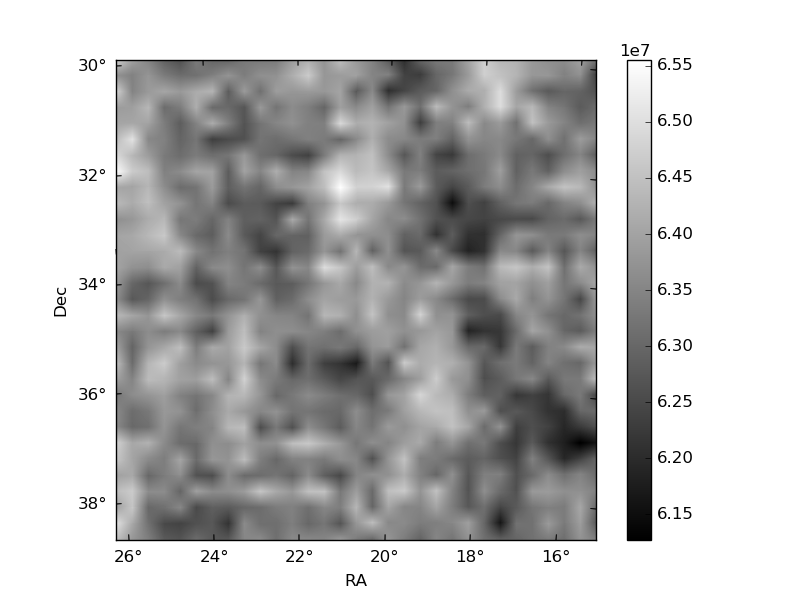
Quadrant B |
|---|---|---|---|
| Quadrant D | 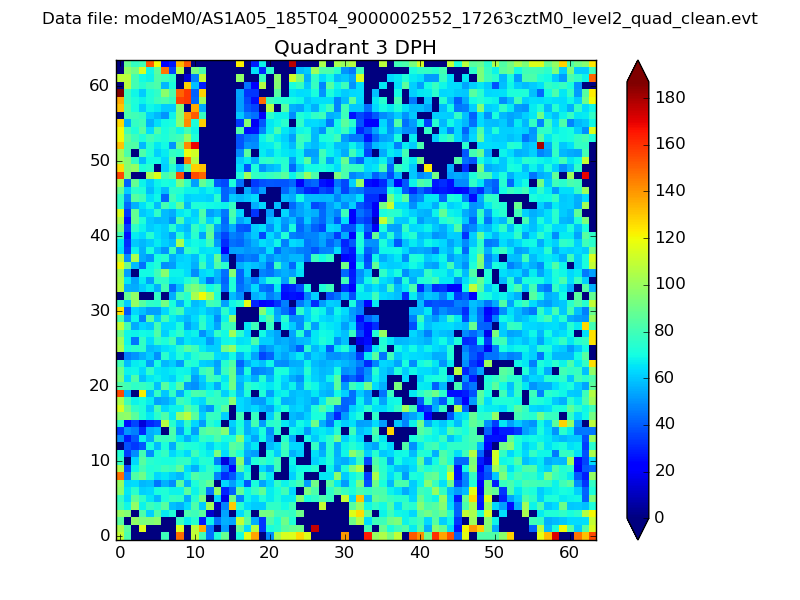 |
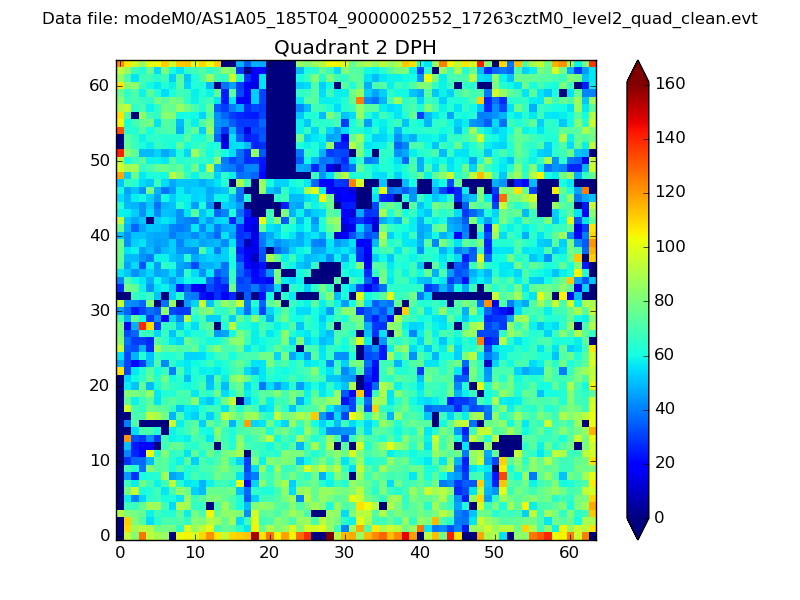 |
Quadrant C |
| Plot type | Count rate plots | Images |
|---|---|---|
| Comparison with Poisson distribution Blue bars denote a histogram of data divided into 1 sec bins. Red curve is a Poisson curve with rate = median count rate of data. |
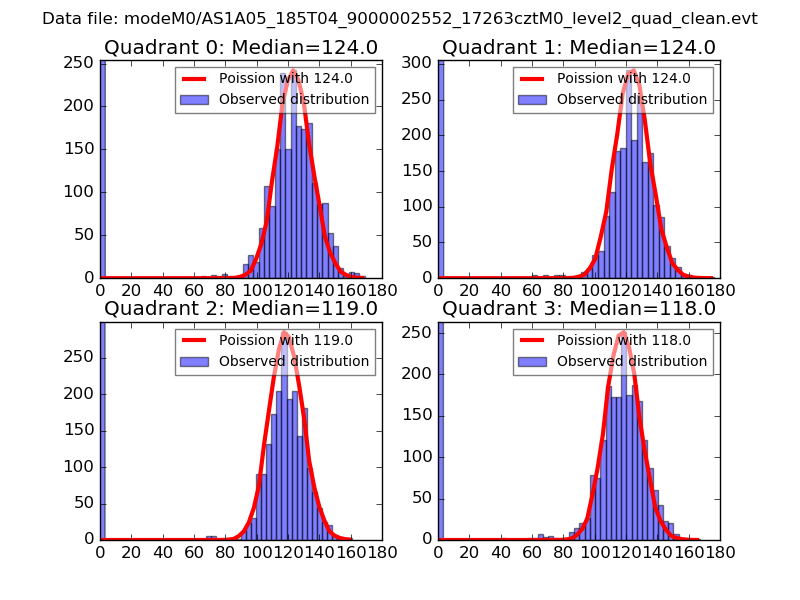 |
 |
| Quadrant-wise count rates Data is divided into 100 sec bins |
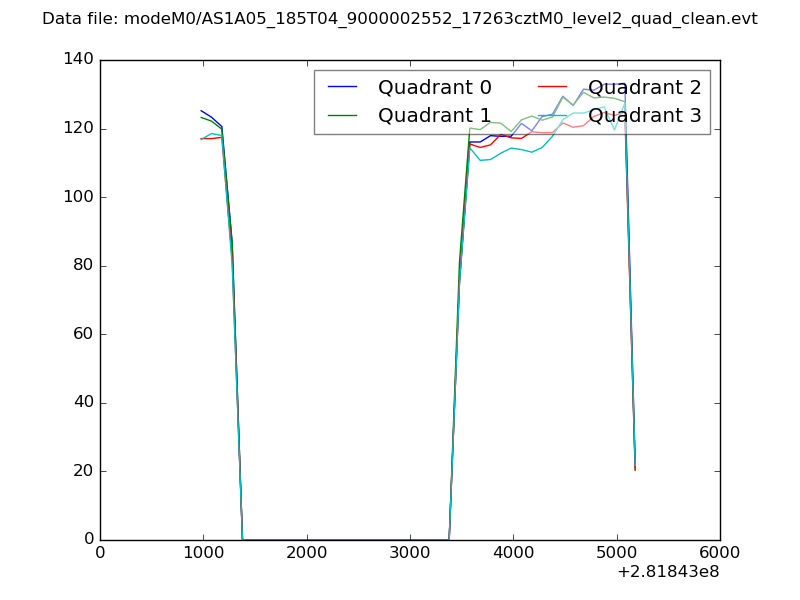 |
|
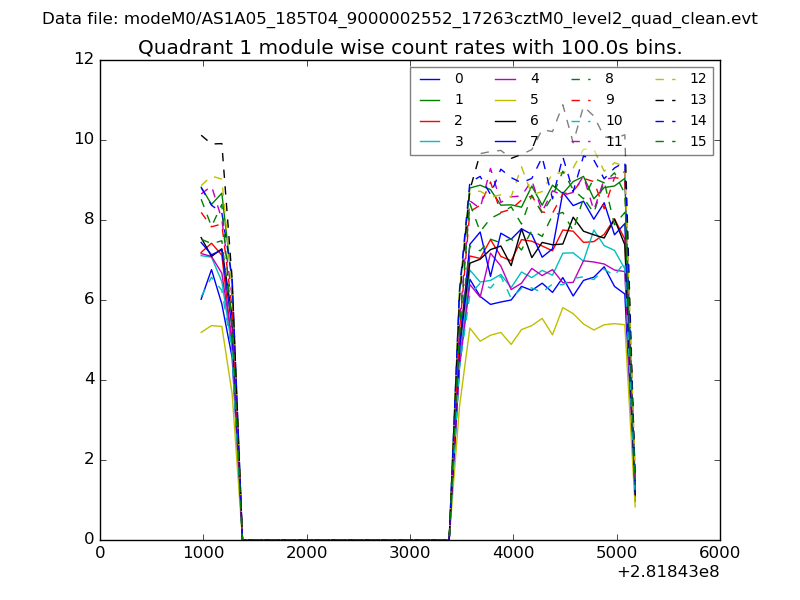
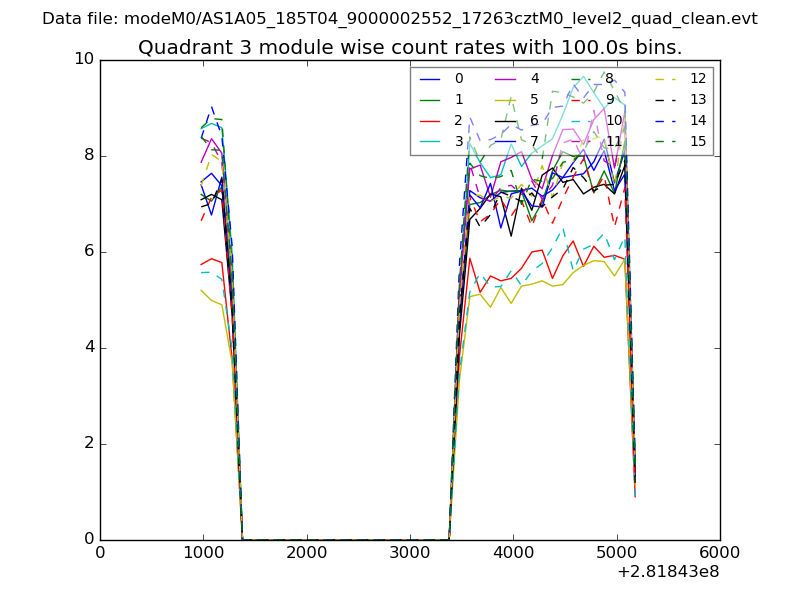
| Module-wise count rates for Quadrant A Data is divided into 100 sec bins |
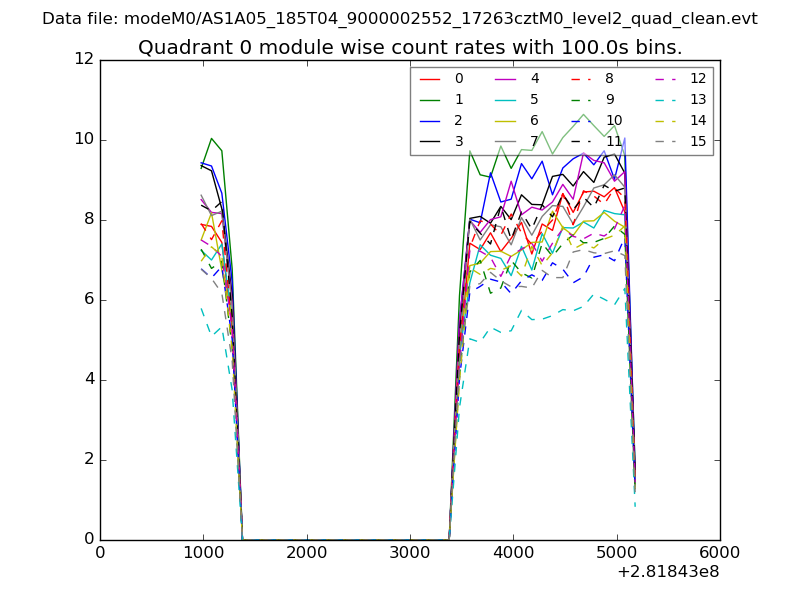 |
 |
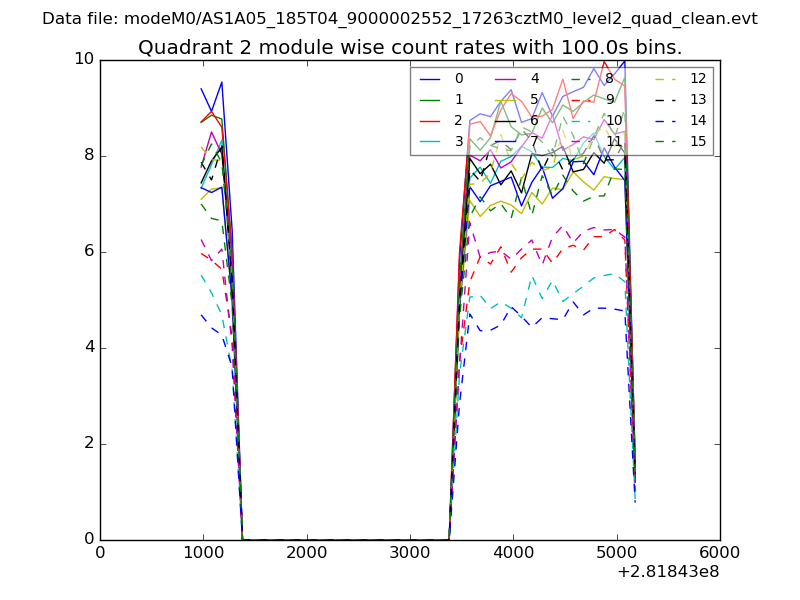
| Module-wise count rates for Quadrant B Data is divided into 100 sec bins |
 |
 |
| Module-wise count rates for Quadrant C Data is divided into 100 sec bins |
 |
 |
| Module-wise count rates for Quadrant D Data is divided into 100 sec bins |
 |
 |
| Parameter | Plot |
|---|---|
| CZT HV Monitor | 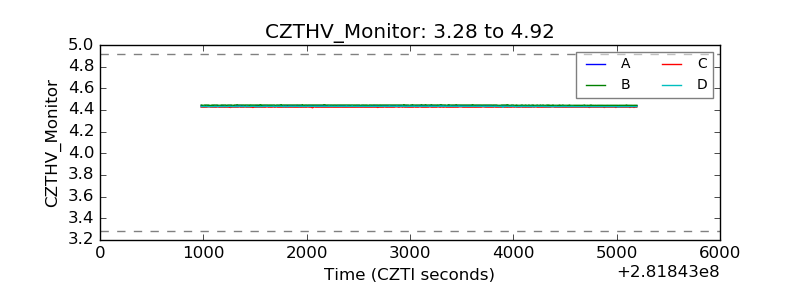 |
| D_VDD | 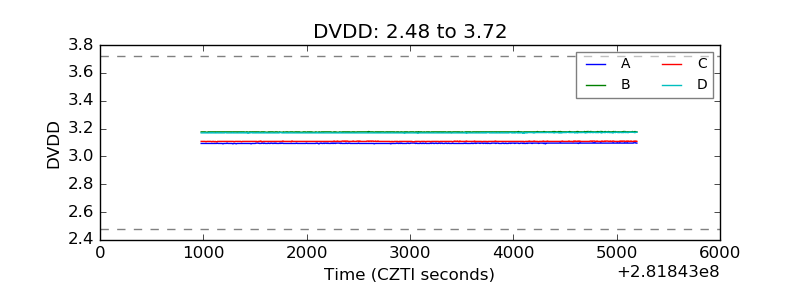 |
| Temperature 1 | 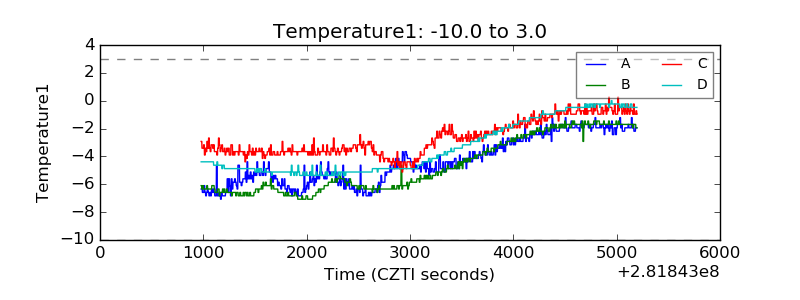 |
| Veto HV Monitor | 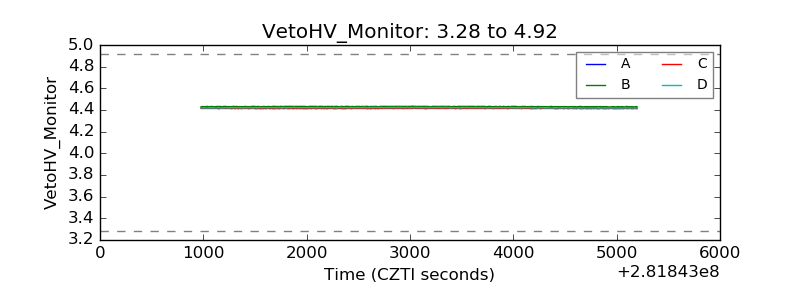 |
| Veto LLD | 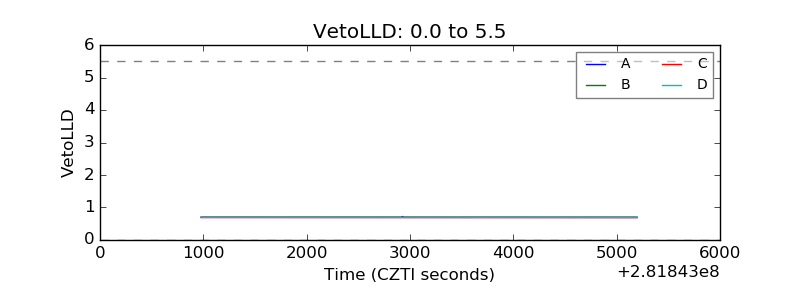 |
| Alpha Counter | 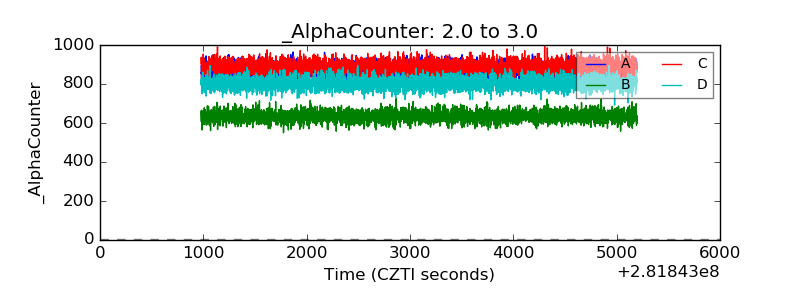 |
| _CPM_Rate | 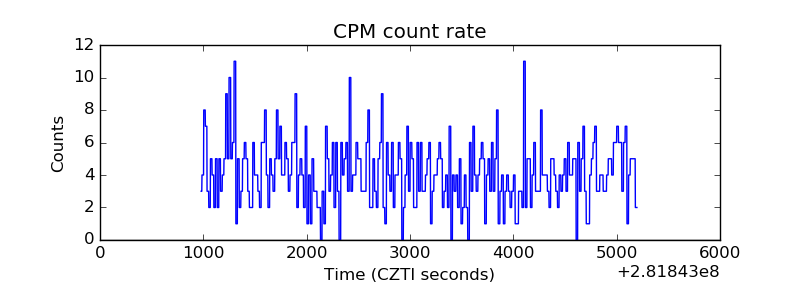 |
| CZT Counter | 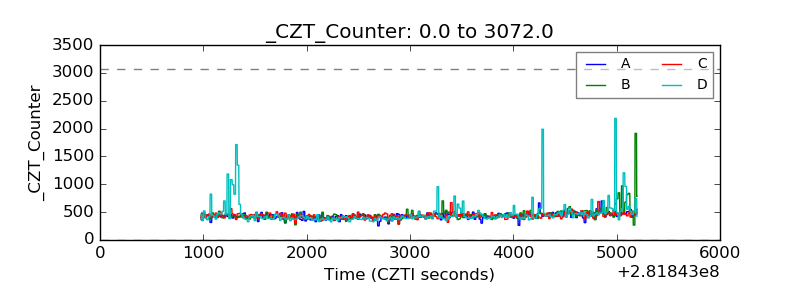 |
| +2.5 Volts monitor |  |
| +5 Volts monitor |  |
| _ROLL_ROT | 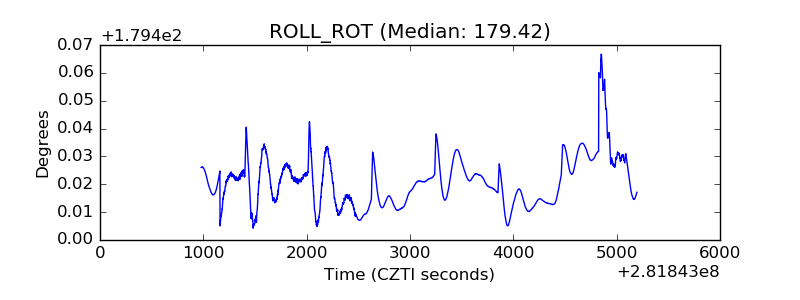 |
| _Roll_DEC | 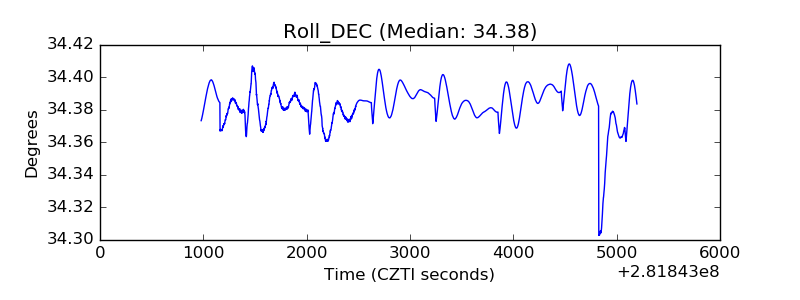 |
| _Roll_RA | 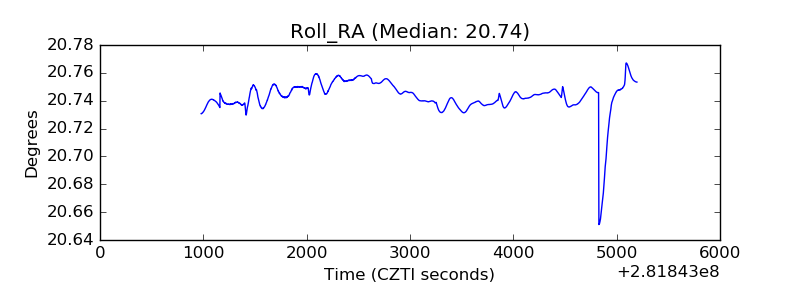 |
| Veto Counter | 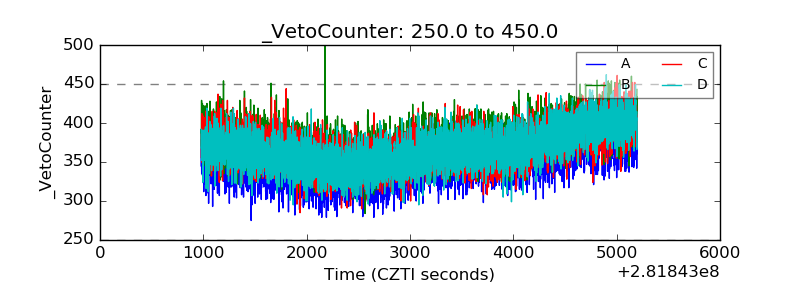 |