| Param | Original file | Final file |
|---|---|---|
| Filename | modeM0/AS1T03_059T01_9000002554cztM0_level2.fits | modeM0/AS1T03_059T01_9000002554cztM0_level2_quad_clean.evt |
| Size (bytes) | 1,246,043,520 | 1,168,545,600 |
| Size | 1.2 GB | 1.1 GB |
| Events in quadrant A | 7,631,652 | 6,975,128 |
| Events in quadrant B | 7,511,178 | 7,123,853 |
| Events in quadrant C | 7,512,210 | 6,652,535 |
| Events in quadrant D | 6,089,888 | 5,655,437 |
| Mode M9 | |||
|---|---|---|---|
| Quadrant | BADHDUFLAG | Total packets | Discarded packets |
| A | 0 | 218 | 0 |
| B | 0 | 218 | 0 |
| C | 0 | 218 | 0 |
| D | 0 | 218 | 0 |
| Mode SS | |||
|---|---|---|---|
| Quadrant | BADHDUFLAG | Total packets | Discarded packets |
| A | 0 | 2670 | 0 |
| B | 0 | 2670 | 0 |
| C | 0 | 2670 | 0 |
| D | 0 | 2670 | 0 |
| Mode M0 | |||
|---|---|---|---|
| Quadrant | BADHDUFLAG | Total packets | Discarded packets |
| A | 0 | 317227 | 0 |
| B | 0 | 272225 | 0 |
| C | 0 | 273231 | 0 |
| D | 0 | 427344 | 0 |
| Quadrant | Total seconds | Saturated seconds | Saturation percentage |
|---|---|---|---|
| A | 131080 | 5421 | 4.135642% |
| B | 131107 | 1654 | 1.261565% |
| C | 131107 | 2007 | 1.530811% |
| D | 131107 | 16349 | 12.469967% |
Noise dominated data is calculated using 1-second bins in cleaned event files. If a bin has >2000 counts, and if more than 50% of those come from <1% of pixels, then it is considered to be noise-dominated and hence unusable.
| Quadrant | # 1 sec bins | Bins with >0 counts | Bins with >2000 counts | High rate bins dominated by noise | Noise dominated (total time) | Noise dominated (detector-on time) | Marked lightcurve |
|---|---|---|---|---|---|---|---|
| A | 158171 | 131034 | 0 | 0 | 0.00% | 0.00% |  |
| B | 158171 | 131098 | 0 | 0 | 0.00% | 0.00% |  |
| C | 158171 | 131104 | 0 | 0 | 0.00% | 0.00% | 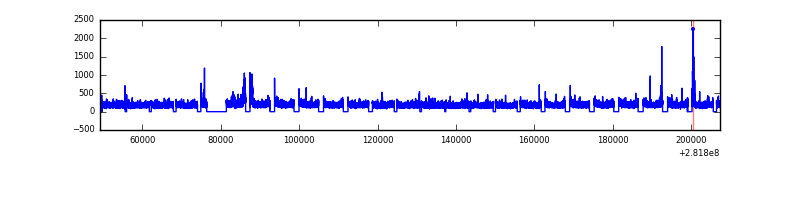 |
| D | 158171 | 131011 | 0 | 0 | 0.00% | 0.00% |  |
Top three noisy pixels from each quadrant. If the there are fewer than three noisy pixels in the level2.evt file, extra rows are filled as -1
| Pixel properties | Quadrant properties | ||||||
|---|---|---|---|---|---|---|---|
| Quadrant | DetID | PixID | Counts | Sigma | Mean | Median | Sigma |
| A | 0 | 29 | 6335 | 9.08 | 1985 | 1857 | 493.1 |
| A | 7 | 110 | 6211 | 8.83 | 1985 | 1857 | 493.1 |
| A | 9 | 19 | 5693 | 7.78 | 1985 | 1857 | 493.1 |
| B | 2 | 9 | 6039 | 10.71 | 1979 | 1887 | 387.6 |
| B | 2 | 8 | 5121 | 8.34 | 1979 | 1887 | 387.6 |
| B | 3 | 17 | 4994 | 8.02 | 1979 | 1887 | 387.6 |
| C | 1 | 81 | 5560 | 7.27 | 1981 | 1846 | 511.0 |
| C | 1 | 80 | 5496 | 7.14 | 1981 | 1846 | 511.0 |
| C | 12 | 241 | 5357 | 6.87 | 1981 | 1846 | 511.0 |
| D | 3 | 14 | 4599 | 6.54 | 1739 | 1579 | 461.5 |
| D | 6 | 231 | 4407 | 6.13 | 1739 | 1579 | 461.5 |
| D | 6 | 67 | 4326 | 5.95 | 1739 | 1579 | 461.5 |
Histogram calculated using DETX and DETY for each event in the final _common_clean file
| Quadrant A | 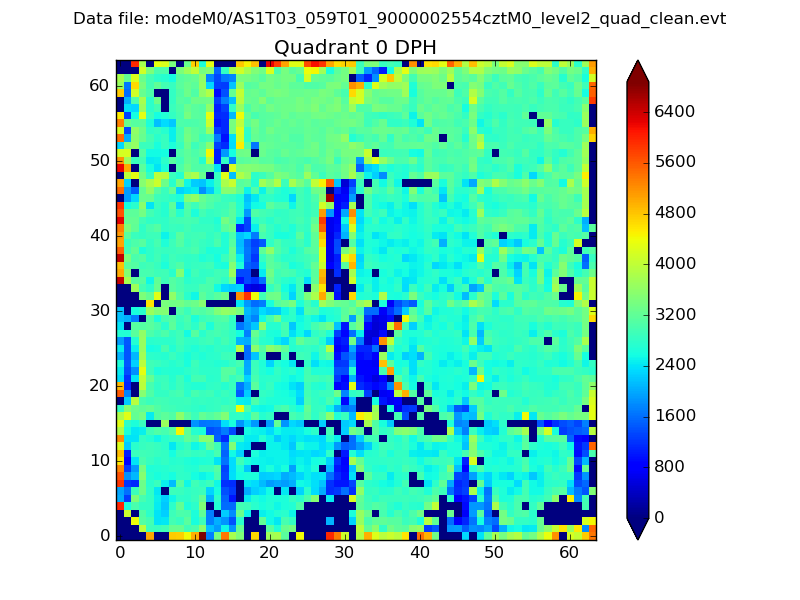 |
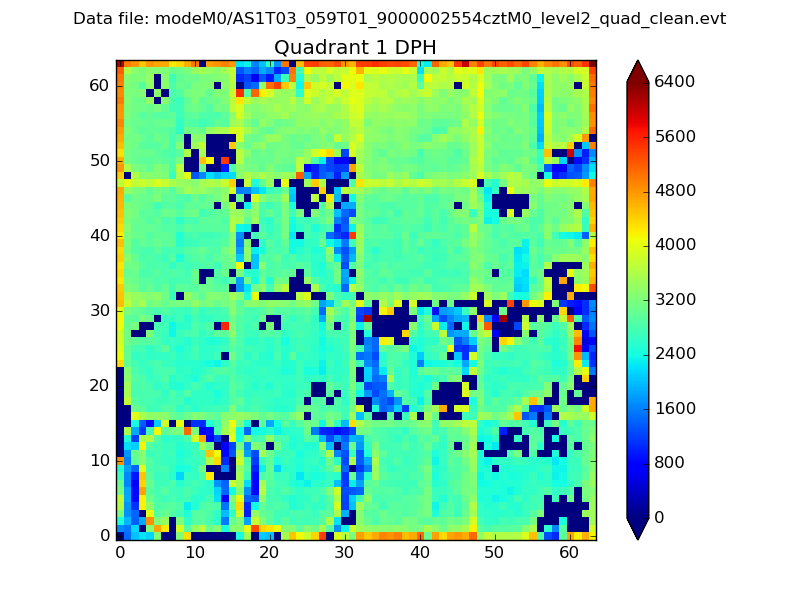 |
Quadrant B |
|---|---|---|---|
| Quadrant D |  |
 |
Quadrant C |
| Plot type | Count rate plots | Images |
|---|---|---|
| Comparison with Poisson distribution Blue bars denote a histogram of data divided into 1 sec bins. Red curve is a Poisson curve with rate = median count rate of data. |
 |
 |
| Quadrant-wise count rates Data is divided into 100 sec bins |
 |
|
| Module-wise count rates for Quadrant A Data is divided into 100 sec bins |
 |
 |
| Module-wise count rates for Quadrant B Data is divided into 100 sec bins |
 |
 |
| Module-wise count rates for Quadrant C Data is divided into 100 sec bins |
 |
 |
| Module-wise count rates for Quadrant D Data is divided into 100 sec bins |
 |
 |
| Parameter | Plot |
|---|---|
| CZT HV Monitor |  |
| D_VDD |  |
| Temperature 1 |  |
| Veto HV Monitor |  |
| Veto LLD |  |
| Alpha Counter |  |
| _CPM_Rate |  |
| CZT Counter |  |
| +2.5 Volts monitor |  |
| +5 Volts monitor |  |
| _ROLL_ROT |  |
| _Roll_DEC |  |
| _Roll_RA |  |
| Veto Counter |  |