| Param | Original file | Final file |
|---|---|---|
| Filename | modeM0/AS1T03_059T01_9000002554_17259cztM0_level2.evt | modeM0/AS1T03_059T01_9000002554_17259cztM0_level2_quad_clean.evt |
| Size (bytes) | 511,804,800 | 87,603,840 |
| Size | 488.1 MB | 83.5 MB |
| Events in quadrant A | 3,586,445 | 541,304 |
| Events in quadrant B | 3,641,504 | 545,308 |
| Events in quadrant C | 3,626,416 | 517,912 |
| Events in quadrant D | 4,122,043 | 512,114 |
| Mode SS | |||
|---|---|---|---|
| Quadrant | BADHDUFLAG | Total packets | Discarded packets |
| A | 0 | 158 | 0 |
| B | 0 | 158 | 0 |
| C | 0 | 158 | 0 |
| D | 0 | 158 | 0 |
| Mode M0 | |||
|---|---|---|---|
| Quadrant | BADHDUFLAG | Total packets | Discarded packets |
| A | 0 | 16015 | 58 |
| B | 0 | 15994 | 2 |
| C | 0 | 15965 | 2 |
| D | 0 | 17848 | 2 |
| Quadrant | Total seconds | Saturated seconds | Saturation percentage |
|---|---|---|---|
| A | 7686 | 122 | 1.587302% |
| B | 7712 | 168 | 2.178423% |
| C | 7712 | 201 | 2.606328% |
| D | 7712 | 278 | 3.604772% |
Noise dominated data is calculated using 1-second bins in cleaned event files. If a bin has >2000 counts, and if more than 50% of those come from <1% of pixels, then it is considered to be noise-dominated and hence unusable.
| Quadrant | # 1 sec bins | Bins with >0 counts | Bins with >2000 counts | High rate bins dominated by noise | Noise dominated (total time) | Noise dominated (detector-on time) | Marked lightcurve |
|---|---|---|---|---|---|---|---|
| A | 8402 | 7691 | 1 | 1 | 0.01% | 0.01% | 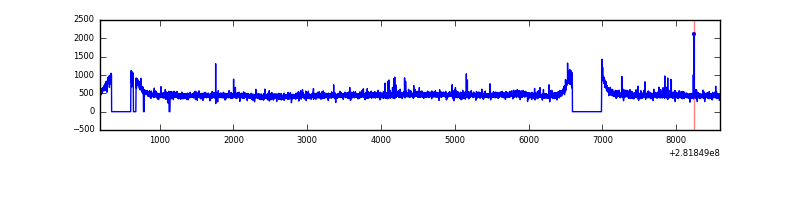 |
| B | 8402 | 7715 | 2 | 2 | 0.02% | 0.03% | 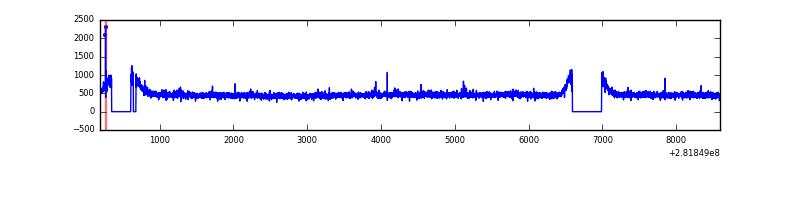 |
| C | 8402 | 7714 | 0 | 0 | 0.00% | 0.00% | 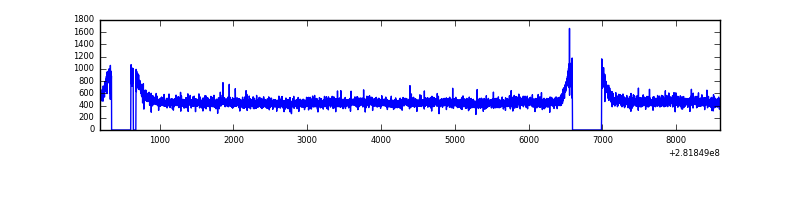 |
| D | 8402 | 7715 | 128 | 128 | 1.52% | 1.66% | 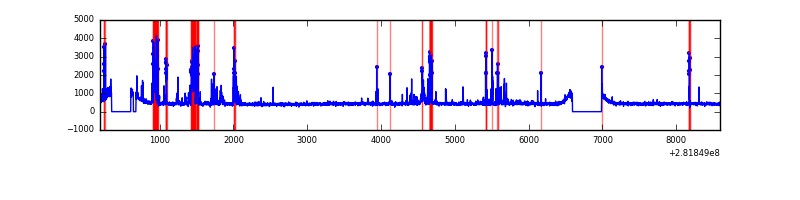 |
Top three noisy pixels from each quadrant. If the there are fewer than three noisy pixels in the level2.evt file, extra rows are filled as -1
| Pixel properties | Quadrant properties | ||||||
|---|---|---|---|---|---|---|---|
| Quadrant | DetID | PixID | Counts | Sigma | Mean | Median | Sigma |
| A | 0 | 23 | 34346 | 178.48 | 923 | 903 | 187.4 |
| A | 0 | 226 | 10006 | 48.58 | 923 | 903 | 187.4 |
| A | 3 | 137 | 7035 | 32.73 | 923 | 903 | 187.4 |
| B | 12 | 111 | 22063 | 118.25 | 926 | 900 | 179.0 |
| B | 11 | 111 | 18947 | 100.84 | 926 | 900 | 179.0 |
| B | 14 | 111 | 15753 | 82.99 | 926 | 900 | 179.0 |
| C | 14 | 238 | 135464 | 637.56 | 891 | 896 | 211.1 |
| C | 3 | 233 | 16508 | 73.97 | 891 | 896 | 211.1 |
| C | 13 | 61 | 6196 | 25.11 | 891 | 896 | 211.1 |
| D | 1 | 52 | 381171 | 1732.66 | 898 | 869 | 219.5 |
| D | 13 | 189 | 198794 | 901.75 | 898 | 869 | 219.5 |
| D | 10 | 70 | 119029 | 538.34 | 898 | 869 | 219.5 |
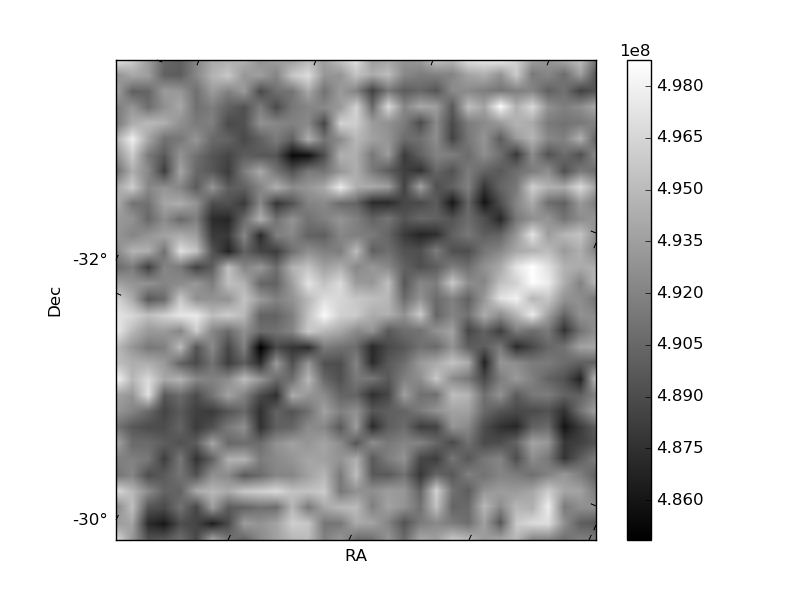
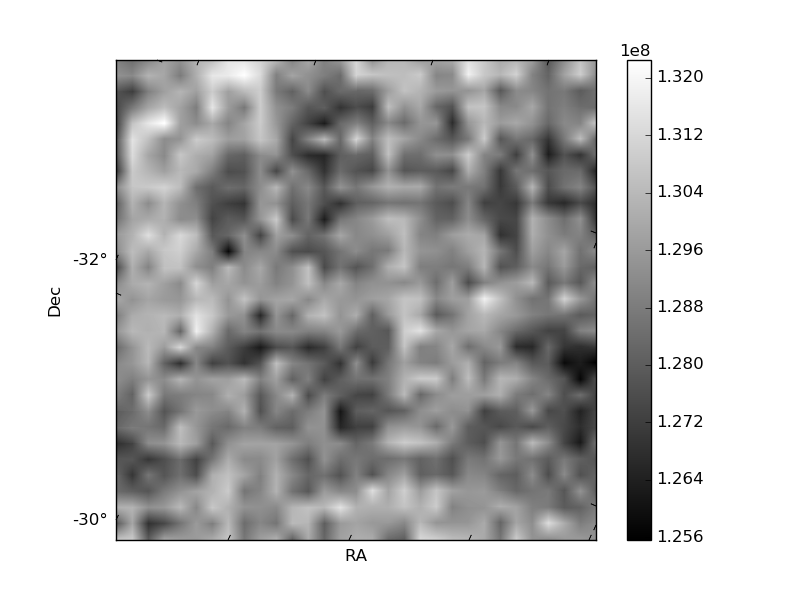
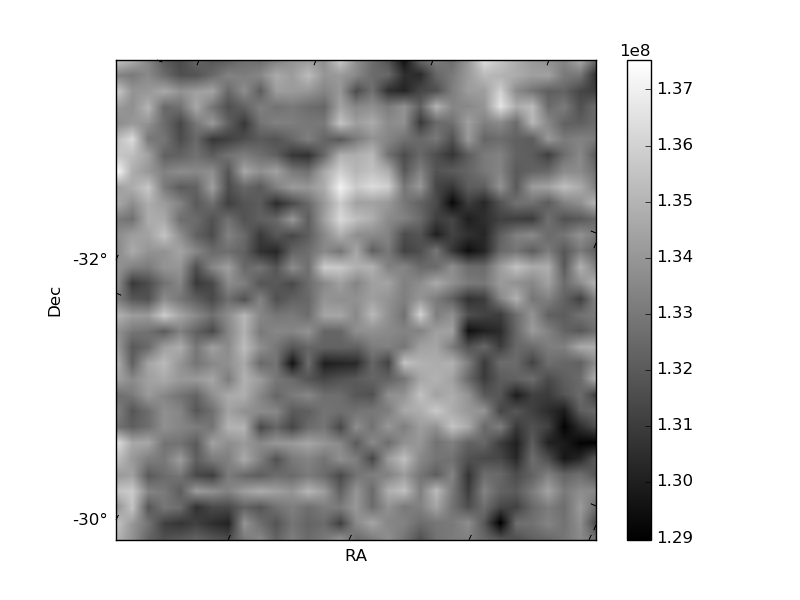
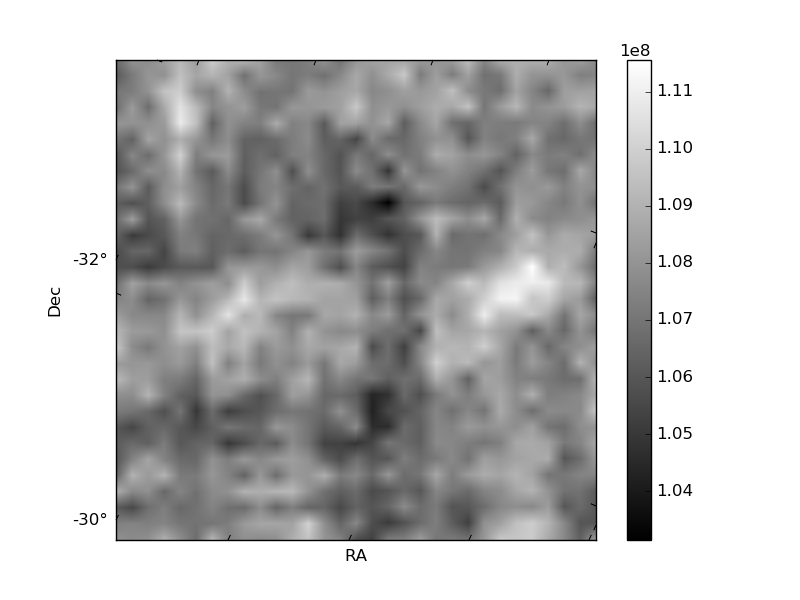
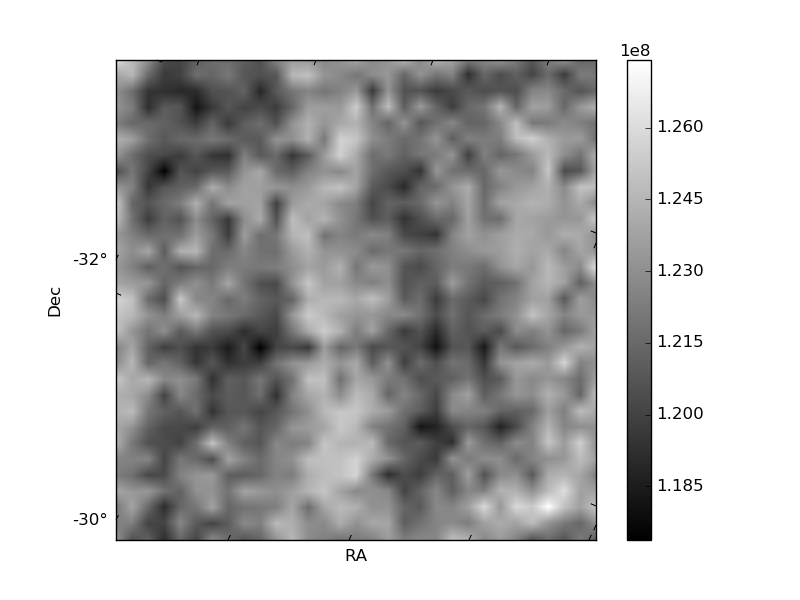
Histogram calculated using DETX and DETY for each event in the final _common_clean file
| Quadrant A | 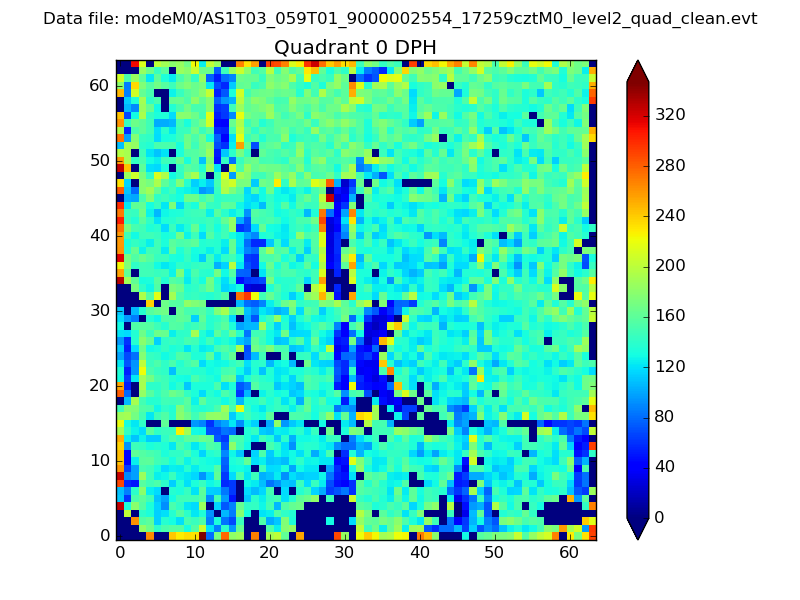 |
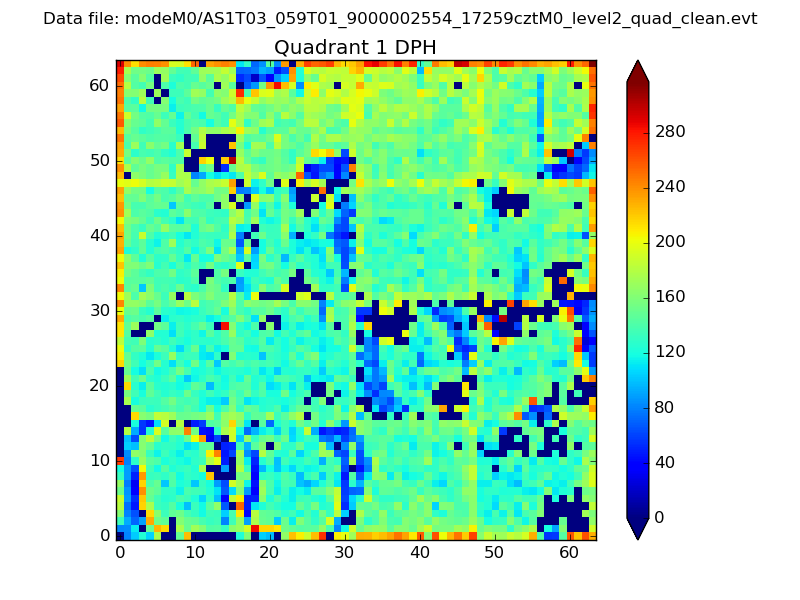 |
Quadrant B |
|---|---|---|---|
| Quadrant D | 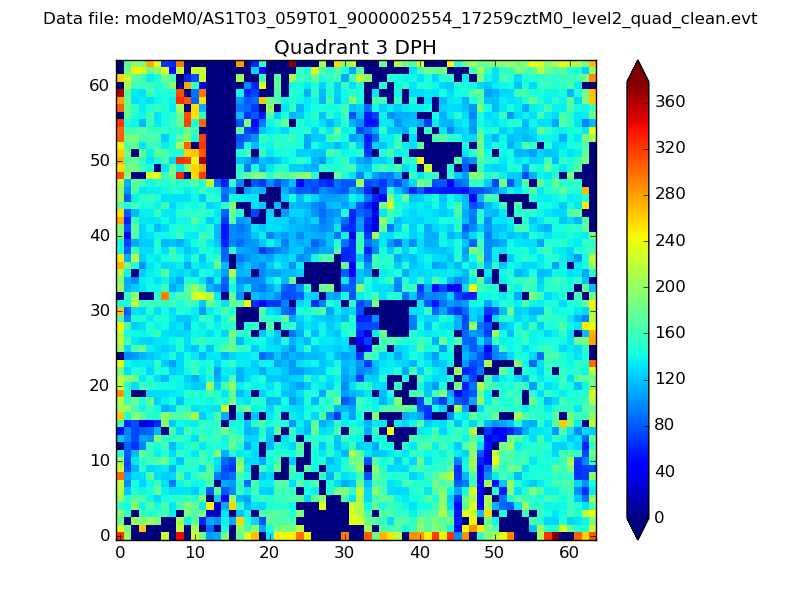 |
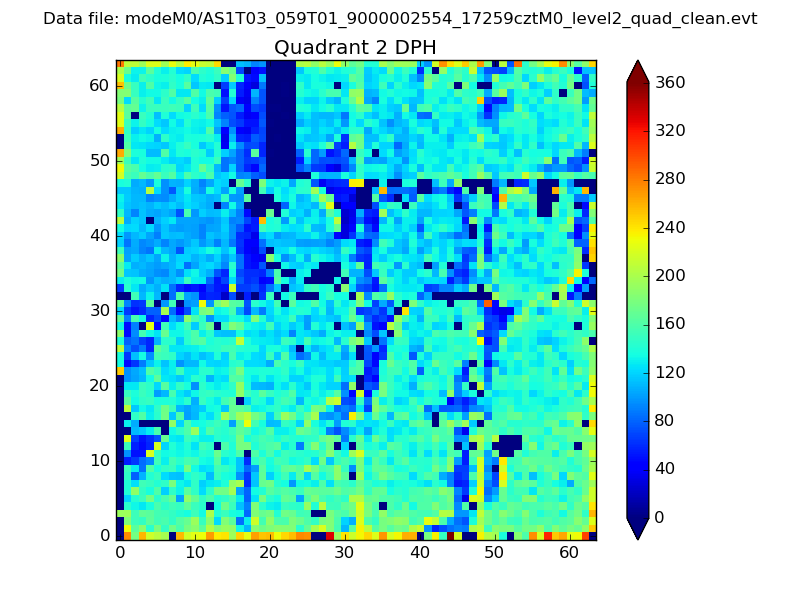 |
Quadrant C |
| Plot type | Count rate plots | Images |
|---|---|---|
| Comparison with Poisson distribution Blue bars denote a histogram of data divided into 1 sec bins. Red curve is a Poisson curve with rate = median count rate of data. |
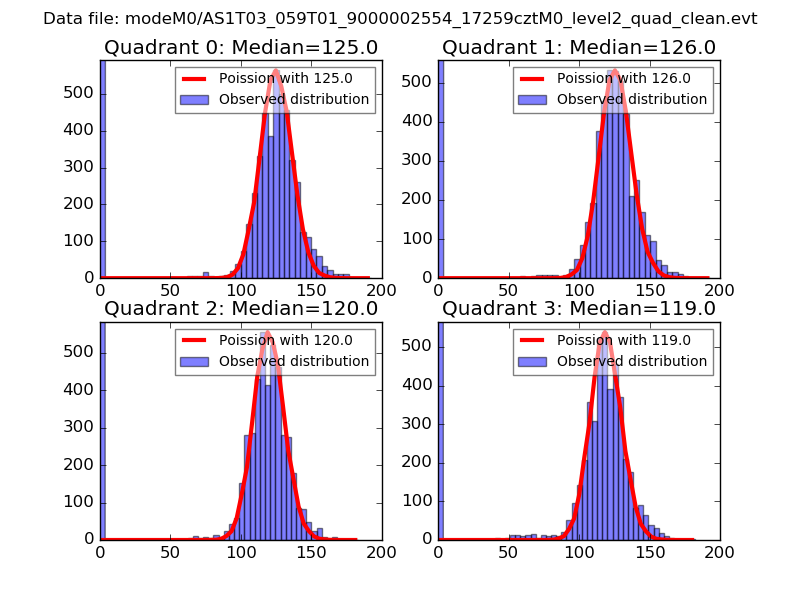 |
 |
| Quadrant-wise count rates Data is divided into 100 sec bins |
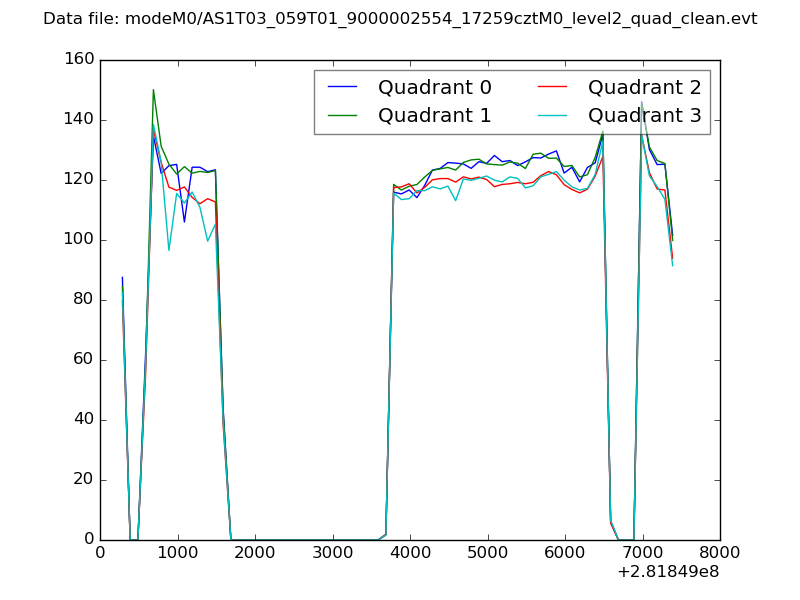 |
|
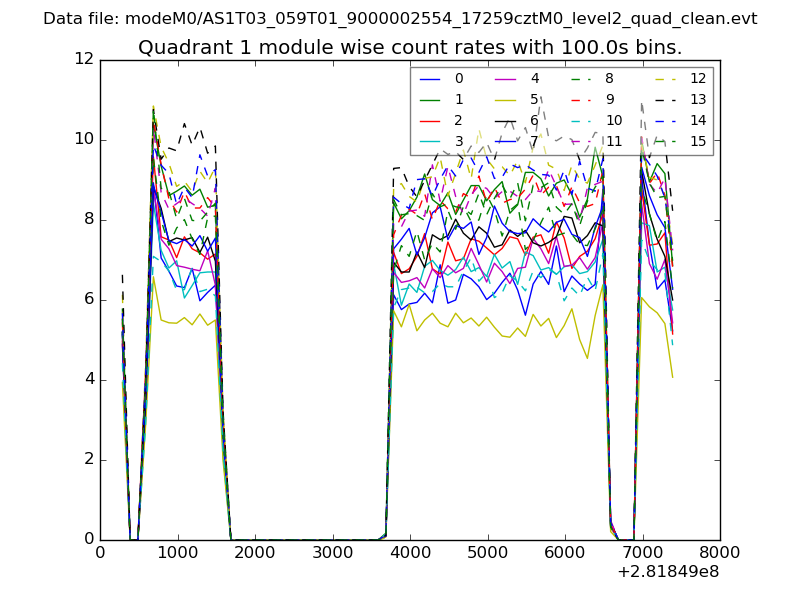
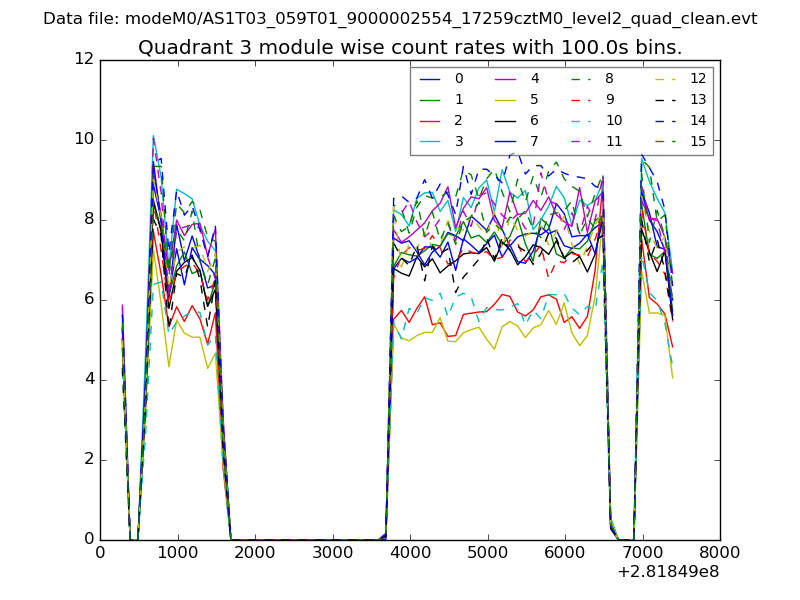
| Module-wise count rates for Quadrant A Data is divided into 100 sec bins |
 |
 |
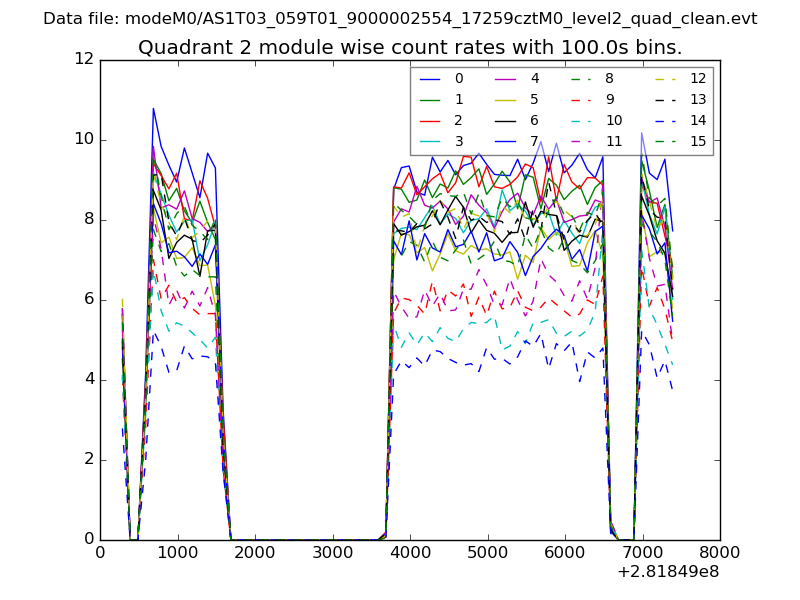
| Module-wise count rates for Quadrant B Data is divided into 100 sec bins |
 |
 |
| Module-wise count rates for Quadrant C Data is divided into 100 sec bins |
 |
 |
| Module-wise count rates for Quadrant D Data is divided into 100 sec bins |
 |
 |
| Parameter | Plot |
|---|---|
| CZT HV Monitor |  |
| D_VDD | 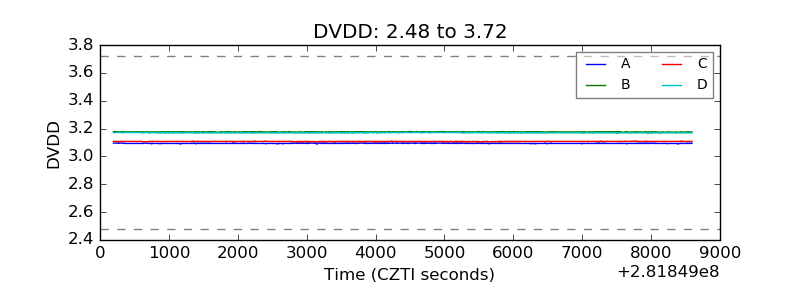 |
| Temperature 1 | 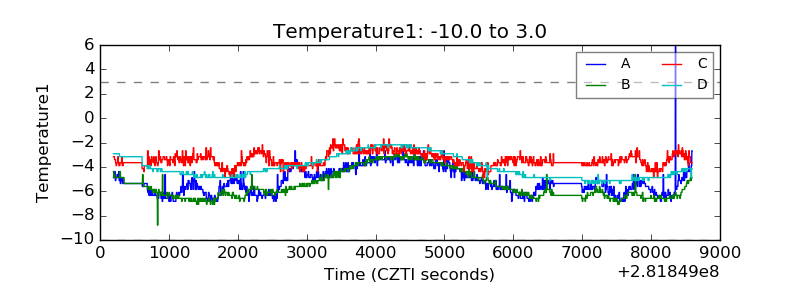 |
| Veto HV Monitor | 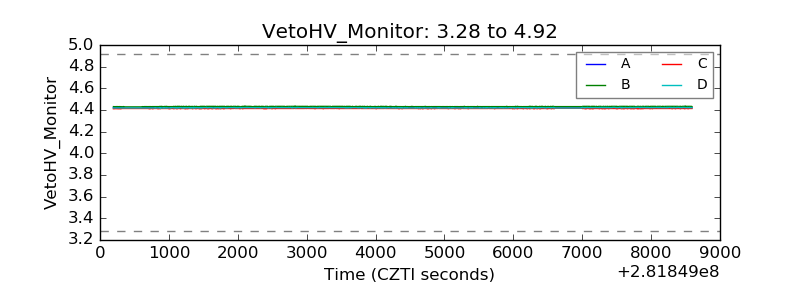 |
| Veto LLD | 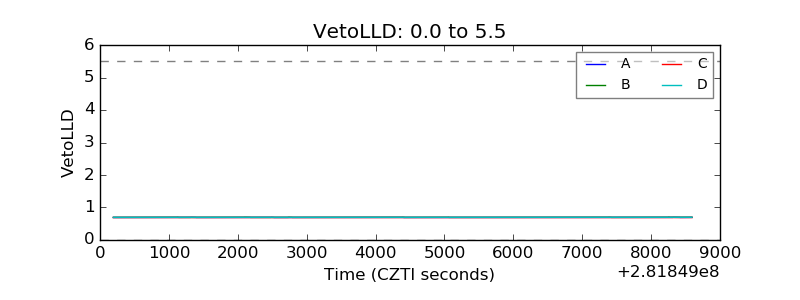 |
| Alpha Counter | 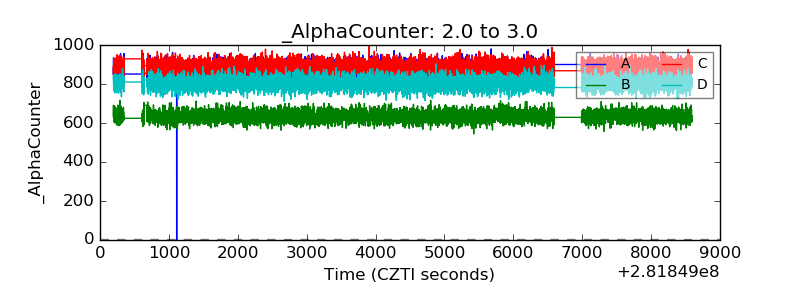 |
| _CPM_Rate | 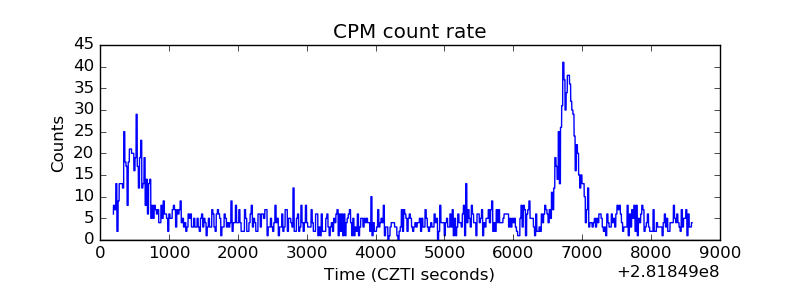 |
| CZT Counter | 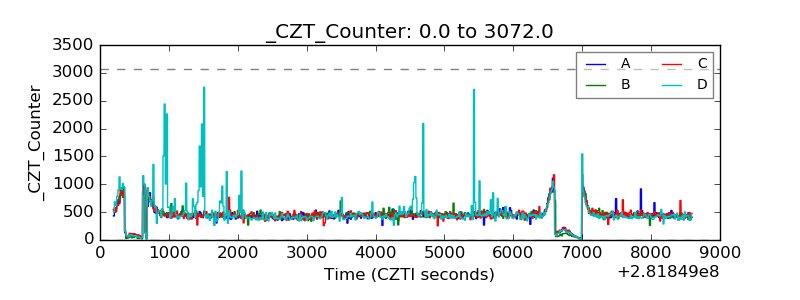 |
| +2.5 Volts monitor |  |
| +5 Volts monitor |  |
| _ROLL_ROT | 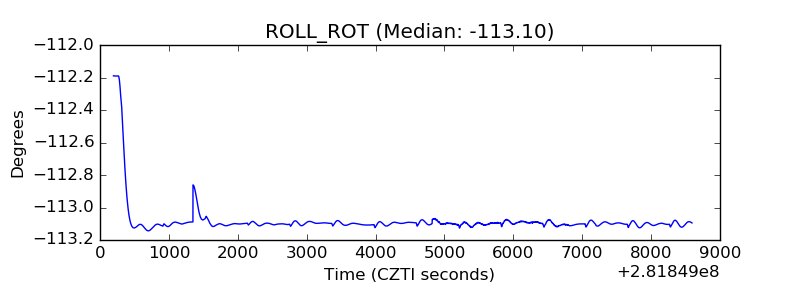 |
| _Roll_DEC | 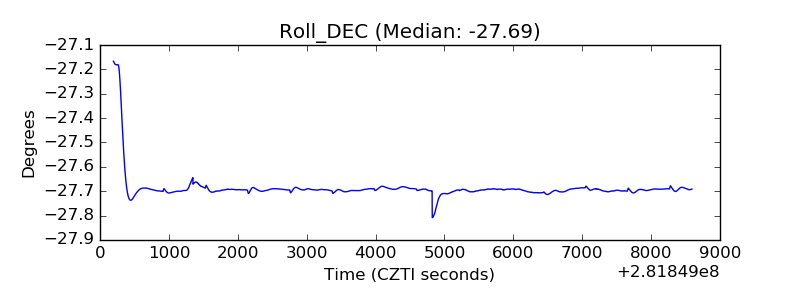 |
| _Roll_RA | 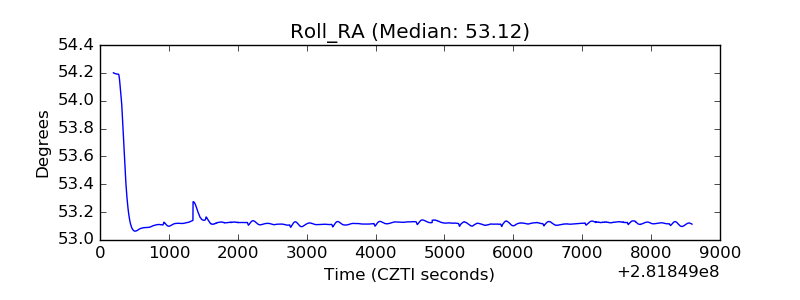 |
| Veto Counter | 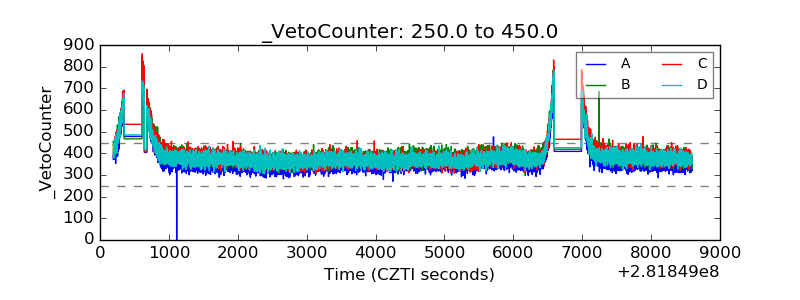 |