| Param | Original file | Final file |
|---|---|---|
| Filename | modeM0/AS1T03_059T01_9000002554_17261cztM0_level2.evt | modeM0/AS1T03_059T01_9000002554_17261cztM0_level2_quad_clean.evt |
| Size (bytes) | 223,562,880 | 30,404,160 |
| Size | 213.2 MB | 29.0 MB |
| Events in quadrant A | 1,620,930 | 172,788 |
| Events in quadrant B | 1,633,023 | 173,669 |
| Events in quadrant C | 1,657,026 | 163,129 |
| Events in quadrant D | 1,621,343 | 164,109 |
| Mode M9 | |||
|---|---|---|---|
| Quadrant | BADHDUFLAG | Total packets | Discarded packets |
| A | 0 | 4 | 0 |
| B | 0 | 4 | 0 |
| C | 0 | 4 | 0 |
| D | 0 | 4 | 0 |
| Mode SS | |||
|---|---|---|---|
| Quadrant | BADHDUFLAG | Total packets | Discarded packets |
| A | 0 | 72 | 0 |
| B | 0 | 72 | 0 |
| C | 0 | 72 | 0 |
| D | 0 | 72 | 0 |
| Mode M0 | |||
|---|---|---|---|
| Quadrant | BADHDUFLAG | Total packets | Discarded packets |
| A | 0 | 7229 | 1 |
| B | 0 | 7194 | 1 |
| C | 0 | 7212 | 1 |
| D | 0 | 7342 | 2 |
| Quadrant | Total seconds | Saturated seconds | Saturation percentage |
|---|---|---|---|
| A | 3473 | 57 | 1.641232% |
| B | 3474 | 76 | 2.187680% |
| C | 3474 | 98 | 2.820956% |
| D | 3473 | 77 | 2.217103% |
Noise dominated data is calculated using 1-second bins in cleaned event files. If a bin has >2000 counts, and if more than 50% of those come from <1% of pixels, then it is considered to be noise-dominated and hence unusable.
| Quadrant | # 1 sec bins | Bins with >0 counts | Bins with >2000 counts | High rate bins dominated by noise | Noise dominated (total time) | Noise dominated (detector-on time) | Marked lightcurve |
|---|---|---|---|---|---|---|---|
| A | 3868 | 3474 | 1 | 1 | 0.03% | 0.03% | 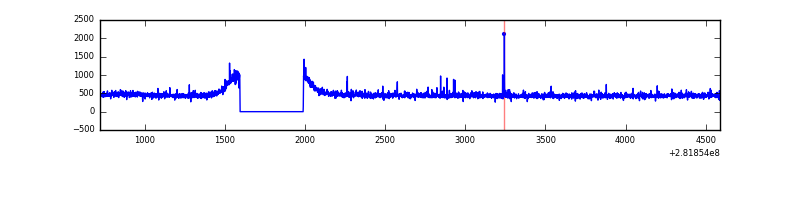 |
| B | 3869 | 3475 | 0 | 0 | 0.00% | 0.00% | 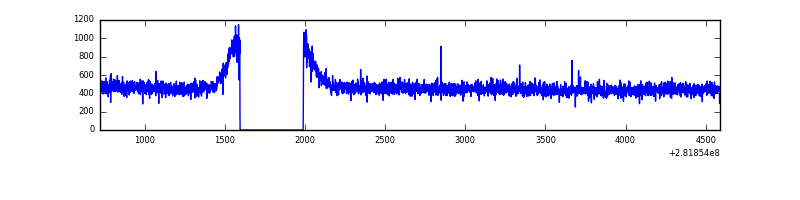 |
| C | 3869 | 3475 | 0 | 0 | 0.00% | 0.00% | 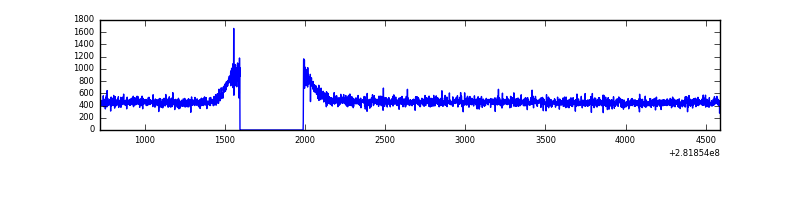 |
| D | 3868 | 3474 | 16 | 16 | 0.41% | 0.46% | 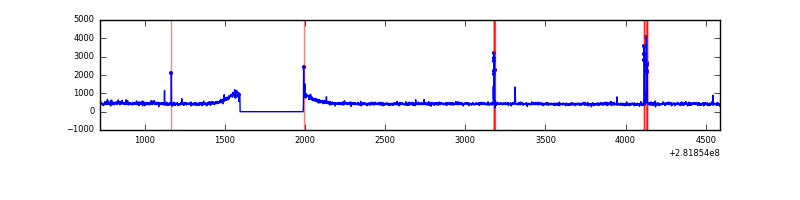 |
Top three noisy pixels from each quadrant. If the there are fewer than three noisy pixels in the level2.evt file, extra rows are filled as -1
| Pixel properties | Quadrant properties | ||||||
|---|---|---|---|---|---|---|---|
| Quadrant | DetID | PixID | Counts | Sigma | Mean | Median | Sigma |
| A | 0 | 23 | 16609 | 189.73 | 416 | 407 | 85.4 |
| A | 0 | 226 | 4561 | 48.65 | 416 | 407 | 85.4 |
| A | 4 | 2 | 4311 | 45.72 | 416 | 407 | 85.4 |
| B | 12 | 111 | 10074 | 117.1 | 417 | 404 | 82.6 |
| B | 11 | 111 | 8749 | 101.06 | 417 | 404 | 82.6 |
| B | 14 | 111 | 7466 | 85.52 | 417 | 404 | 82.6 |
| C | 14 | 238 | 62004 | 630.09 | 407 | 408 | 97.8 |
| C | 3 | 233 | 9189 | 89.82 | 407 | 408 | 97.8 |
| C | 13 | 61 | 2774 | 24.2 | 407 | 408 | 97.8 |
| D | 2 | 14 | 31818 | 310.5 | 409 | 397 | 101.2 |
| D | 1 | 52 | 19935 | 193.07 | 409 | 397 | 101.2 |
| D | 2 | 234 | 14320 | 137.59 | 409 | 397 | 101.2 |
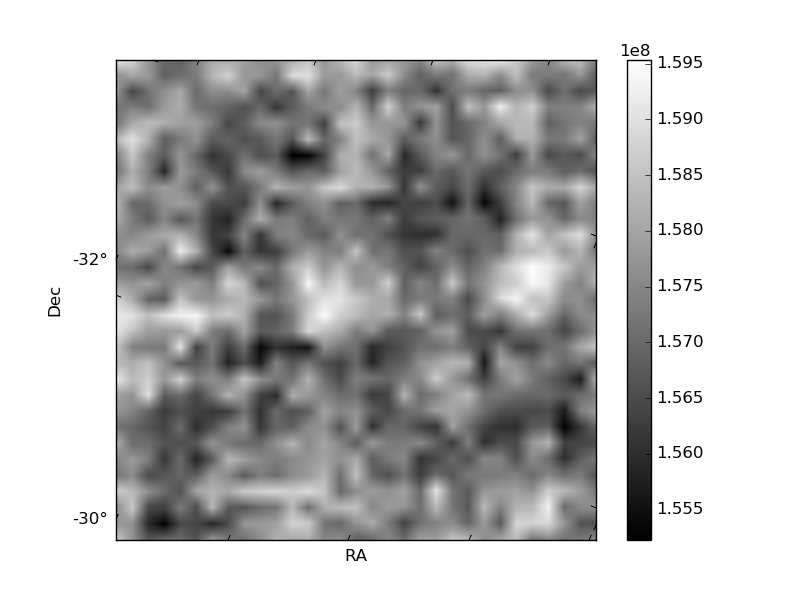
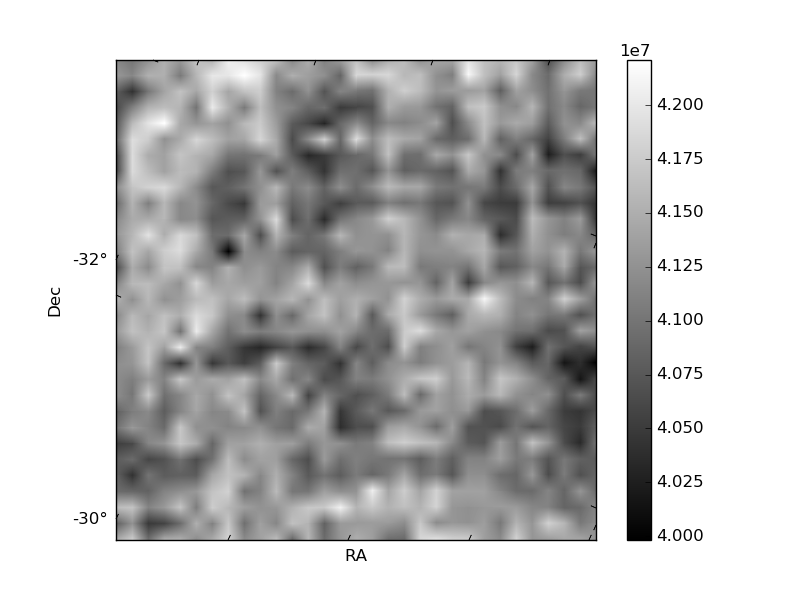
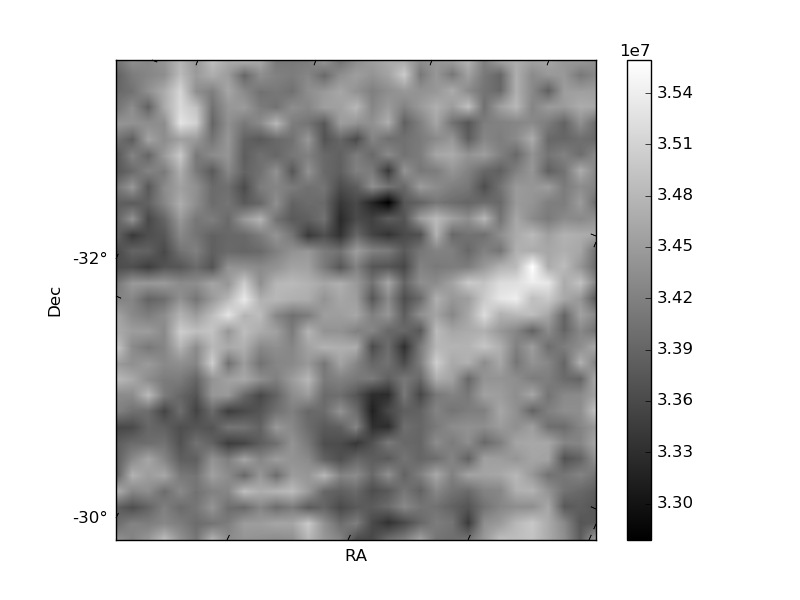
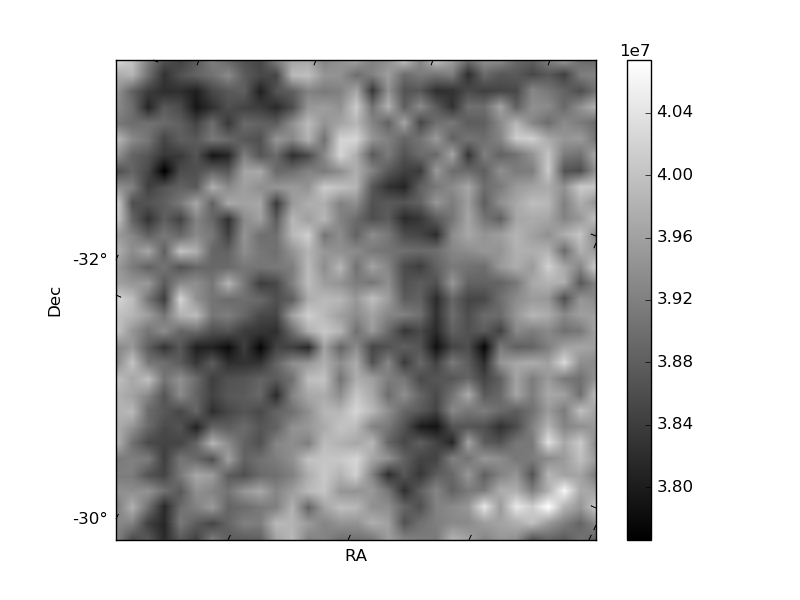
Histogram calculated using DETX and DETY for each event in the final _common_clean file
| Quadrant A | 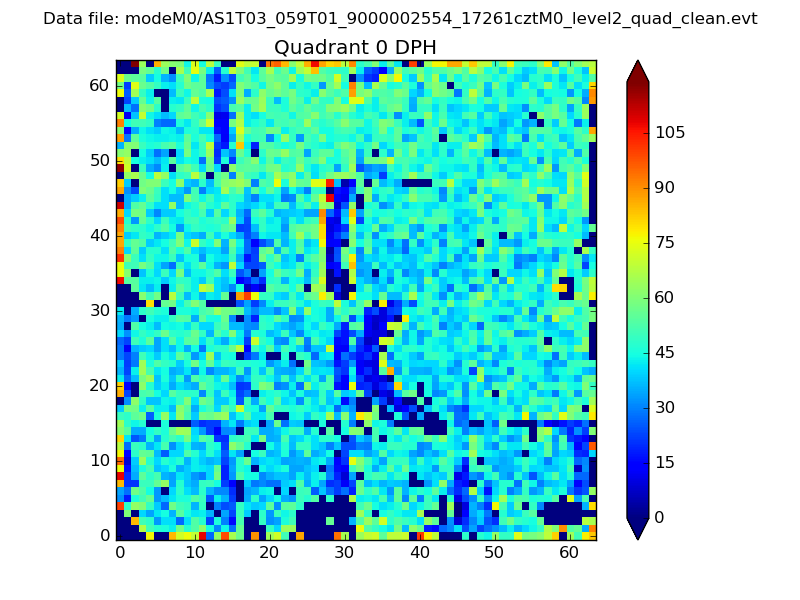 |
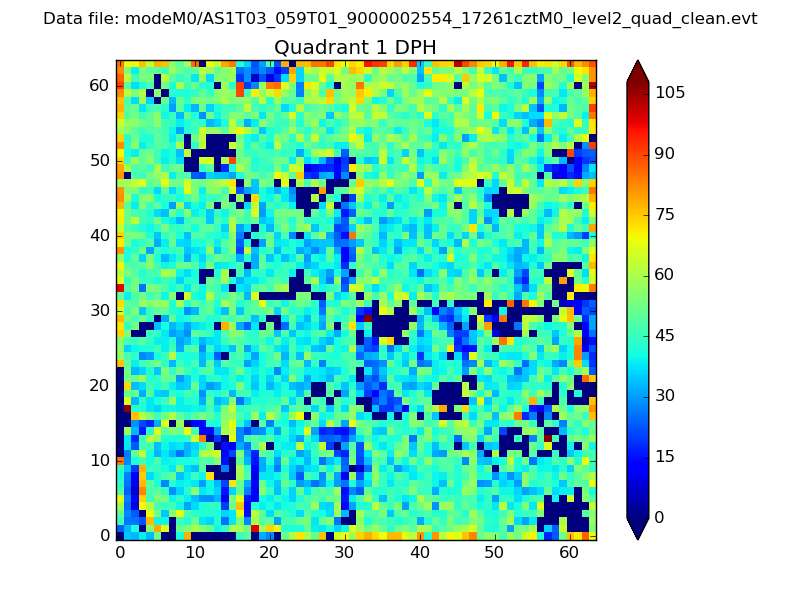 |
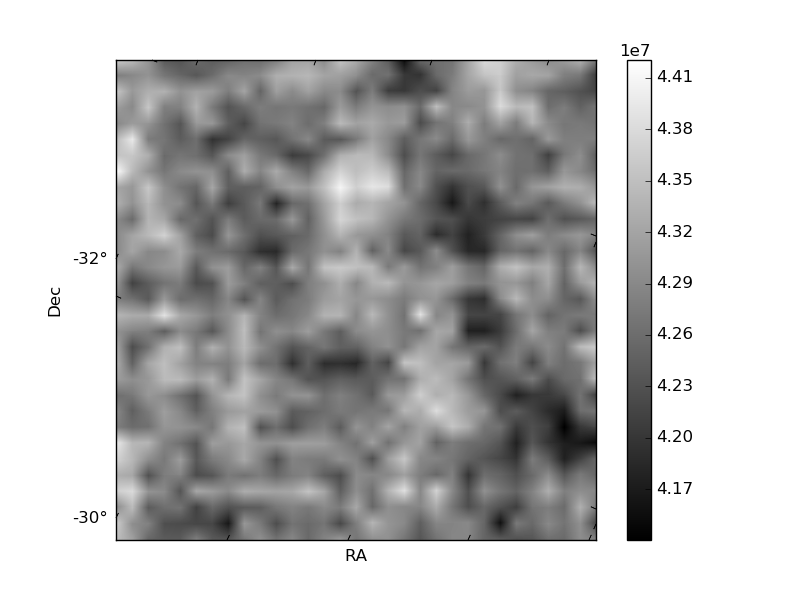
Quadrant B |
|---|---|---|---|
| Quadrant D | 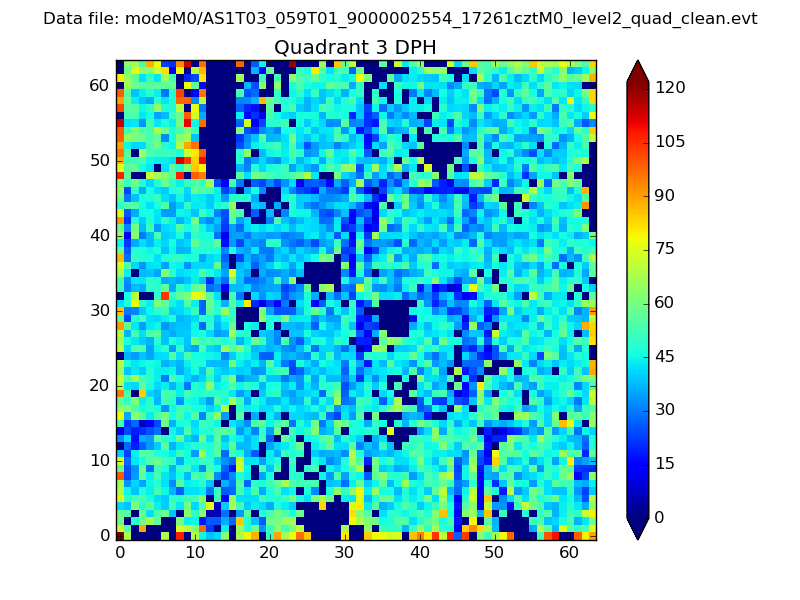 |
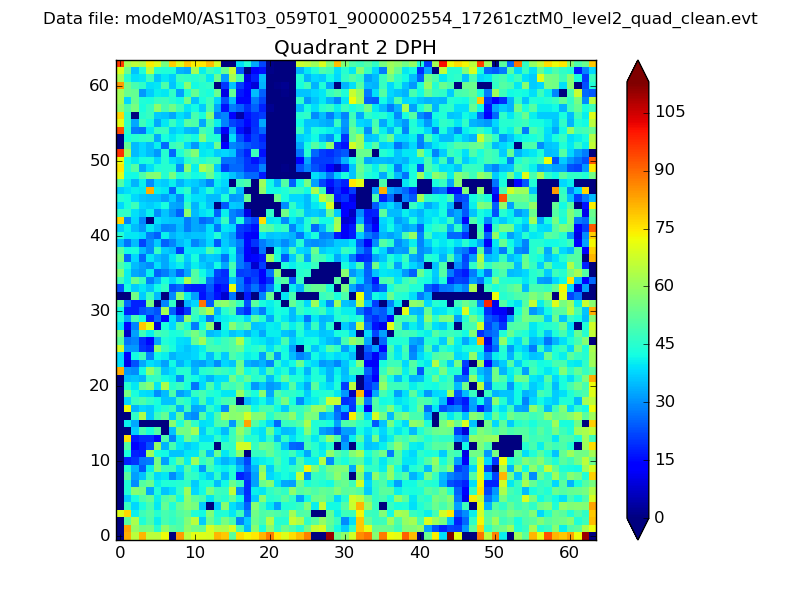 |
Quadrant C |
| Plot type | Count rate plots | Images |
|---|---|---|
| Comparison with Poisson distribution Blue bars denote a histogram of data divided into 1 sec bins. Red curve is a Poisson curve with rate = median count rate of data. |
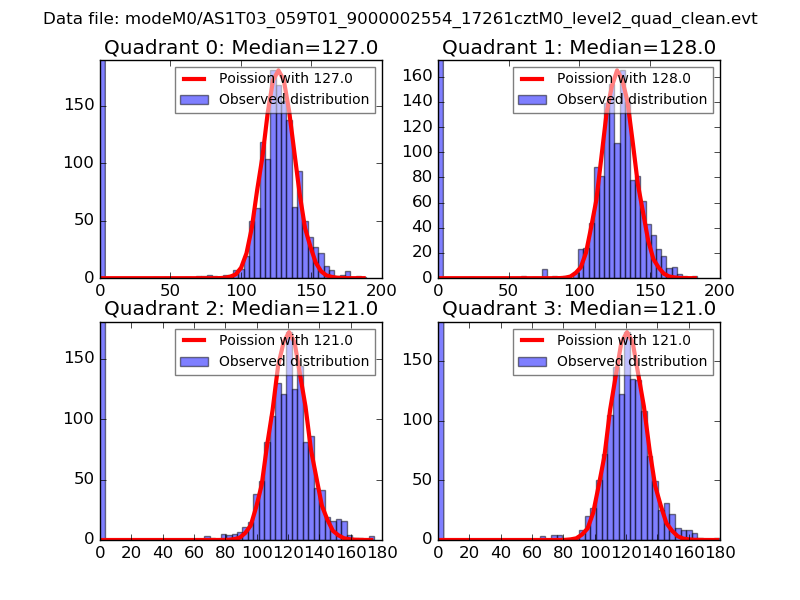 |
 |
| Quadrant-wise count rates Data is divided into 100 sec bins |
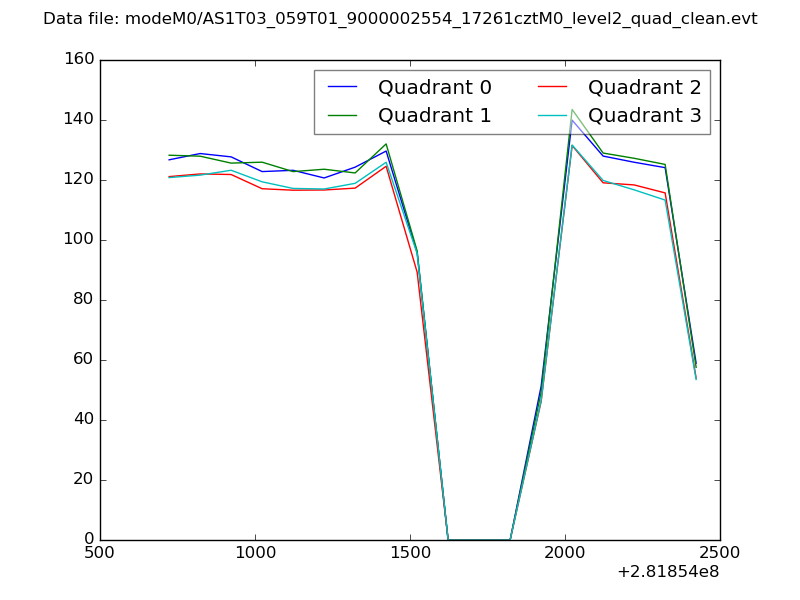 |
|
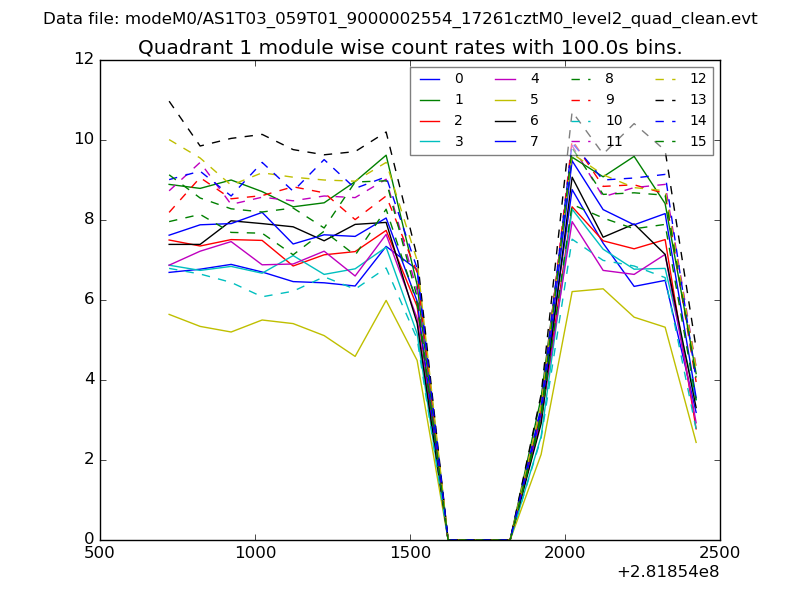
| Module-wise count rates for Quadrant A Data is divided into 100 sec bins |
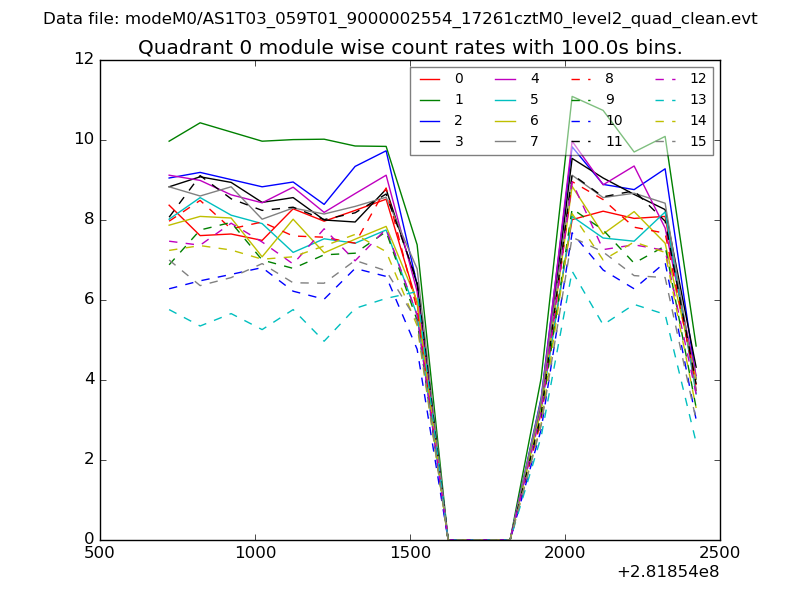 |
 |
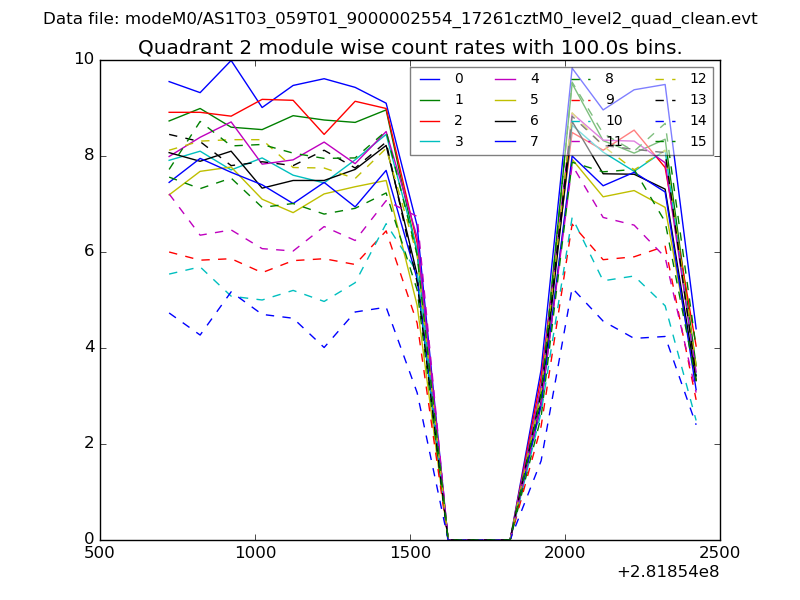
| Module-wise count rates for Quadrant B Data is divided into 100 sec bins |
 |
 |
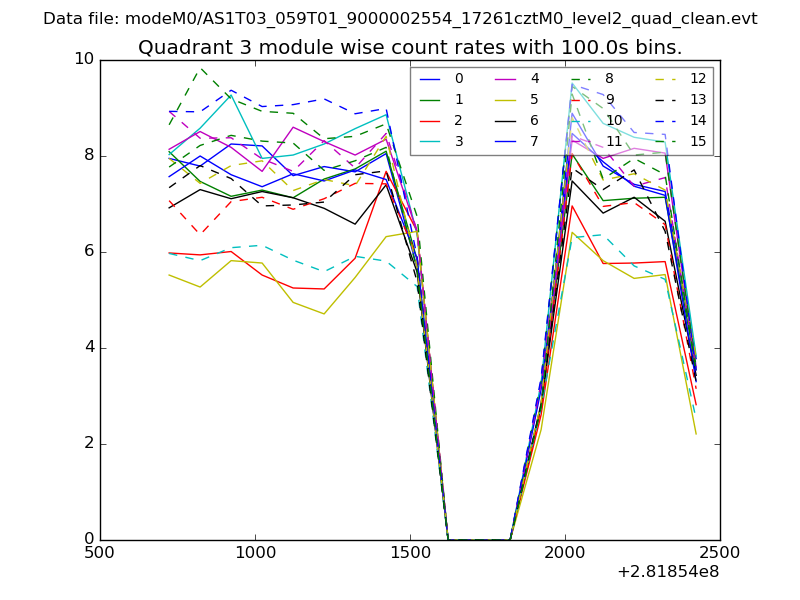
| Module-wise count rates for Quadrant C Data is divided into 100 sec bins |
 |
 |
| Module-wise count rates for Quadrant D Data is divided into 100 sec bins |
 |
 |
| Parameter | Plot |
|---|---|
| CZT HV Monitor | 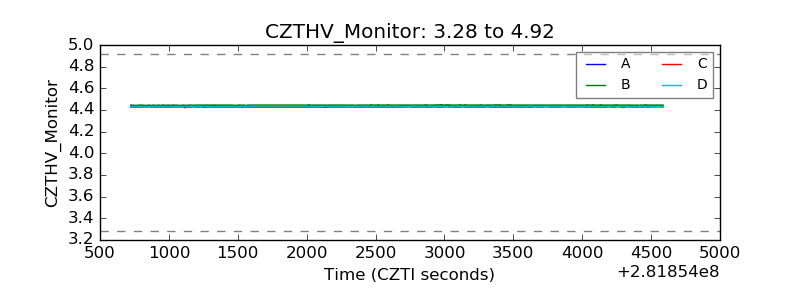 |
| D_VDD | 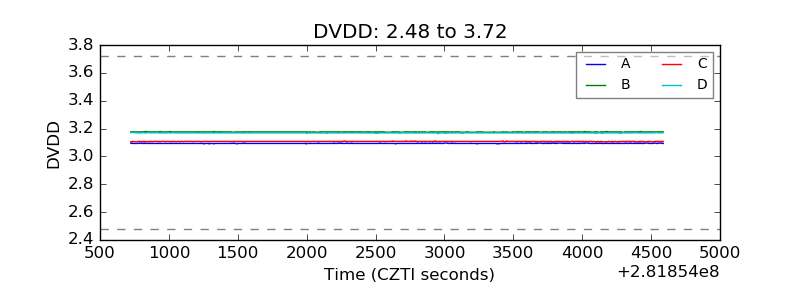 |
| Temperature 1 | 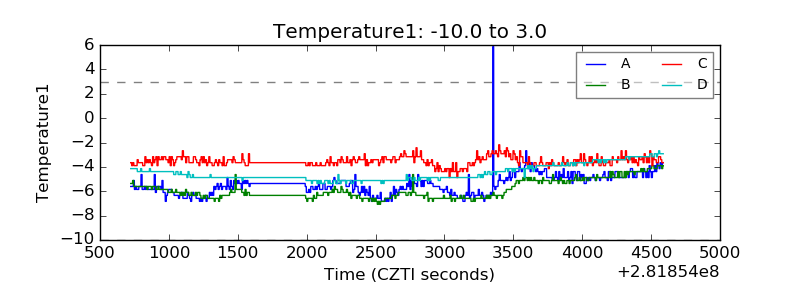 |
| Veto HV Monitor | 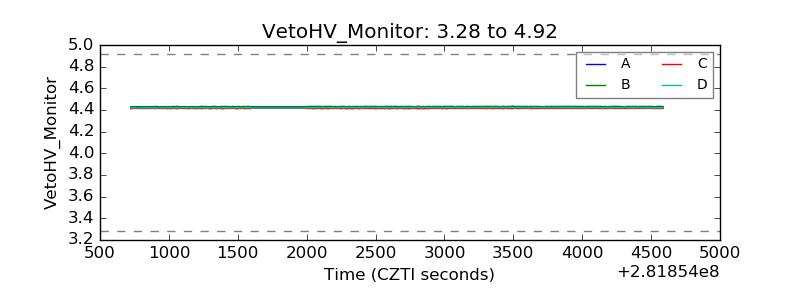 |
| Veto LLD | 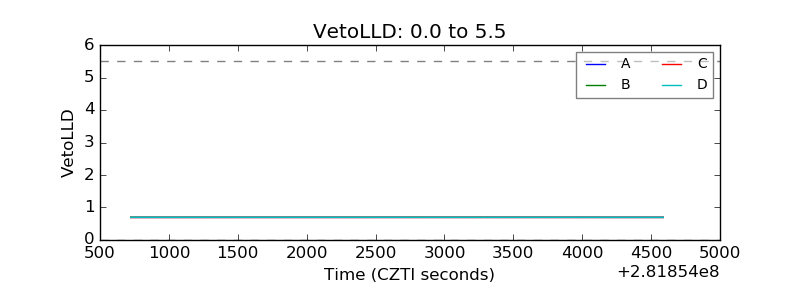 |
| Alpha Counter |  |
| _CPM_Rate | 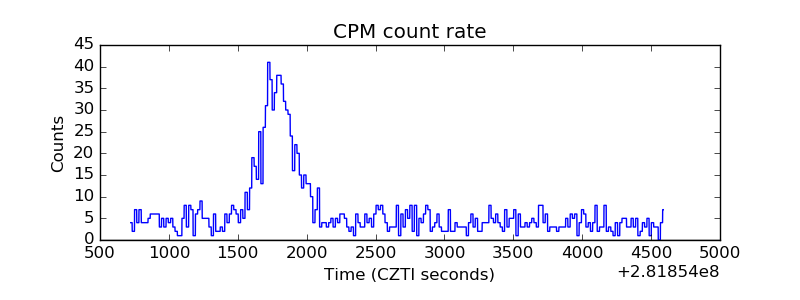 |
| CZT Counter | 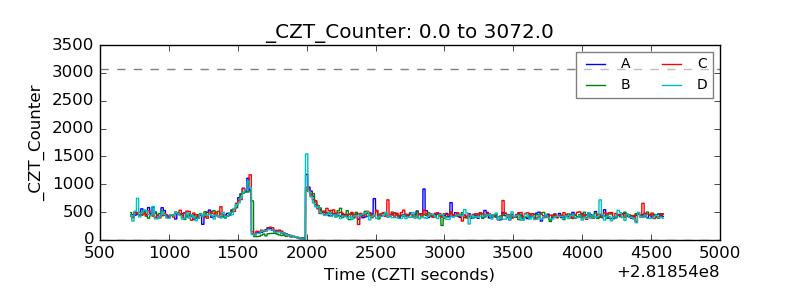 |
| +2.5 Volts monitor |  |
| +5 Volts monitor | 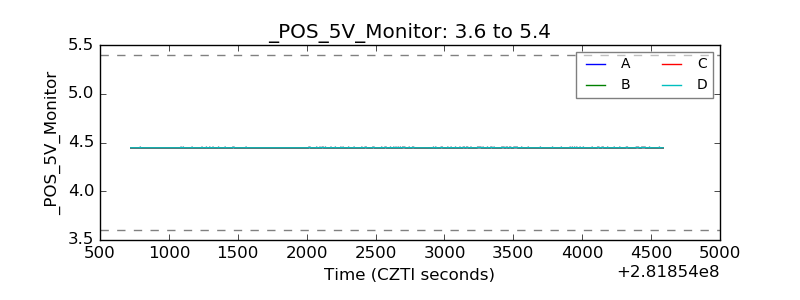 |
| _ROLL_ROT | 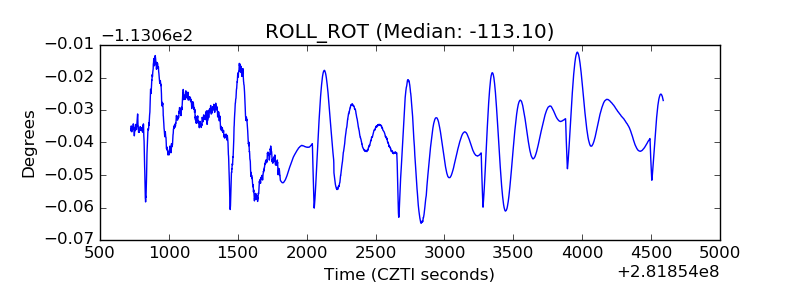 |
| _Roll_DEC | 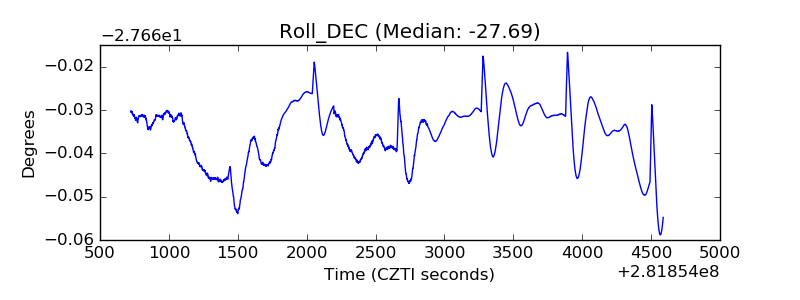 |
| _Roll_RA | 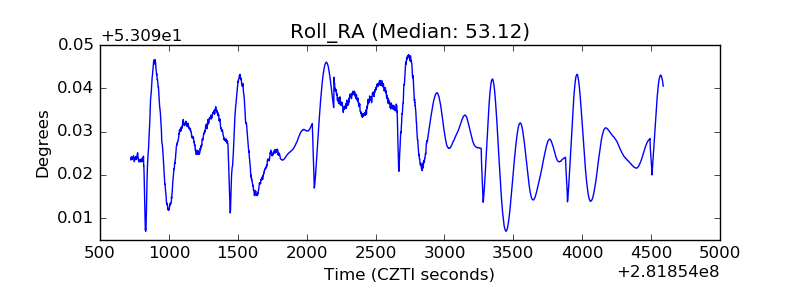 |
| Veto Counter | 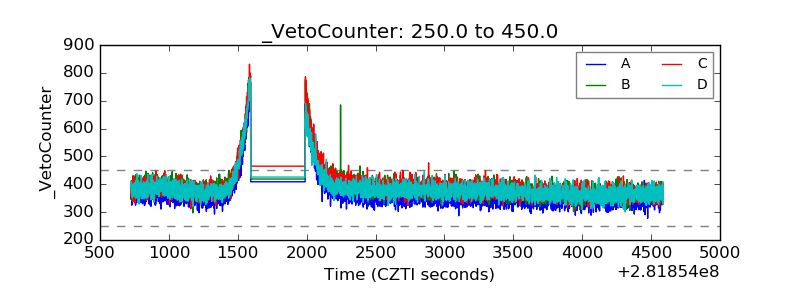 |