| Param | Original file | Final file |
|---|---|---|
| Filename | modeM0/AS1T03_059T01_9000002554_17262cztM0_level2.evt | modeM0/AS1T03_059T01_9000002554_17262cztM0_level2_quad_clean.evt |
| Size (bytes) | 1,061,769,600 | 202,775,040 |
| Size | 1012.6 MB | 193.4 MB |
| Events in quadrant A | 8,048,077 | 1,279,104 |
| Events in quadrant B | 7,600,028 | 1,283,679 |
| Events in quadrant C | 7,579,275 | 1,229,867 |
| Events in quadrant D | 7,826,227 | 1,226,001 |
| Mode M9 | |||
|---|---|---|---|
| Quadrant | BADHDUFLAG | Total packets | Discarded packets |
| A | 0 | 21 | 0 |
| B | 0 | 21 | 0 |
| C | 0 | 21 | 0 |
| D | 0 | 21 | 0 |
| Mode SS | |||
|---|---|---|---|
| Quadrant | BADHDUFLAG | Total packets | Discarded packets |
| A | 0 | 332 | 0 |
| B | 0 | 332 | 0 |
| C | 0 | 332 | 0 |
| D | 0 | 332 | 0 |
| Mode M0 | |||
|---|---|---|---|
| Quadrant | BADHDUFLAG | Total packets | Discarded packets |
| A | 0 | 34555 | 3 |
| B | 0 | 33418 | 3 |
| C | 0 | 33360 | 3 |
| D | 0 | 34921 | 3 |
| Quadrant | Total seconds | Saturated seconds | Saturation percentage |
|---|---|---|---|
| A | 16275 | 318 | 1.953917% |
| B | 16276 | 212 | 1.302531% |
| C | 16276 | 243 | 1.492996% |
| D | 16276 | 232 | 1.425412% |
Noise dominated data is calculated using 1-second bins in cleaned event files. If a bin has >2000 counts, and if more than 50% of those come from <1% of pixels, then it is considered to be noise-dominated and hence unusable.
| Quadrant | # 1 sec bins | Bins with >0 counts | Bins with >2000 counts | High rate bins dominated by noise | Noise dominated (total time) | Noise dominated (detector-on time) | Marked lightcurve |
|---|---|---|---|---|---|---|---|
| A | 18340 | 16277 | 94 | 94 | 0.51% | 0.58% | 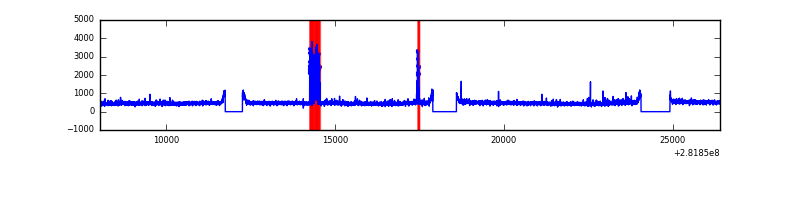 |
| B | 18341 | 16276 | 1 | 1 | 0.01% | 0.01% | 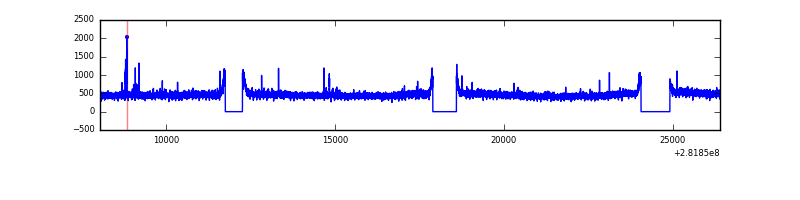 |
| C | 18341 | 16278 | 0 | 0 | 0.00% | 0.00% | 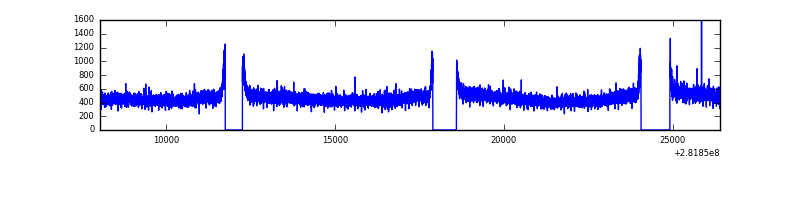 |
| D | 18341 | 16278 | 48 | 48 | 0.26% | 0.29% | 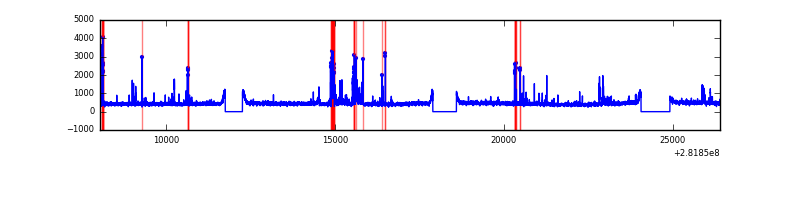 |
Top three noisy pixels from each quadrant. If the there are fewer than three noisy pixels in the level2.evt file, extra rows are filled as -1
| Pixel properties | Quadrant properties | ||||||
|---|---|---|---|---|---|---|---|
| Quadrant | DetID | PixID | Counts | Sigma | Mean | Median | Sigma |
| A | 13 | 210 | 372424 | 956.45 | 1934 | 1892 | 387.4 |
| A | 0 | 23 | 178249 | 455.23 | 1934 | 1892 | 387.4 |
| A | 4 | 2 | 61814 | 154.68 | 1934 | 1892 | 387.4 |
| B | 0 | 230 | 58340 | 152.25 | 1928 | 1878 | 370.9 |
| B | 12 | 111 | 46137 | 119.34 | 1928 | 1878 | 370.9 |
| B | 11 | 111 | 40007 | 102.81 | 1928 | 1878 | 370.9 |
| C | 14 | 238 | 279631 | 638.92 | 1850 | 1858 | 434.8 |
| C | 3 | 233 | 85117 | 191.51 | 1850 | 1858 | 434.8 |
| C | 13 | 61 | 12946 | 25.5 | 1850 | 1858 | 434.8 |
| D | 11 | 176 | 440035 | 957.9 | 1880 | 1827 | 457.5 |
| D | 10 | 70 | 122472 | 263.72 | 1880 | 1827 | 457.5 |
| D | 1 | 52 | 84505 | 180.73 | 1880 | 1827 | 457.5 |
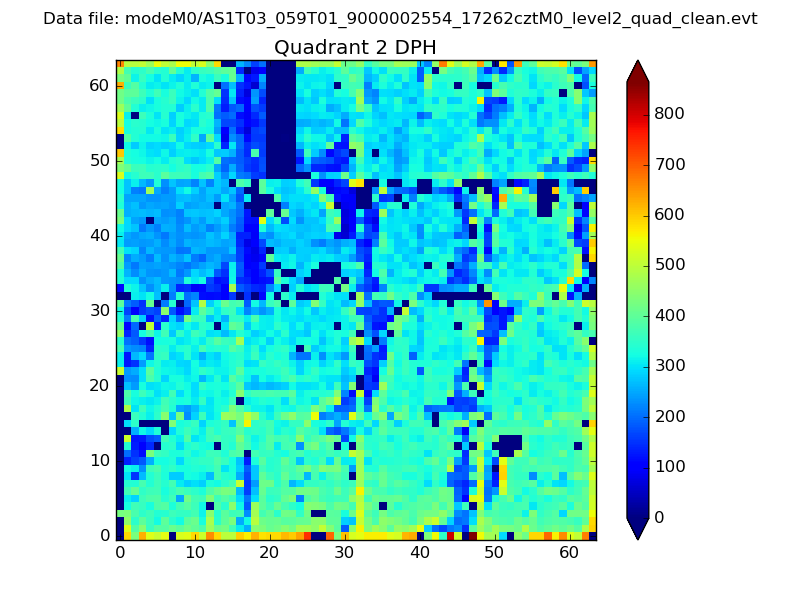
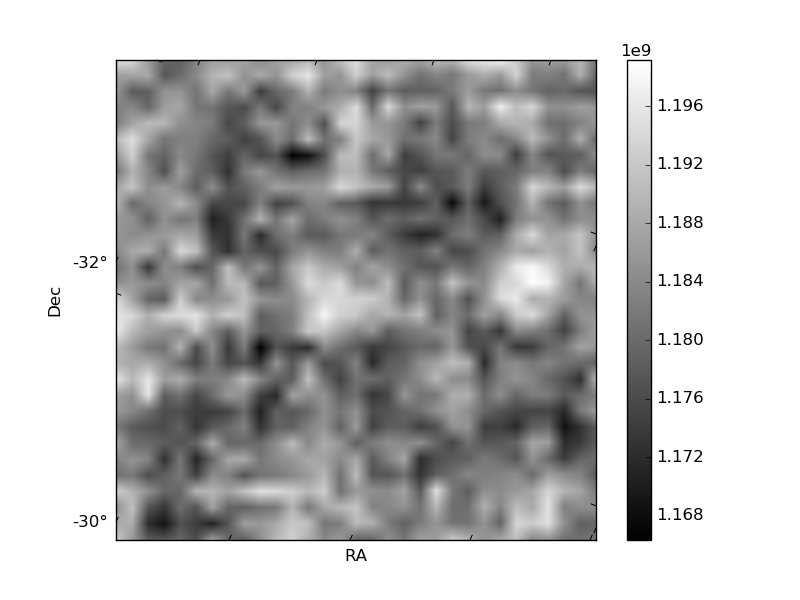
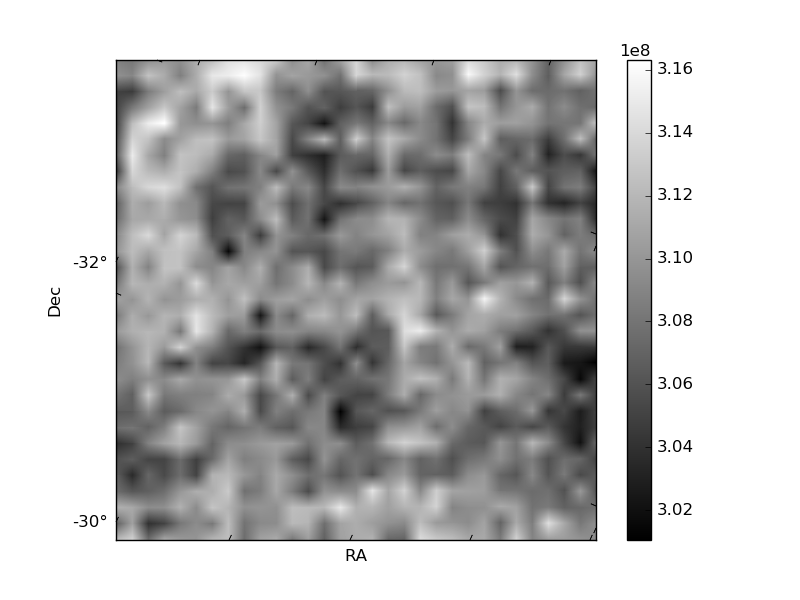
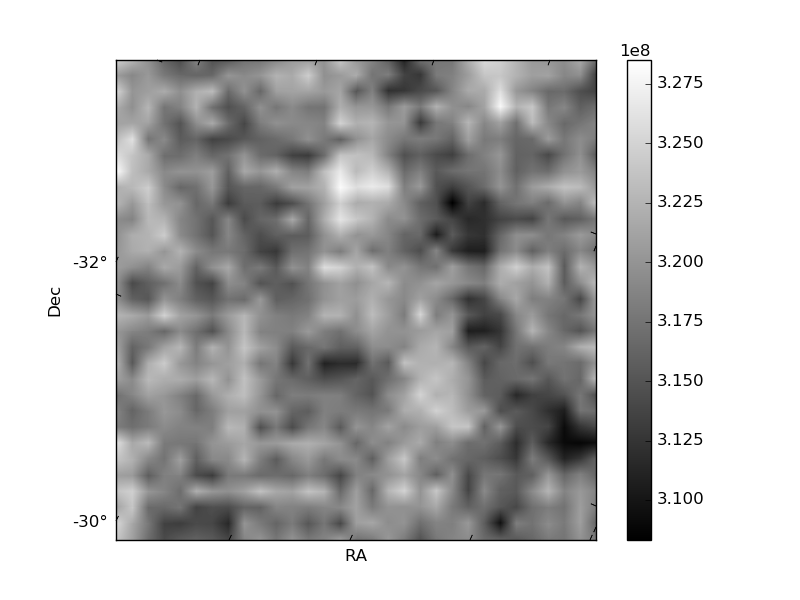
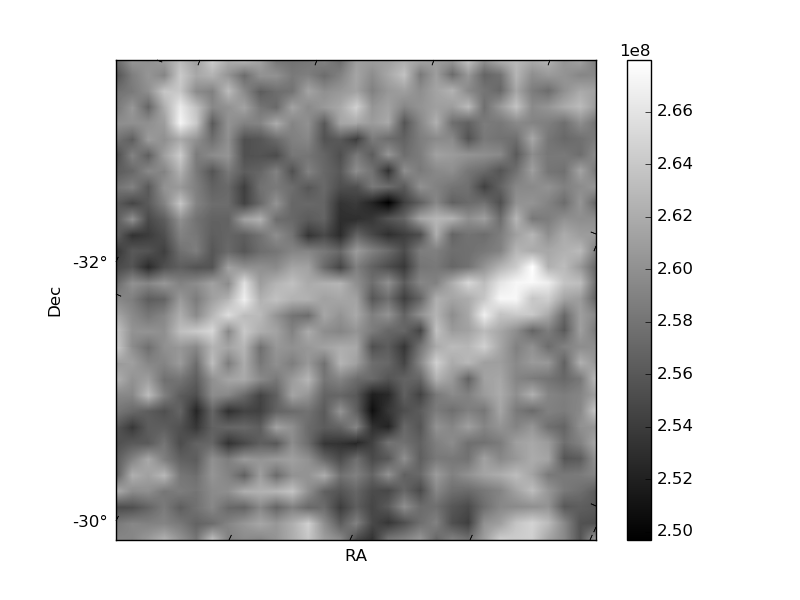
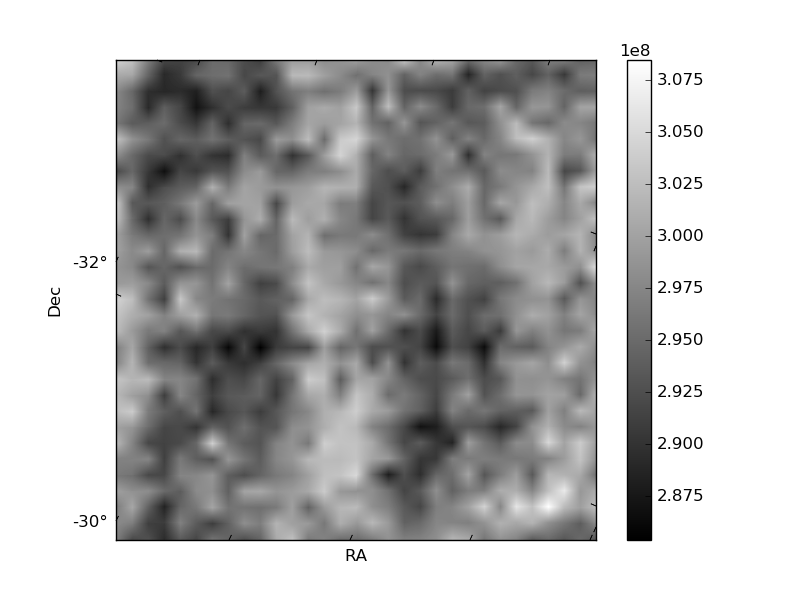
Histogram calculated using DETX and DETY for each event in the final _common_clean file
| Quadrant A | 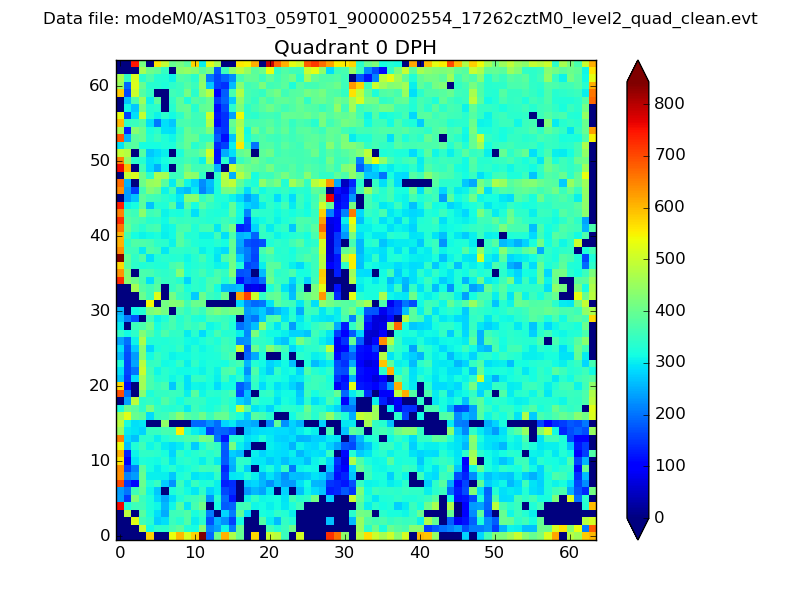 |
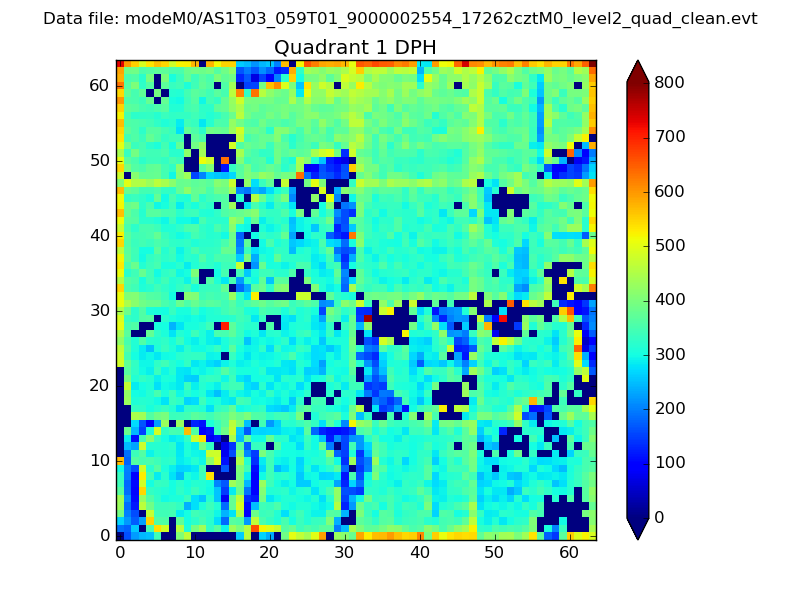 |
Quadrant B |
|---|---|---|---|
| Quadrant D | 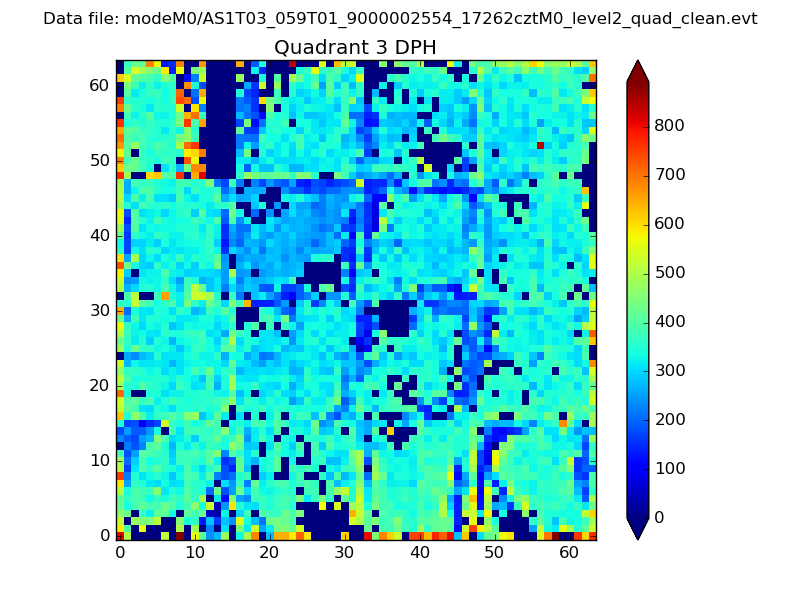 |
 |
Quadrant C |
| Plot type | Count rate plots | Images |
|---|---|---|
| Comparison with Poisson distribution Blue bars denote a histogram of data divided into 1 sec bins. Red curve is a Poisson curve with rate = median count rate of data. |
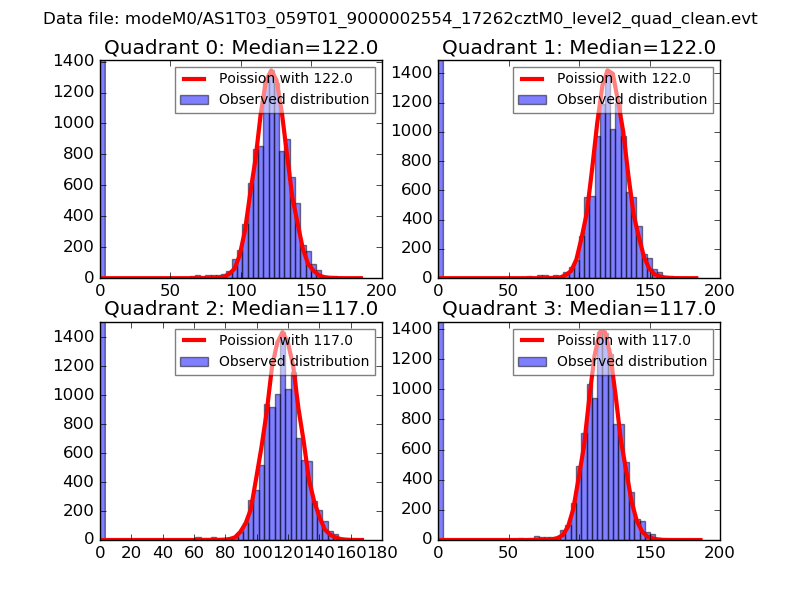 |
 |
| Quadrant-wise count rates Data is divided into 100 sec bins |
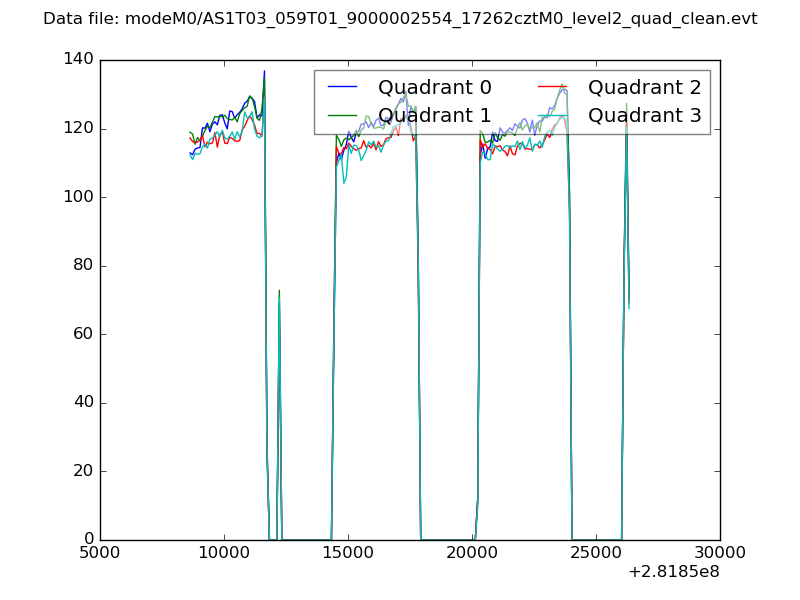 |
|
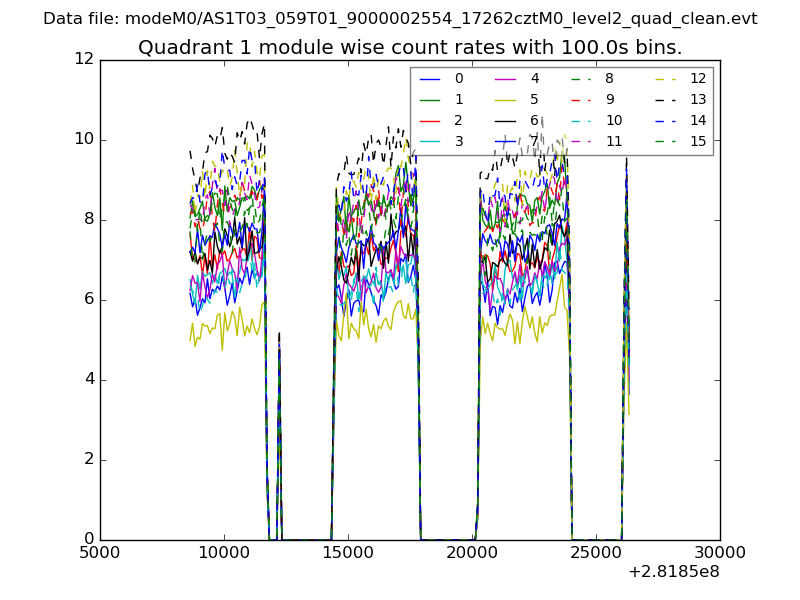
| Module-wise count rates for Quadrant A Data is divided into 100 sec bins |
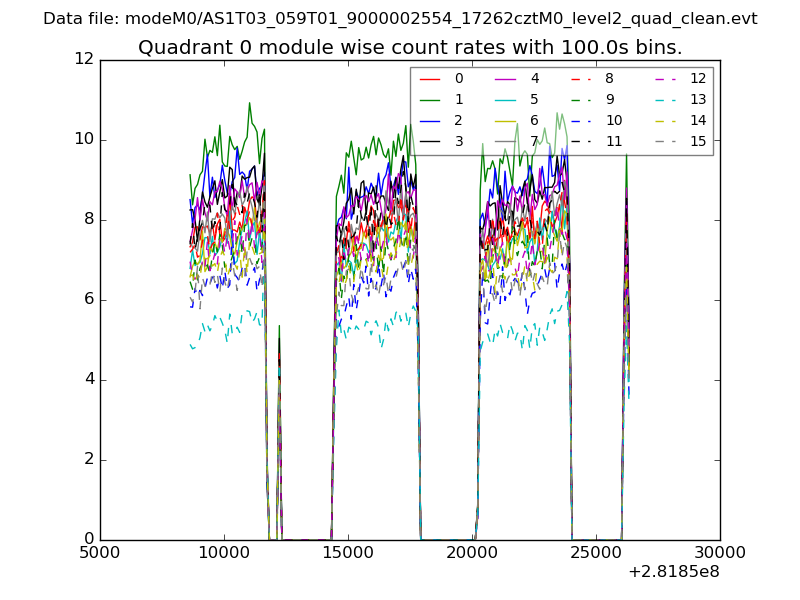 |
 |
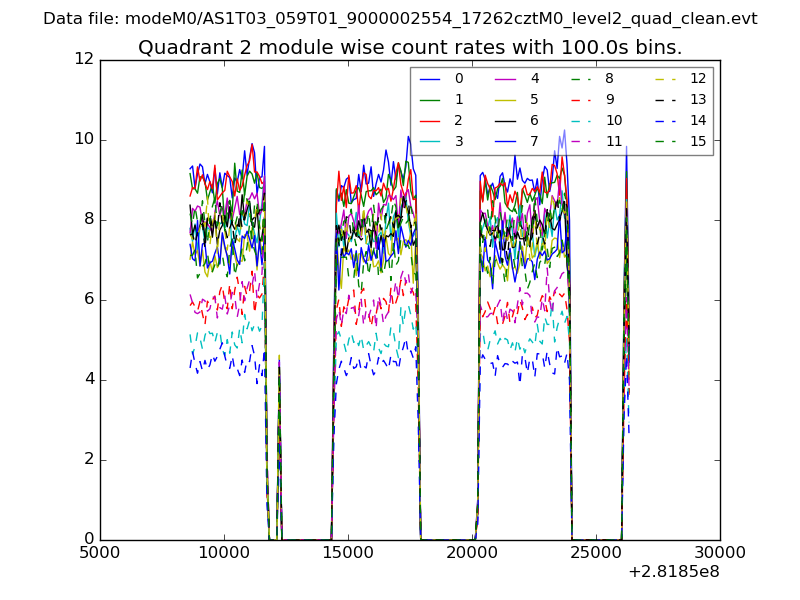
| Module-wise count rates for Quadrant B Data is divided into 100 sec bins |
 |
 |
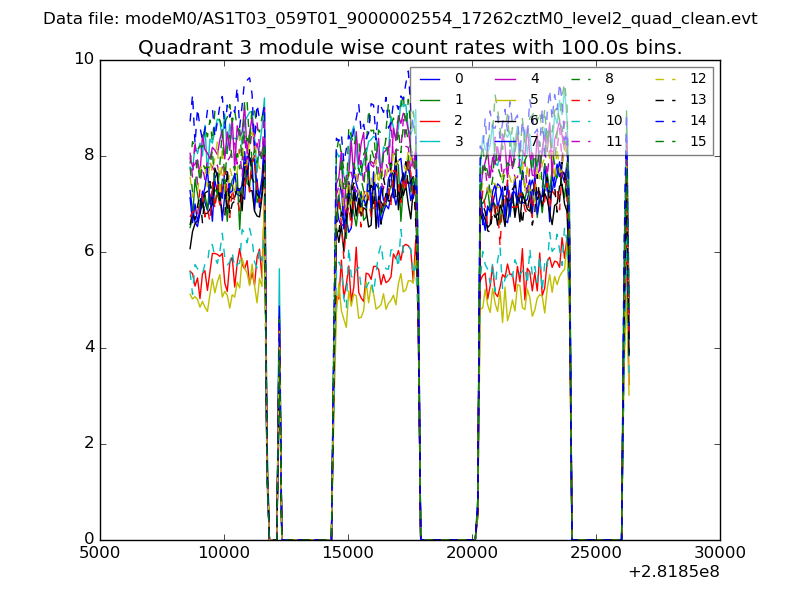
| Module-wise count rates for Quadrant C Data is divided into 100 sec bins |
 |
 |
| Module-wise count rates for Quadrant D Data is divided into 100 sec bins |
 |
 |
| Parameter | Plot |
|---|---|
| CZT HV Monitor | 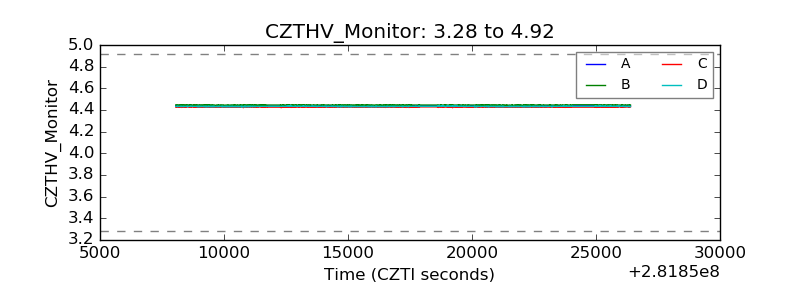 |
| D_VDD | 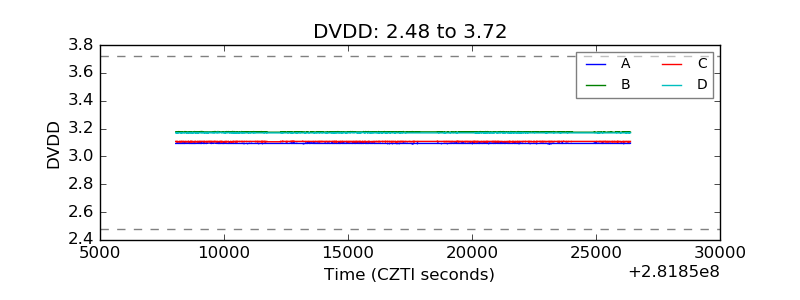 |
| Temperature 1 | 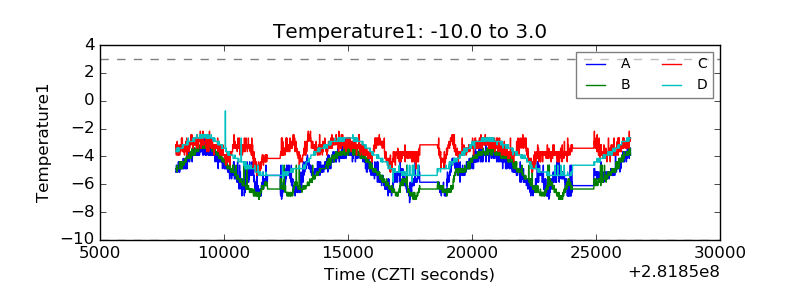 |
| Veto HV Monitor | 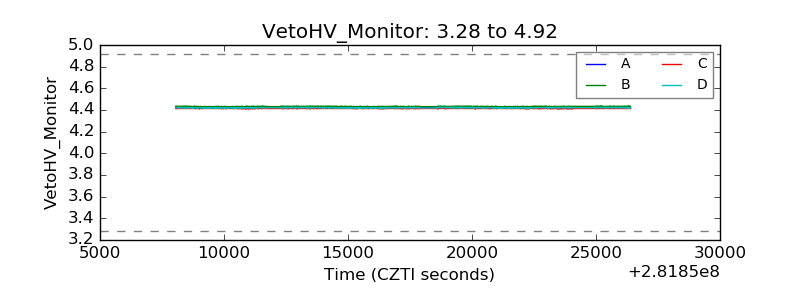 |
| Veto LLD | 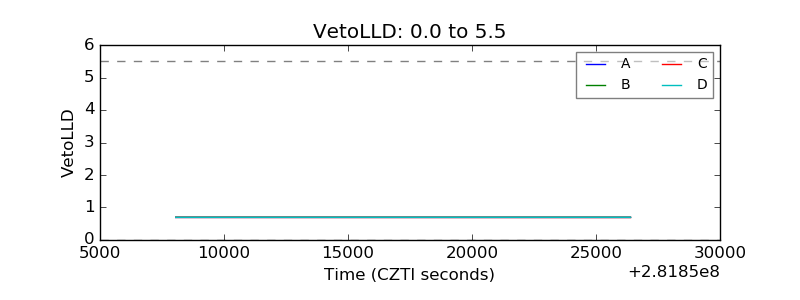 |
| Alpha Counter | 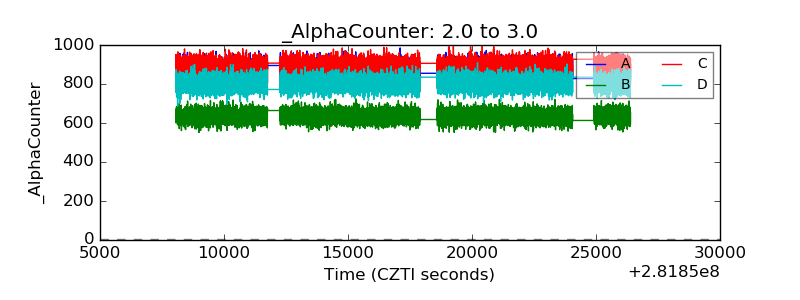 |
| _CPM_Rate | 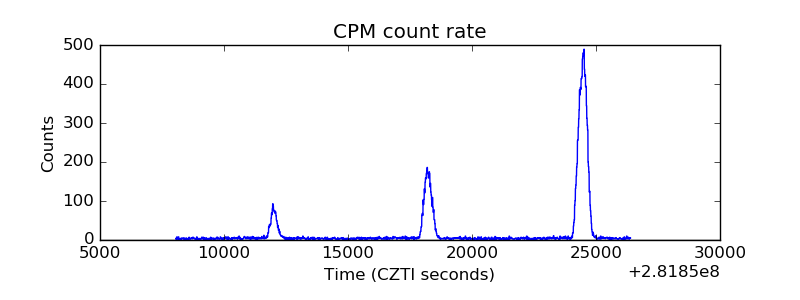 |
| CZT Counter | 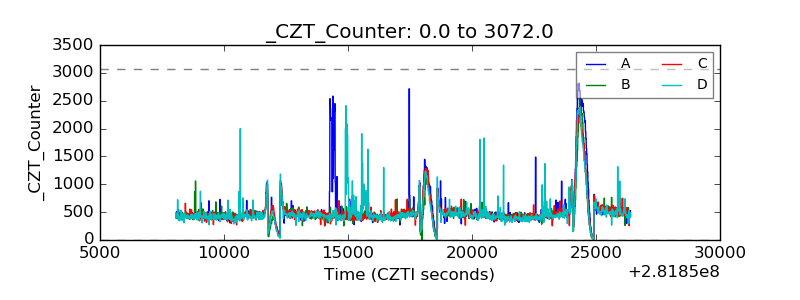 |
| +2.5 Volts monitor | 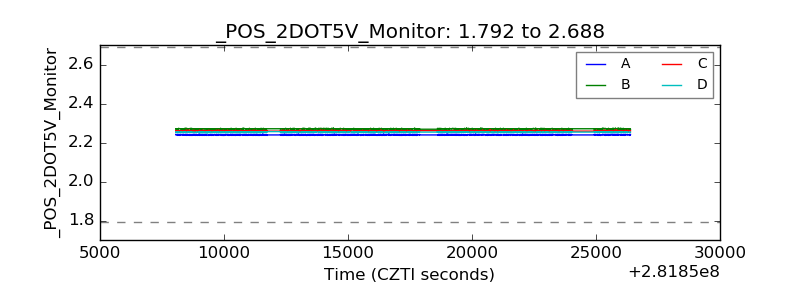 |
| +5 Volts monitor | 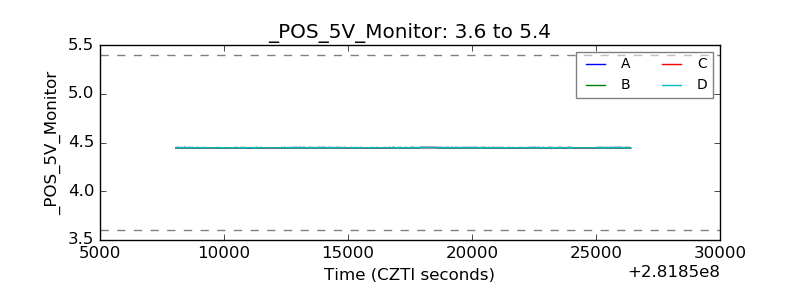 |
| _ROLL_ROT | 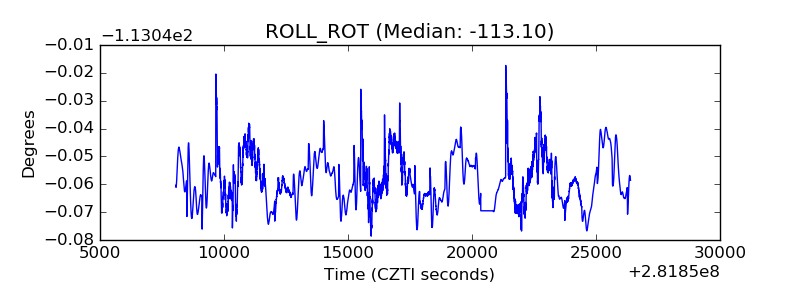 |
| _Roll_DEC | 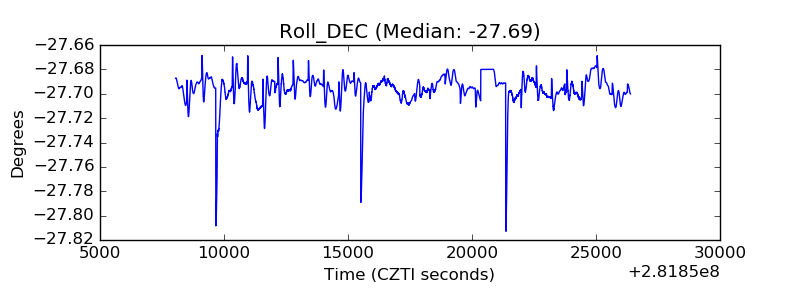 |
| _Roll_RA | 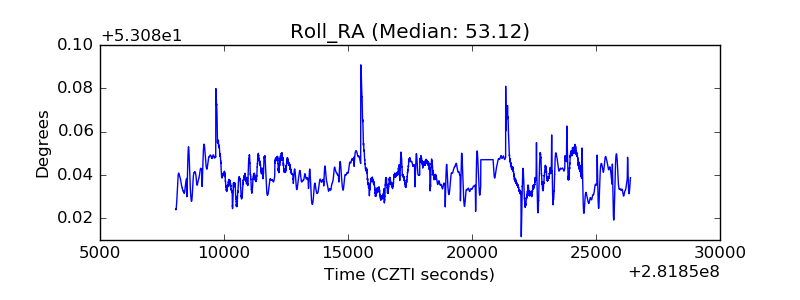 |
| Veto Counter | 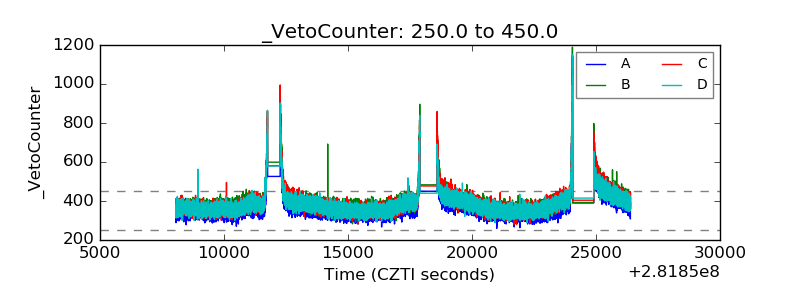 |