| Param | Original file | Final file |
|---|---|---|
| Filename | modeM0/AS1T03_059T01_9000002554_17263cztM0_level2.evt | modeM0/AS1T03_059T01_9000002554_17263cztM0_level2_quad_clean.evt |
| Size (bytes) | 1,232,827,200 | 230,400,000 |
| Size | 1.1 GB | 219.7 MB |
| Events in quadrant A | 8,890,737 | 1,456,099 |
| Events in quadrant B | 8,817,818 | 1,463,795 |
| Events in quadrant C | 8,837,458 | 1,392,889 |
| Events in quadrant D | 9,533,593 | 1,385,663 |
| Mode M9 | |||
|---|---|---|---|
| Quadrant | BADHDUFLAG | Total packets | Discarded packets |
| A | 0 | 26 | 0 |
| B | 0 | 26 | 0 |
| C | 0 | 26 | 0 |
| D | 0 | 26 | 0 |
| Mode SS | |||
|---|---|---|---|
| Quadrant | BADHDUFLAG | Total packets | Discarded packets |
| A | 0 | 376 | 0 |
| B | 0 | 376 | 0 |
| C | 0 | 376 | 0 |
| D | 0 | 376 | 0 |
| Mode M0 | |||
|---|---|---|---|
| Quadrant | BADHDUFLAG | Total packets | Discarded packets |
| A | 0 | 38729 | 5 |
| B | 0 | 38507 | 4 |
| C | 0 | 38731 | 4 |
| D | 0 | 41599 | 4 |
| Quadrant | Total seconds | Saturated seconds | Saturation percentage |
|---|---|---|---|
| A | 18582 | 240 | 1.291572% |
| B | 18582 | 303 | 1.630610% |
| C | 18582 | 364 | 1.958885% |
| D | 18582 | 471 | 2.534711% |
Noise dominated data is calculated using 1-second bins in cleaned event files. If a bin has >2000 counts, and if more than 50% of those come from <1% of pixels, then it is considered to be noise-dominated and hence unusable.
| Quadrant | # 1 sec bins | Bins with >0 counts | Bins with >2000 counts | High rate bins dominated by noise | Noise dominated (total time) | Noise dominated (detector-on time) | Marked lightcurve |
|---|---|---|---|---|---|---|---|
| A | 33370 | 18586 | 1 | 1 | 0.00% | 0.01% | 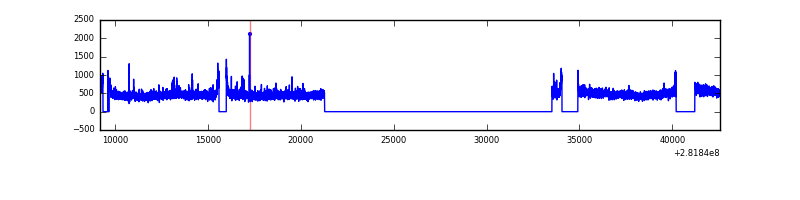 |
| B | 33370 | 18586 | 3 | 3 | 0.01% | 0.02% | 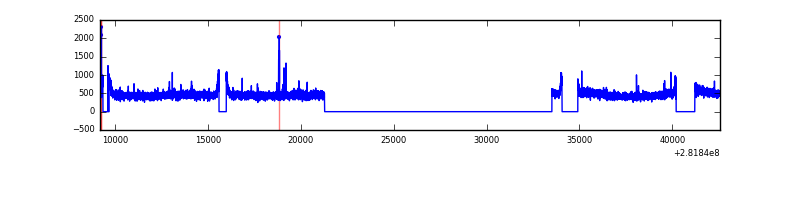 |
| C | 33370 | 18585 | 0 | 0 | 0.00% | 0.00% | 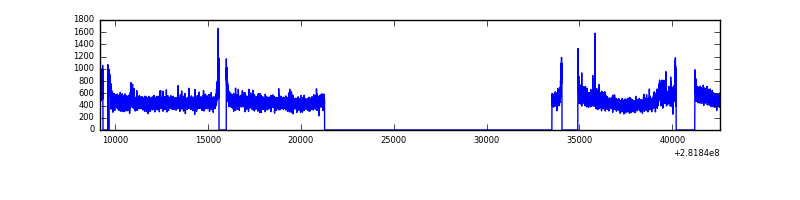 |
| D | 33370 | 18586 | 219 | 219 | 0.66% | 1.18% | 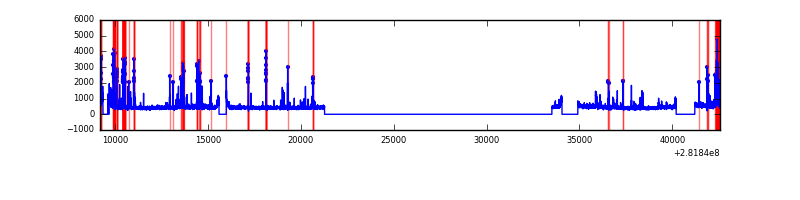 |
Top three noisy pixels from each quadrant. If the there are fewer than three noisy pixels in the level2.evt file, extra rows are filled as -1
| Pixel properties | Quadrant properties | ||||||
|---|---|---|---|---|---|---|---|
| Quadrant | DetID | PixID | Counts | Sigma | Mean | Median | Sigma |
| A | 0 | 23 | 239716 | 528.4 | 2243 | 2196 | 449.5 |
| A | 0 | 226 | 33527 | 69.7 | 2243 | 2196 | 449.5 |
| A | 0 | 13 | 17145 | 33.26 | 2243 | 2196 | 449.5 |
| B | 0 | 230 | 56462 | 126.11 | 2236 | 2176 | 430.5 |
| B | 12 | 111 | 52940 | 117.93 | 2236 | 2176 | 430.5 |
| B | 11 | 111 | 46178 | 102.22 | 2236 | 2176 | 430.5 |
| C | 14 | 238 | 327431 | 648.48 | 2142 | 2154 | 501.6 |
| C | 3 | 233 | 156203 | 307.12 | 2142 | 2154 | 501.6 |
| C | 13 | 61 | 14922 | 25.45 | 2142 | 2154 | 501.6 |
| D | 1 | 52 | 503994 | 955.65 | 2170 | 2106 | 525.2 |
| D | 11 | 176 | 321193 | 607.58 | 2170 | 2106 | 525.2 |
| D | 13 | 189 | 202257 | 381.11 | 2170 | 2106 | 525.2 |
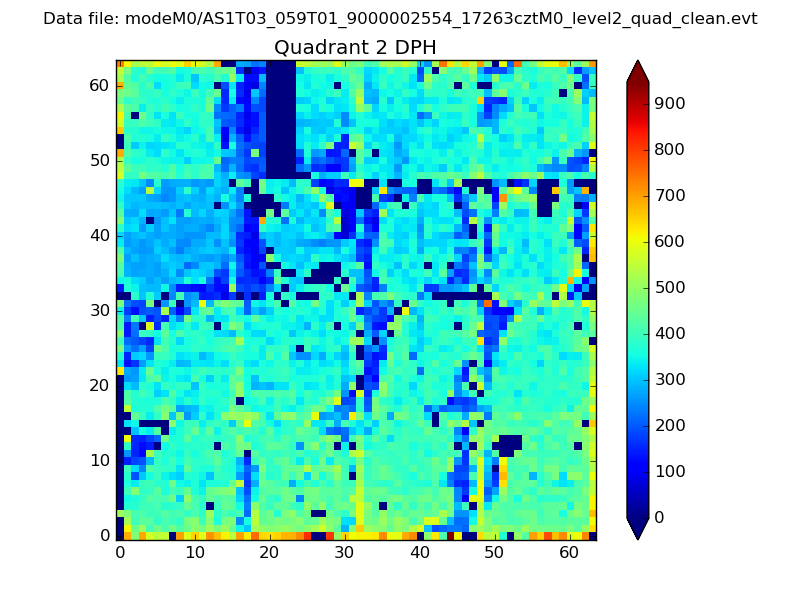
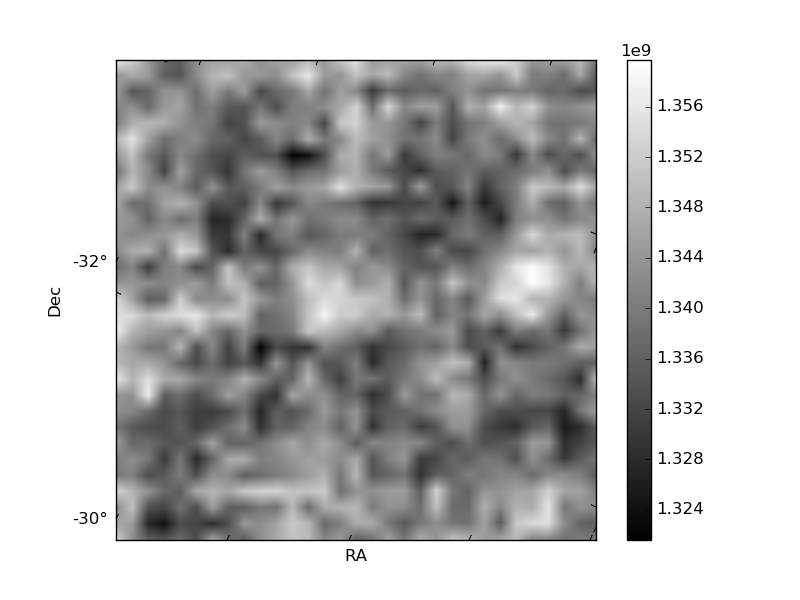
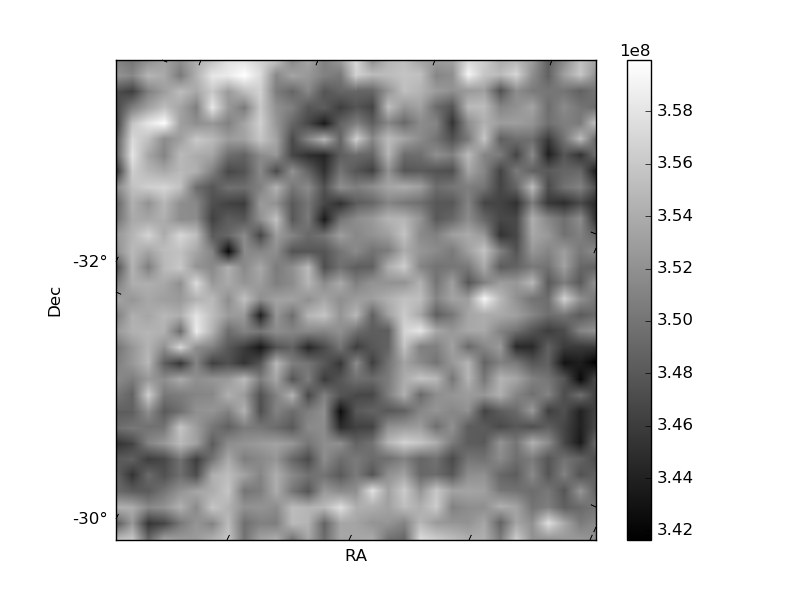
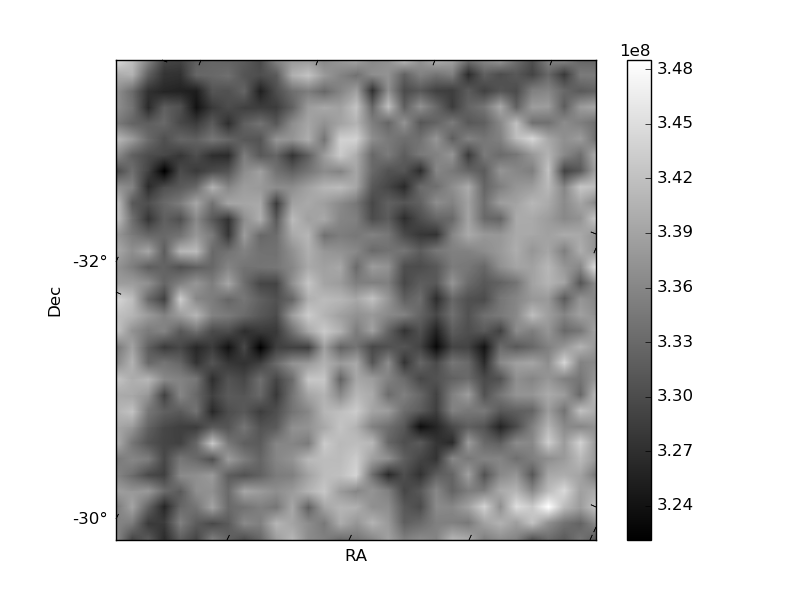
Histogram calculated using DETX and DETY for each event in the final _common_clean file
| Quadrant A | 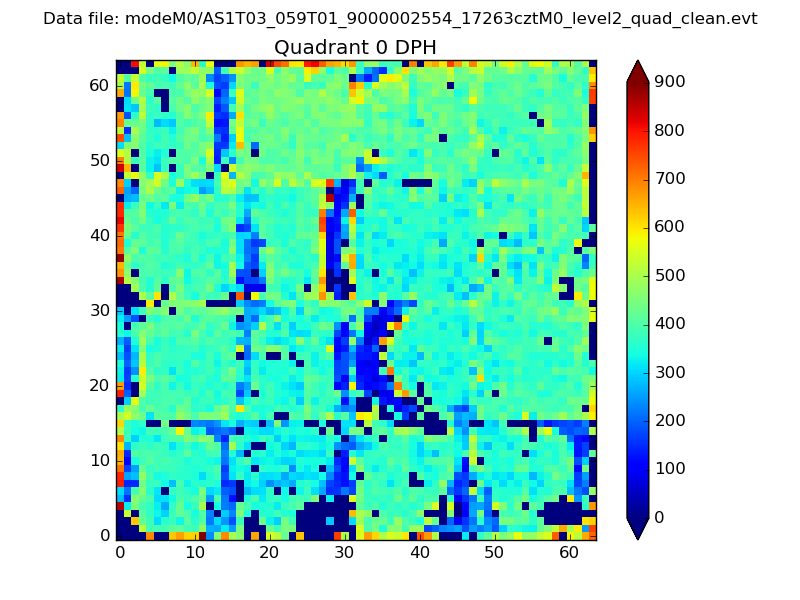 |
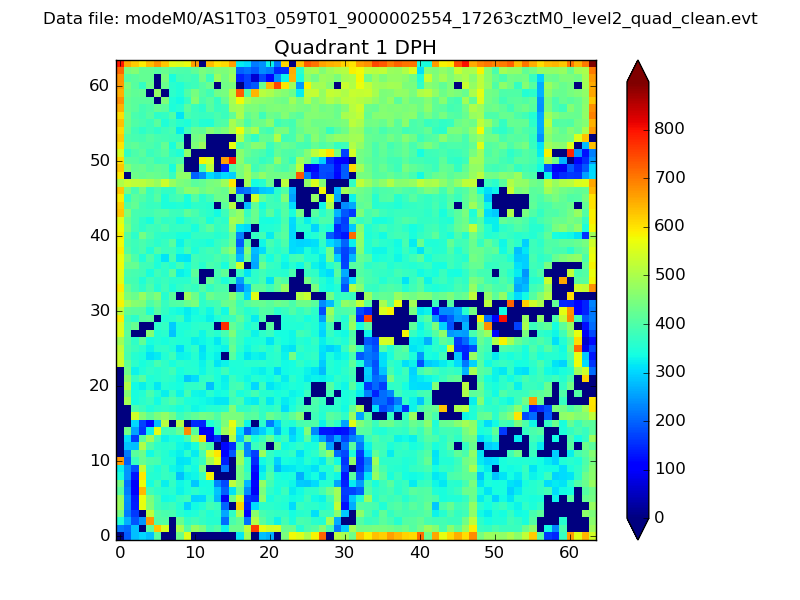 |
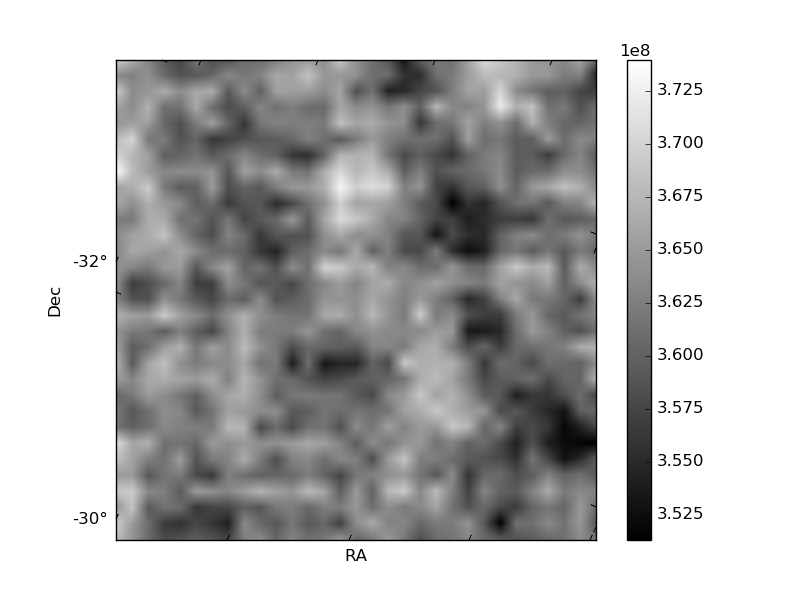
Quadrant B |
|---|---|---|---|
| Quadrant D | 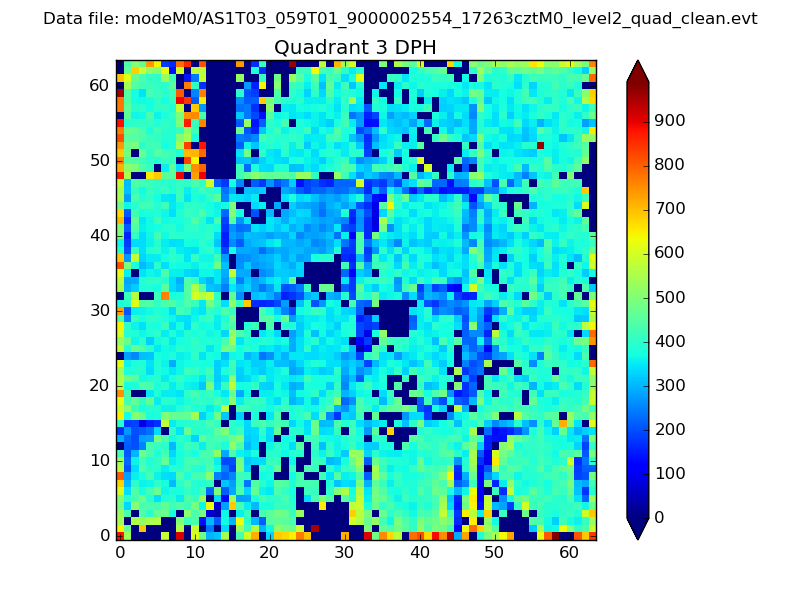 |
 |
Quadrant C |
| Plot type | Count rate plots | Images |
|---|---|---|
| Comparison with Poisson distribution Blue bars denote a histogram of data divided into 1 sec bins. Red curve is a Poisson curve with rate = median count rate of data. |
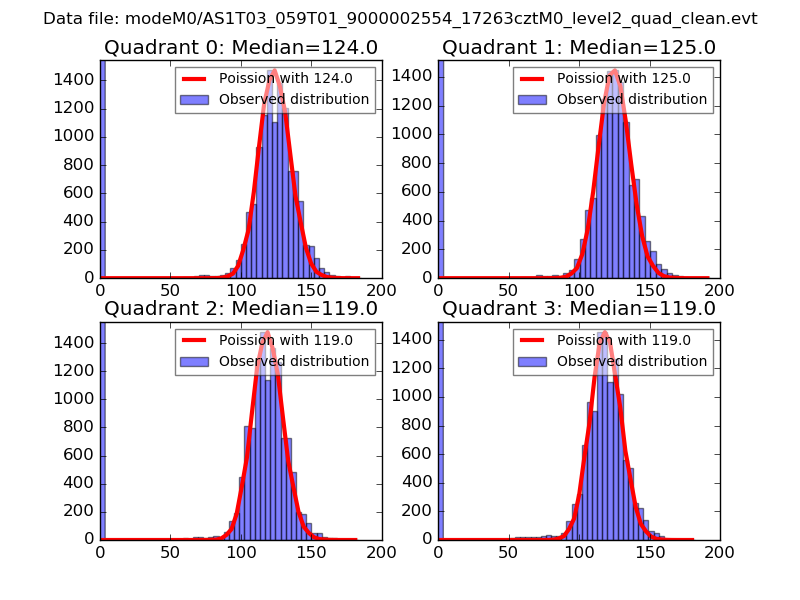 |
 |
| Quadrant-wise count rates Data is divided into 100 sec bins |
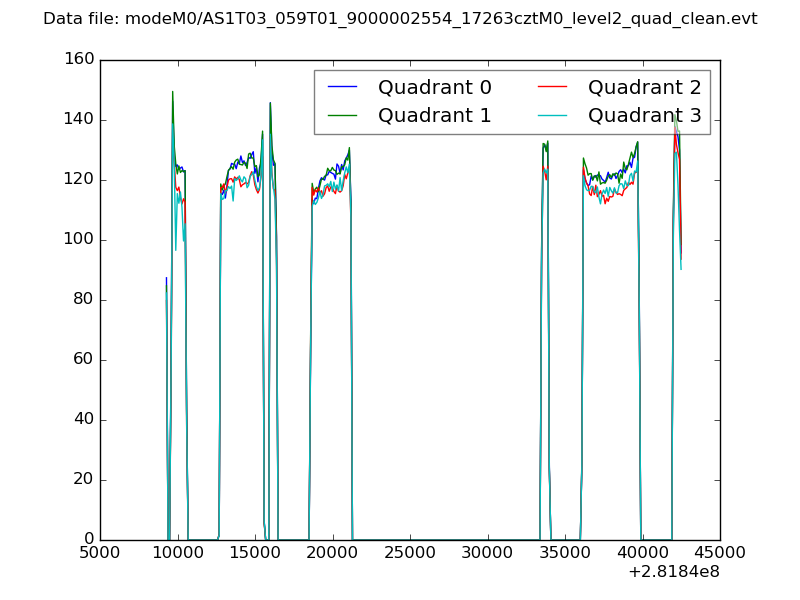 |
|
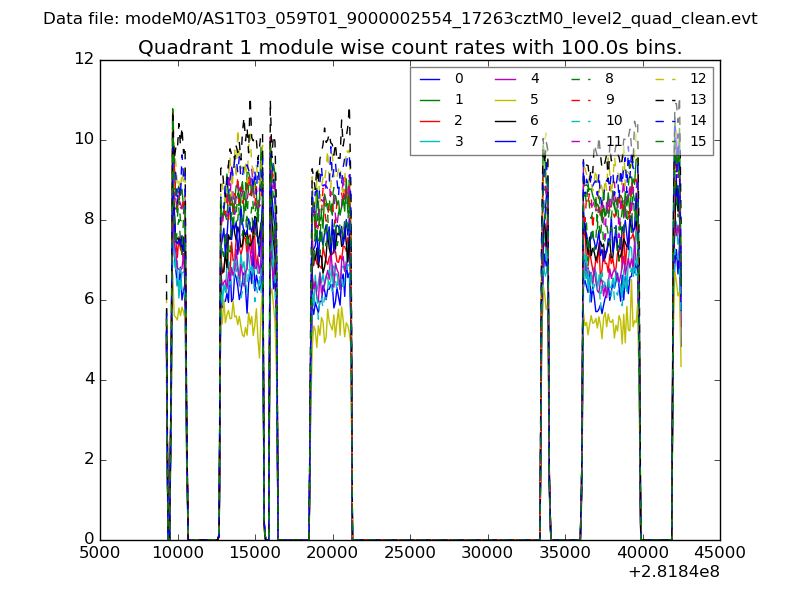
| Module-wise count rates for Quadrant A Data is divided into 100 sec bins |
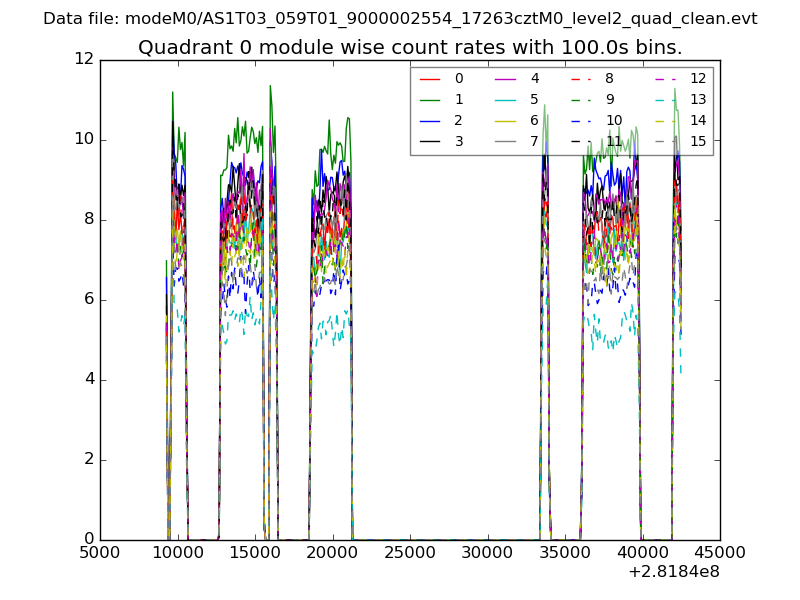 |
 |
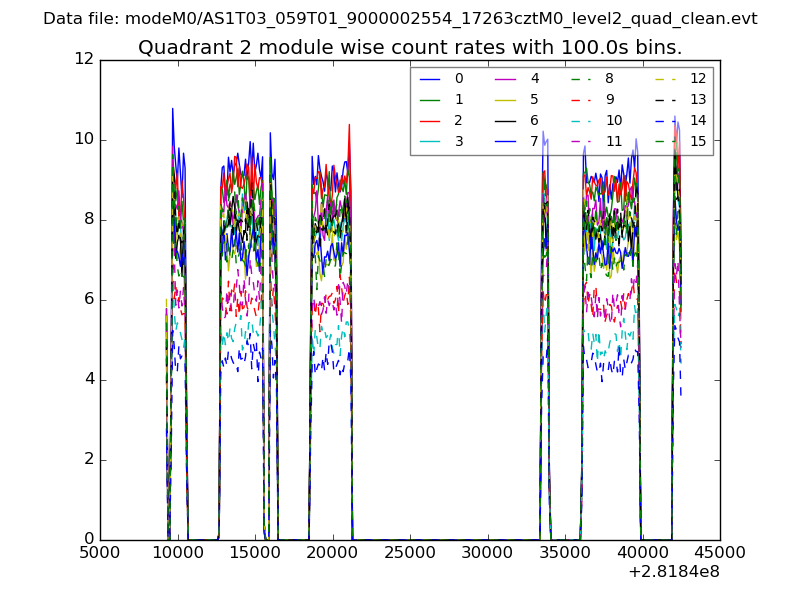
| Module-wise count rates for Quadrant B Data is divided into 100 sec bins |
 |
 |
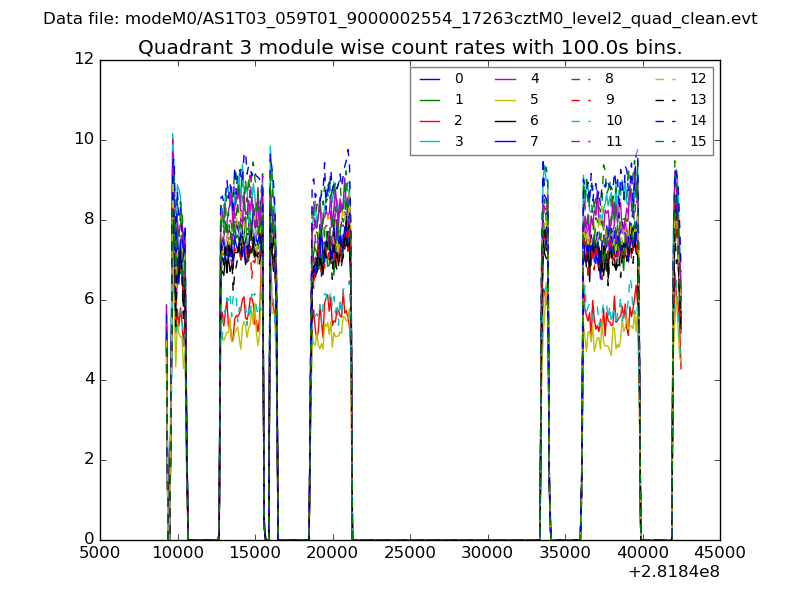
| Module-wise count rates for Quadrant C Data is divided into 100 sec bins |
 |
 |
| Module-wise count rates for Quadrant D Data is divided into 100 sec bins |
 |
 |
| Parameter | Plot |
|---|---|
| CZT HV Monitor | 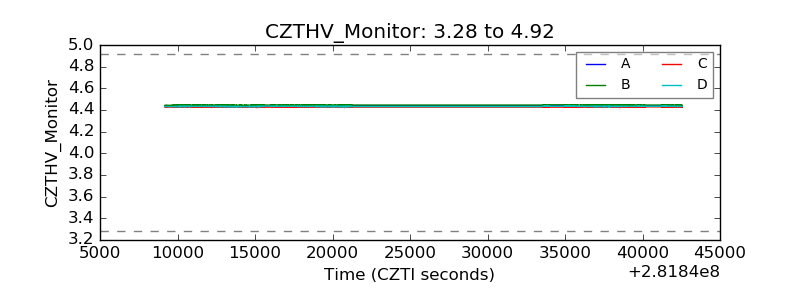 |
| D_VDD | 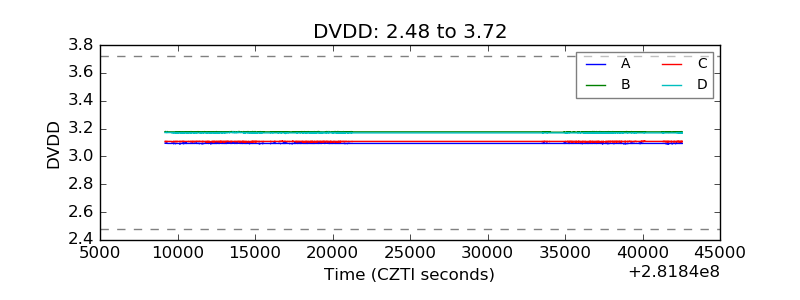 |
| Temperature 1 | 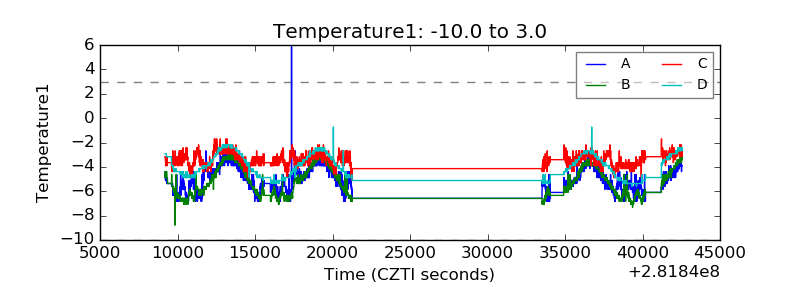 |
| Veto HV Monitor |  |
| Veto LLD | 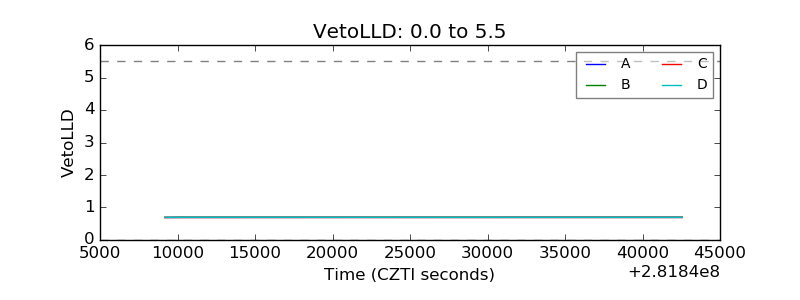 |
| Alpha Counter | 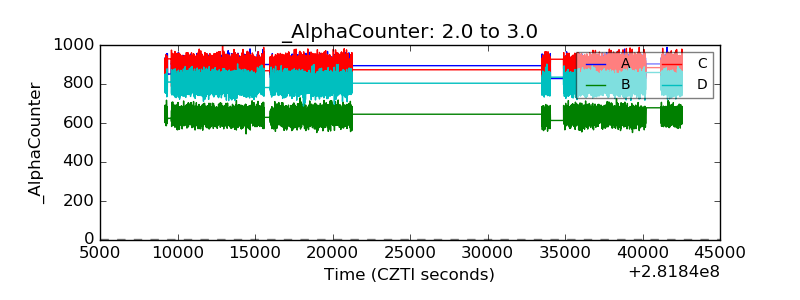 |
| _CPM_Rate | 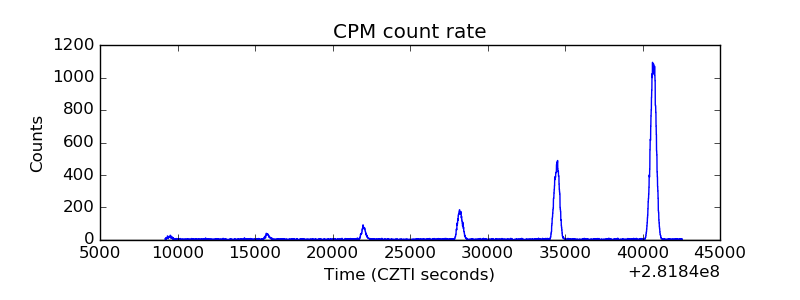 |
| CZT Counter | 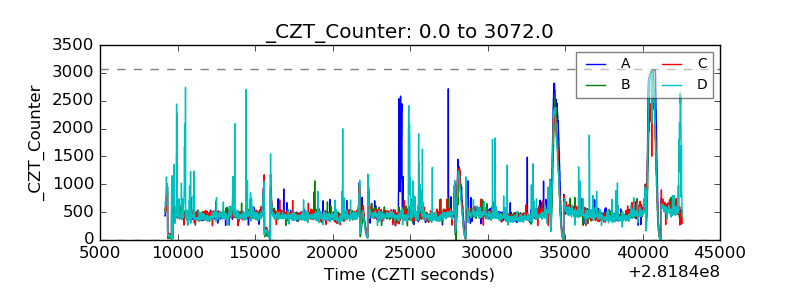 |
| +2.5 Volts monitor |  |
| +5 Volts monitor |  |
| _ROLL_ROT | 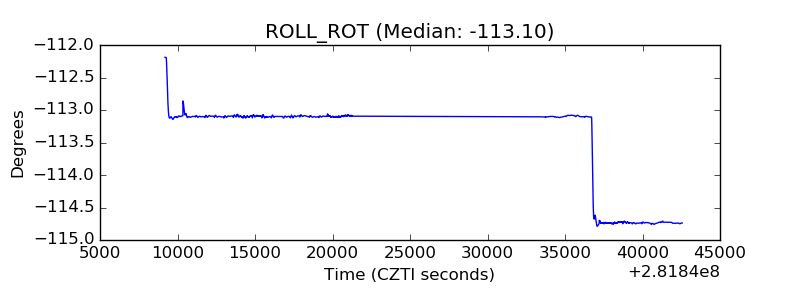 |
| _Roll_DEC | 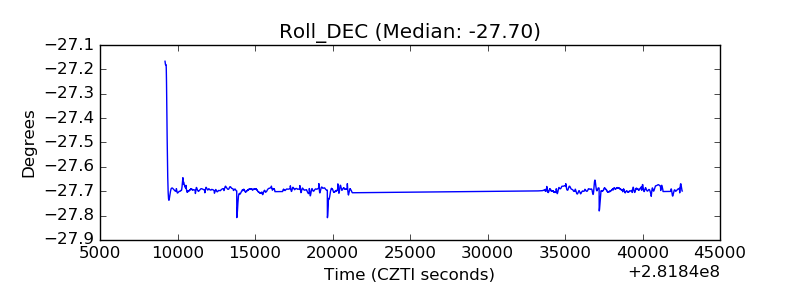 |
| _Roll_RA | 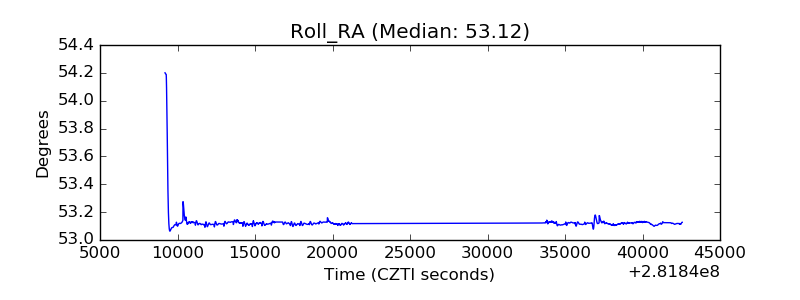 |
| Veto Counter | 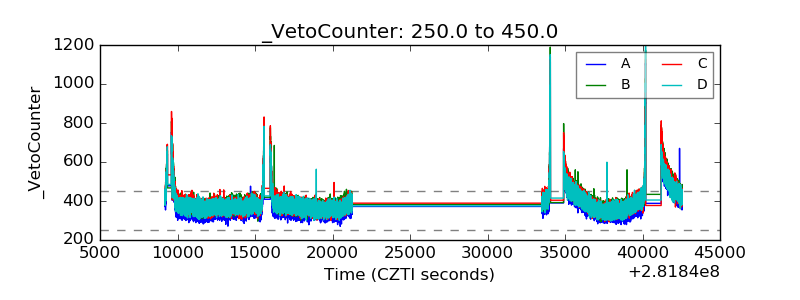 |