| Param | Original file | Final file |
|---|---|---|
| Filename | modeM0/AS1T03_059T01_9000002554_17269cztM0_level2.evt | modeM0/AS1T03_059T01_9000002554_17269cztM0_level2_quad_clean.evt |
| Size (bytes) | 663,842,880 | 89,161,920 |
| Size | 633.1 MB | 85.0 MB |
| Events in quadrant A | 4,349,854 | 600,246 |
| Events in quadrant B | 3,227,496 | 623,070 |
| Events in quadrant C | 3,152,668 | 577,969 |
| Events in quadrant D | 8,930,423 | 440,379 |
| Mode M9 | |||
|---|---|---|---|
| Quadrant | BADHDUFLAG | Total packets | Discarded packets |
| A | 0 | 13 | 0 |
| B | 0 | 14 | 0 |
| C | 0 | 14 | 0 |
| D | 0 | 14 | 0 |
| Mode SS | |||
|---|---|---|---|
| Quadrant | BADHDUFLAG | Total packets | Discarded packets |
| A | 0 | 134 | 0 |
| B | 0 | 134 | 0 |
| C | 0 | 134 | 0 |
| D | 0 | 134 | 0 |
| Mode M0 | |||
|---|---|---|---|
| Quadrant | BADHDUFLAG | Total packets | Discarded packets |
| A | 0 | 17209 | 2 |
| B | 0 | 13763 | 2 |
| C | 0 | 13640 | 2 |
| D | 0 | 30980 | 2 |
| Quadrant | Total seconds | Saturated seconds | Saturation percentage |
|---|---|---|---|
| A | 6559 | 319 | 4.863546% |
| B | 6558 | 62 | 0.945410% |
| C | 6558 | 84 | 1.280878% |
| D | 6558 | 1912 | 29.155230% |
Noise dominated data is calculated using 1-second bins in cleaned event files. If a bin has >2000 counts, and if more than 50% of those come from <1% of pixels, then it is considered to be noise-dominated and hence unusable.
| Quadrant | # 1 sec bins | Bins with >0 counts | Bins with >2000 counts | High rate bins dominated by noise | Noise dominated (total time) | Noise dominated (detector-on time) | Marked lightcurve |
|---|---|---|---|---|---|---|---|
| A | 7774 | 6560 | 189 | 189 | 2.43% | 2.88% | 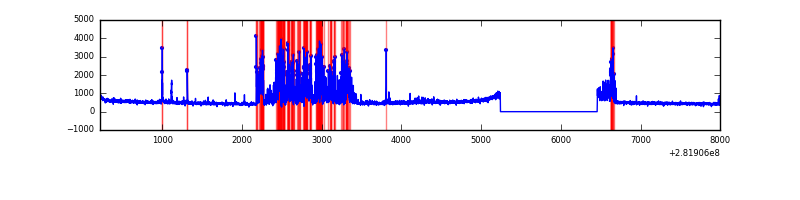 |
| B | 7773 | 6559 | 1 | 1 | 0.01% | 0.02% | 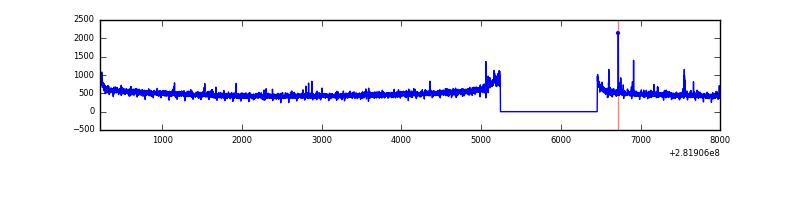 |
| C | 7773 | 6559 | 0 | 0 | 0.00% | 0.00% | 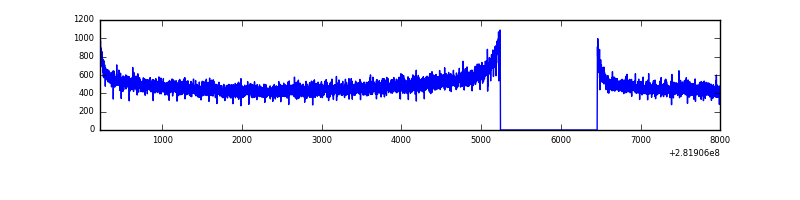 |
| D | 7773 | 6559 | 1810 | 1810 | 23.29% | 27.60% | 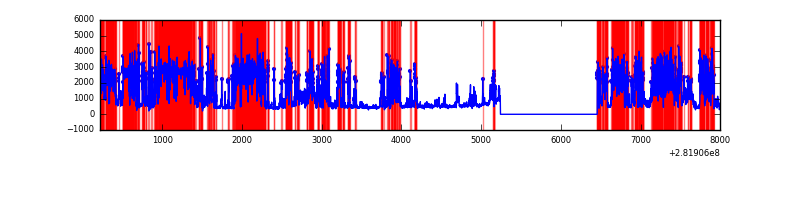 |
Top three noisy pixels from each quadrant. If the there are fewer than three noisy pixels in the level2.evt file, extra rows are filled as -1
| Pixel properties | Quadrant properties | ||||||
|---|---|---|---|---|---|---|---|
| Quadrant | DetID | PixID | Counts | Sigma | Mean | Median | Sigma |
| A | 14 | 235 | 1235650 | 7583.45 | 806 | 791 | 162.8 |
| A | 0 | 23 | 10723 | 60.99 | 806 | 791 | 162.8 |
| A | 0 | 226 | 7744 | 42.7 | 806 | 791 | 162.8 |
| B | 12 | 111 | 18424 | 112.3 | 820 | 801 | 156.9 |
| B | 11 | 111 | 15995 | 96.82 | 820 | 801 | 156.9 |
| B | 14 | 111 | 13940 | 83.73 | 820 | 801 | 156.9 |
| C | 14 | 238 | 121037 | 667.61 | 772 | 779 | 180.1 |
| C | 3 | 233 | 21269 | 113.75 | 772 | 779 | 180.1 |
| C | 13 | 61 | 5415 | 25.74 | 772 | 779 | 180.1 |
| D | 11 | 176 | 5873682 | 35328.29 | 686 | 666 | 166.2 |
| D | 10 | 70 | 173718 | 1040.97 | 686 | 666 | 166.2 |
| D | 2 | 33 | 101761 | 608.12 | 686 | 666 | 166.2 |
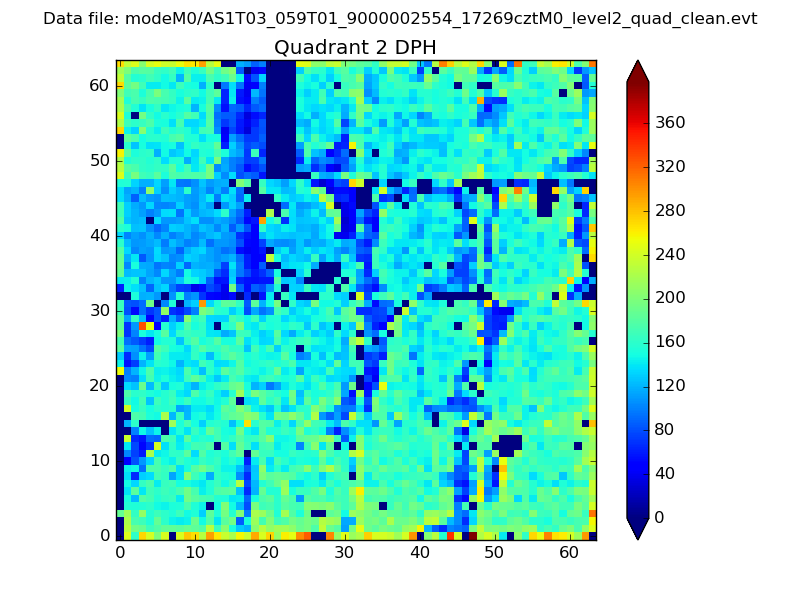
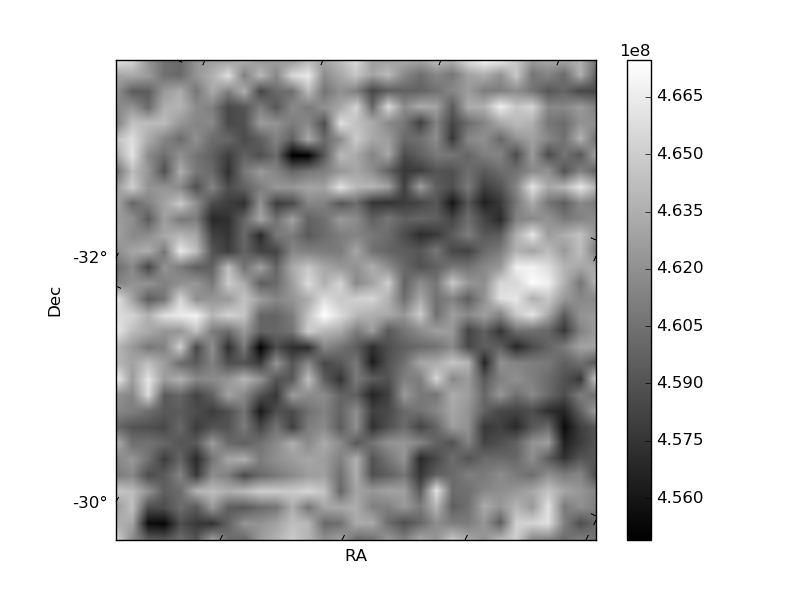
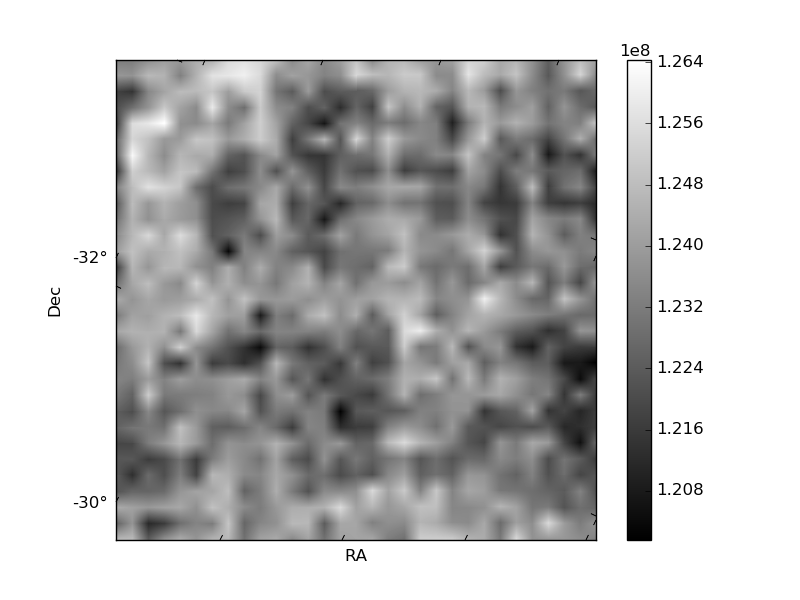
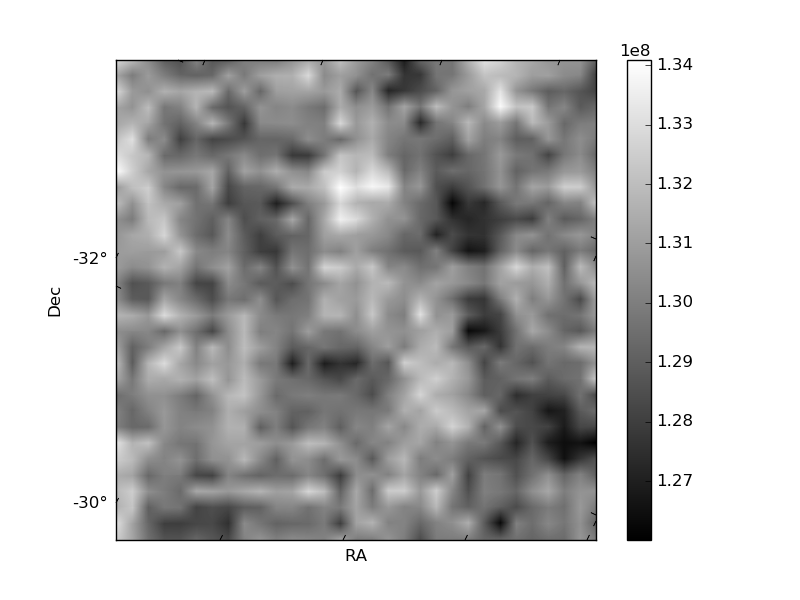
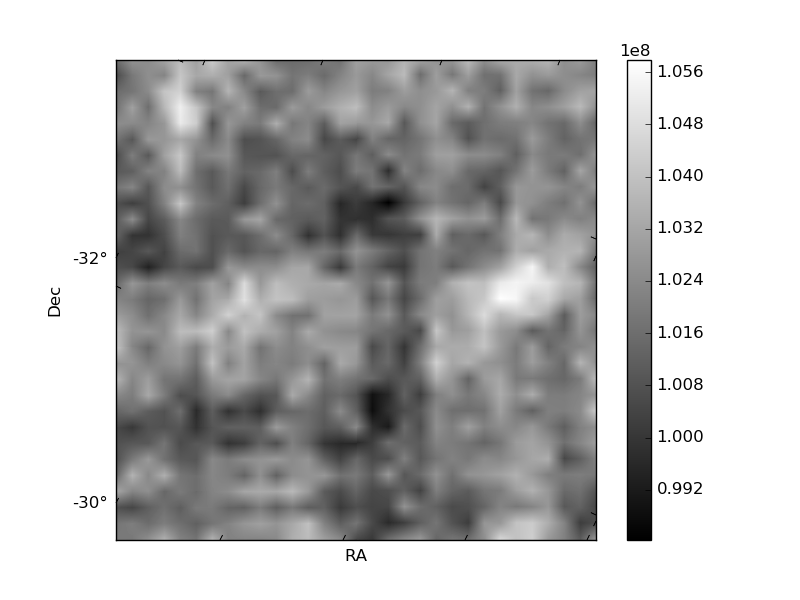
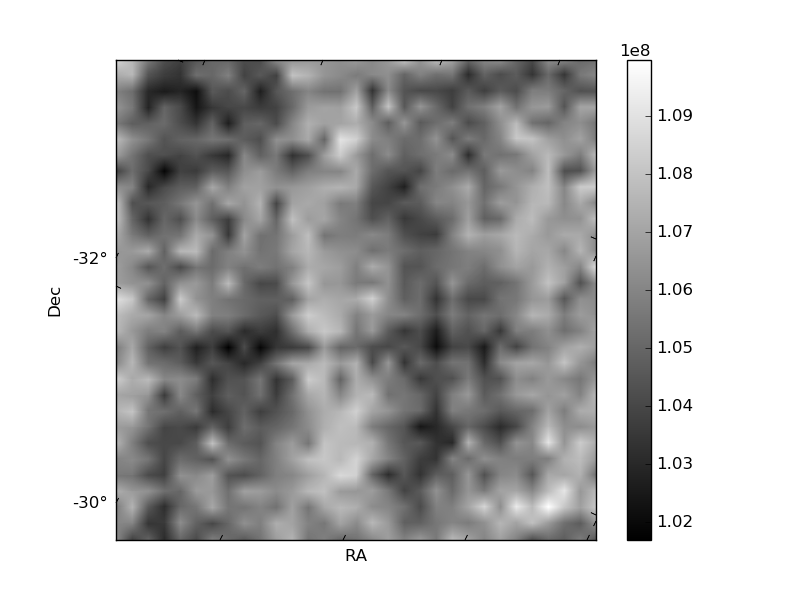
Histogram calculated using DETX and DETY for each event in the final _common_clean file
| Quadrant A | 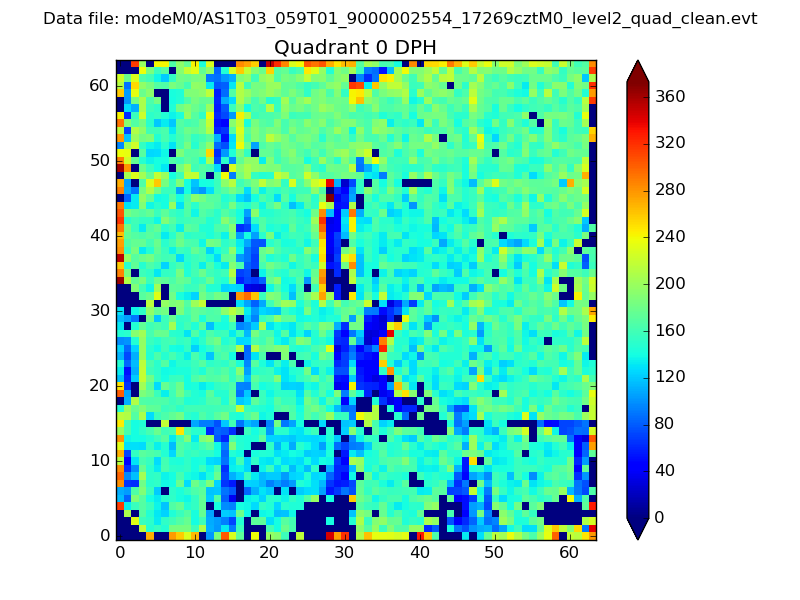 |
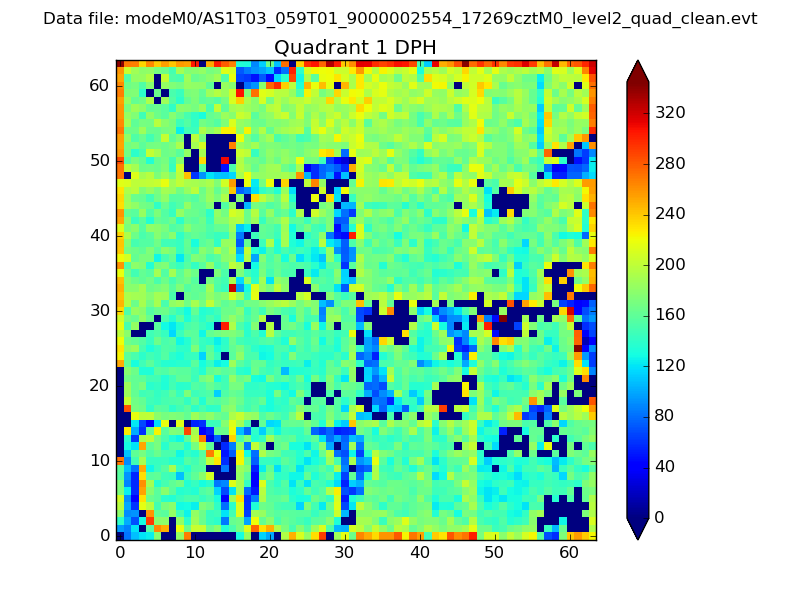 |
Quadrant B |
|---|---|---|---|
| Quadrant D | 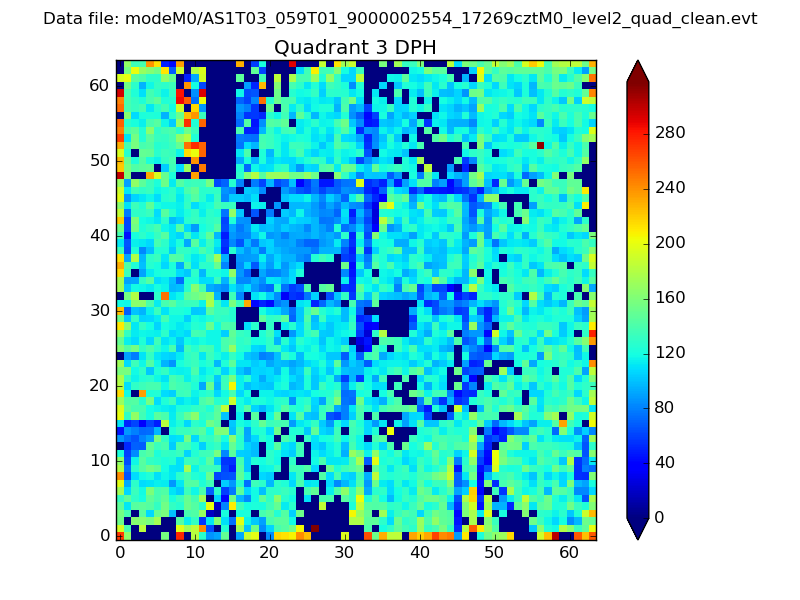 |
 |
Quadrant C |
| Plot type | Count rate plots | Images |
|---|---|---|
| Comparison with Poisson distribution Blue bars denote a histogram of data divided into 1 sec bins. Red curve is a Poisson curve with rate = median count rate of data. |
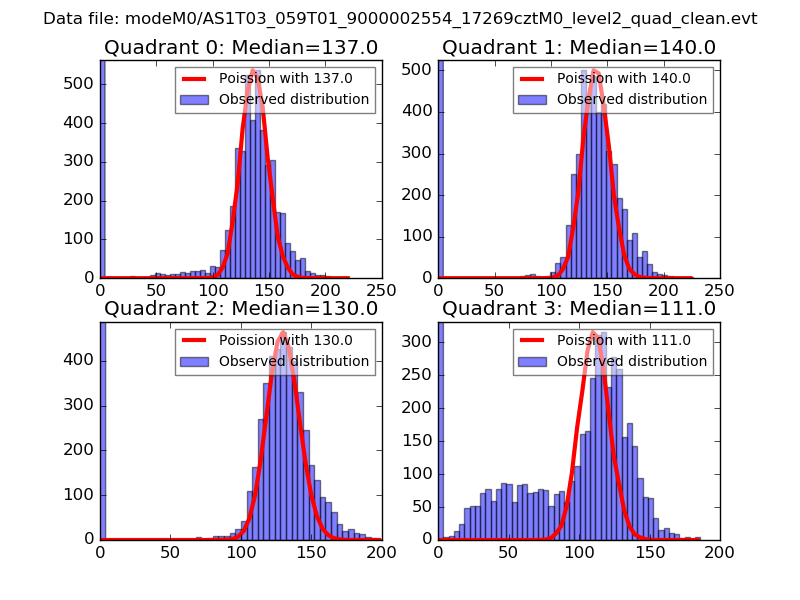 |
 |
| Quadrant-wise count rates Data is divided into 100 sec bins |
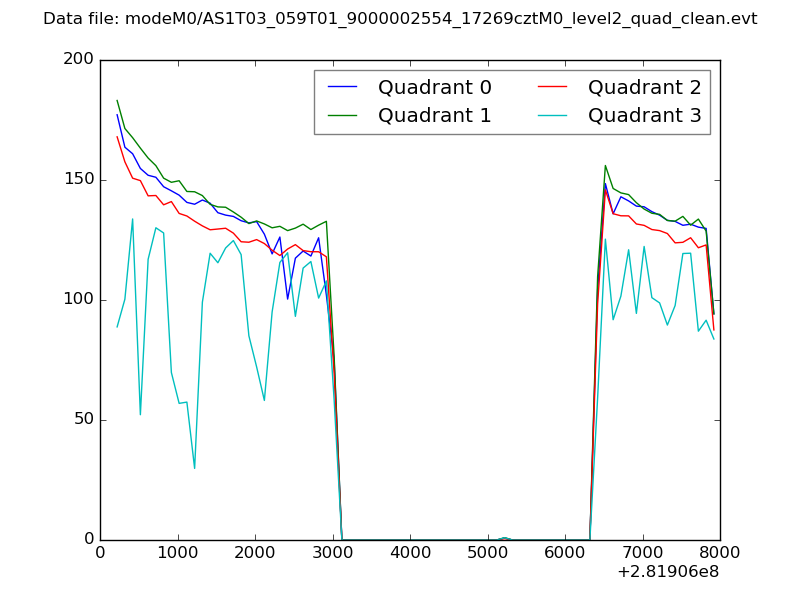 |
|
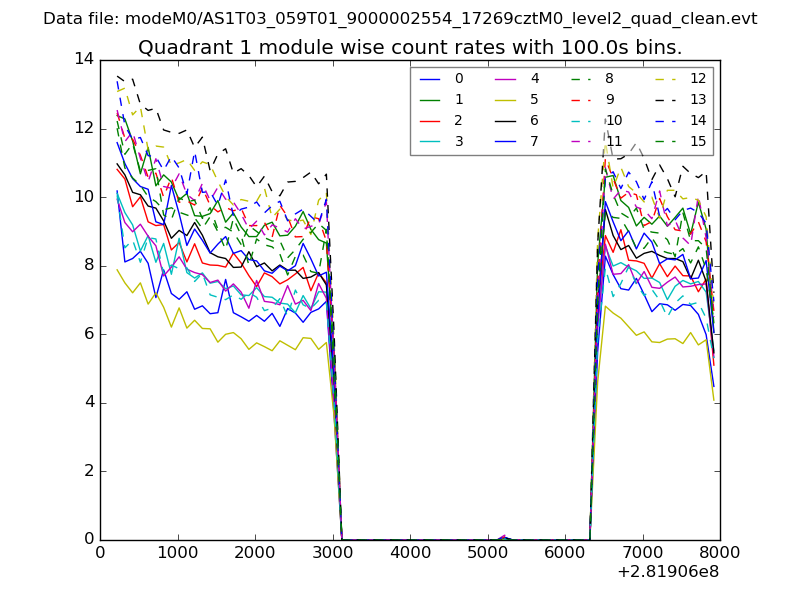
| Module-wise count rates for Quadrant A Data is divided into 100 sec bins |
 |
 |
| Module-wise count rates for Quadrant B Data is divided into 100 sec bins |
 |
 |
| Module-wise count rates for Quadrant C Data is divided into 100 sec bins |
 |
 |
| Module-wise count rates for Quadrant D Data is divided into 100 sec bins |
 |
 |
| Parameter | Plot |
|---|---|
| CZT HV Monitor |  |
| D_VDD | 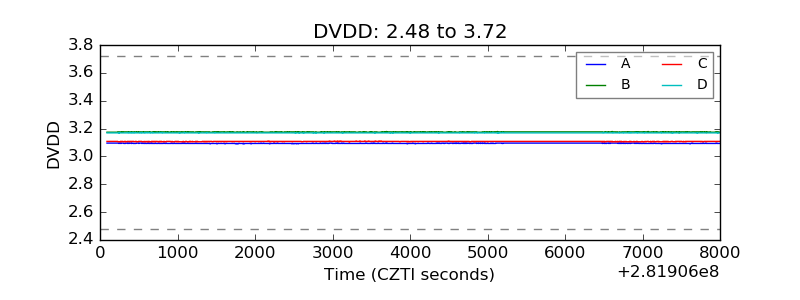 |
| Temperature 1 |  |
| Veto HV Monitor | 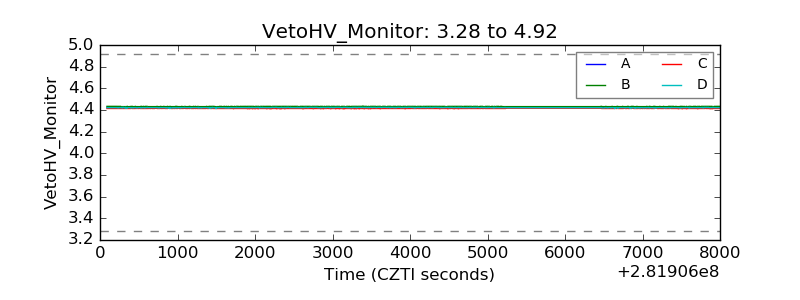 |
| Veto LLD | 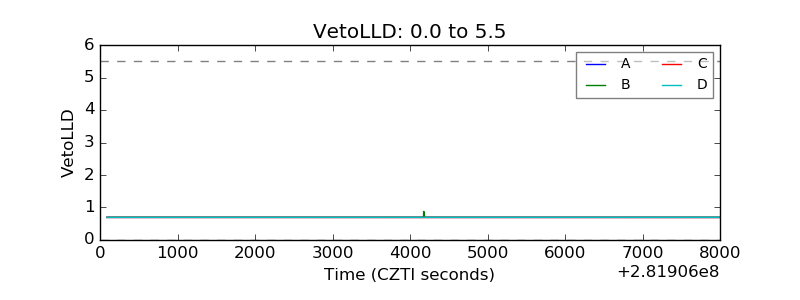 |
| Alpha Counter | 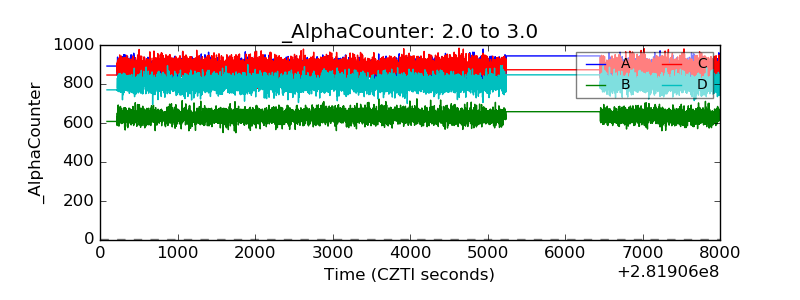 |
| _CPM_Rate | 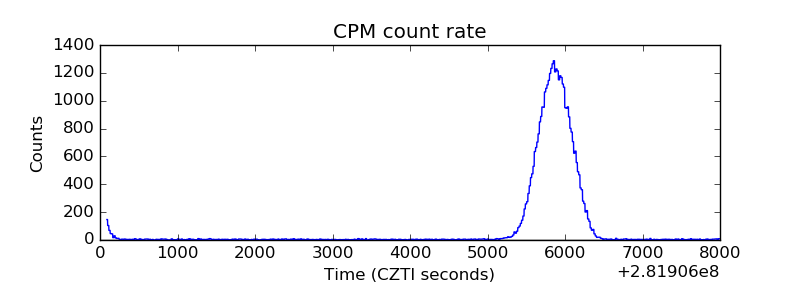 |
| CZT Counter | 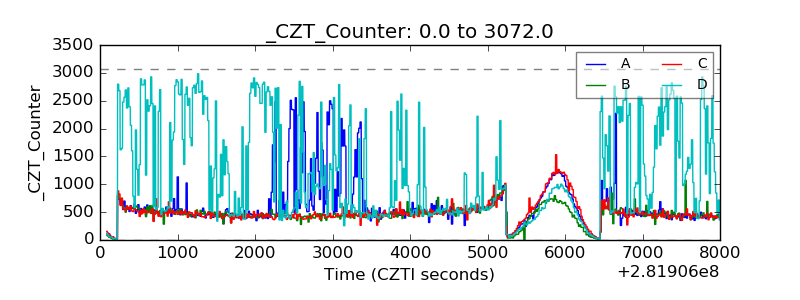 |
| +2.5 Volts monitor |  |
| +5 Volts monitor |  |
| _ROLL_ROT | 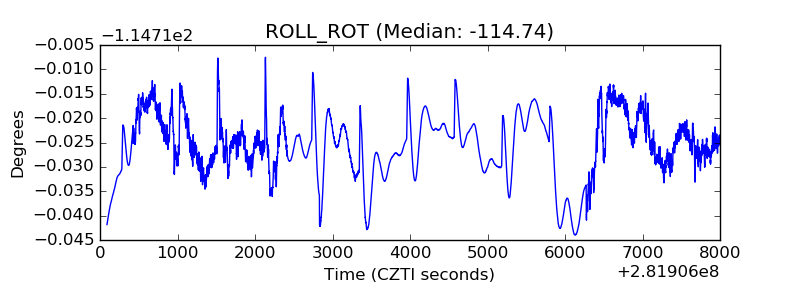 |
| _Roll_DEC | 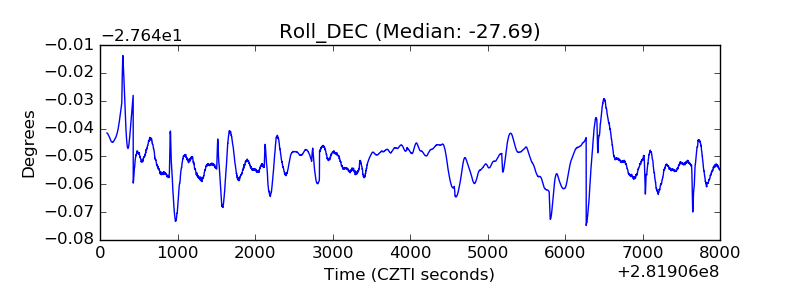 |
| _Roll_RA | 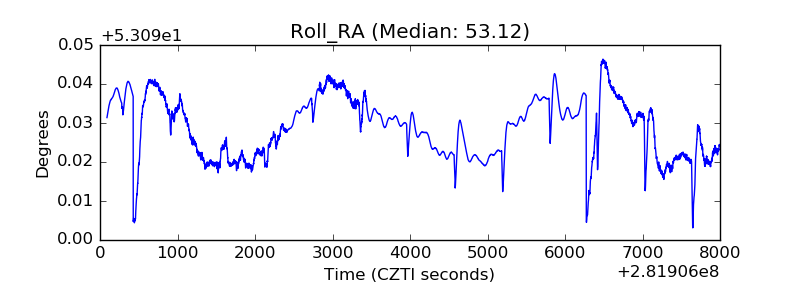 |
| Veto Counter | 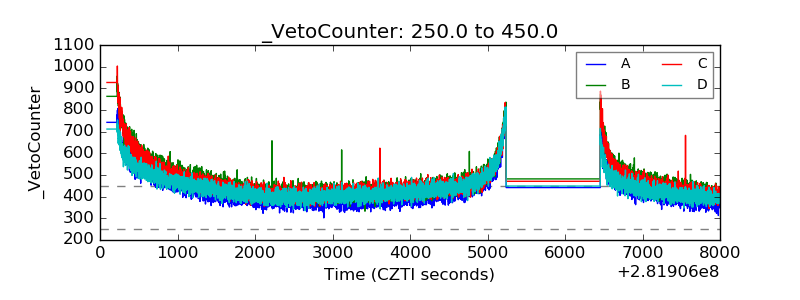 |