| Param | Original file | Final file |
|---|---|---|
| Filename | modeM0/AS1T03_059T01_9000002554_17270cztM0_level2.evt | modeM0/AS1T03_059T01_9000002554_17270cztM0_level2_quad_clean.evt |
| Size (bytes) | 566,683,200 | 92,520,000 |
| Size | 540.4 MB | 88.2 MB |
| Events in quadrant A | 3,399,873 | 608,779 |
| Events in quadrant B | 3,212,960 | 618,304 |
| Events in quadrant C | 3,182,188 | 580,056 |
| Events in quadrant D | 6,907,913 | 522,455 |
| Mode M9 | |||
|---|---|---|---|
| Quadrant | BADHDUFLAG | Total packets | Discarded packets |
| A | 0 | 19 | 0 |
| B | 0 | 20 | 0 |
| C | 0 | 20 | 0 |
| D | 0 | 20 | 0 |
| Mode SS | |||
|---|---|---|---|
| Quadrant | BADHDUFLAG | Total packets | Discarded packets |
| A | 0 | 138 | 0 |
| B | 0 | 138 | 0 |
| C | 0 | 138 | 0 |
| D | 0 | 138 | 0 |
| Mode M0 | |||
|---|---|---|---|
| Quadrant | BADHDUFLAG | Total packets | Discarded packets |
| A | 0 | 14764 | 2 |
| B | 0 | 13997 | 2 |
| C | 0 | 13881 | 2 |
| D | 0 | 25303 | 2 |
| Quadrant | Total seconds | Saturated seconds | Saturation percentage |
|---|---|---|---|
| A | 6769 | 74 | 1.093219% |
| B | 6769 | 42 | 0.620476% |
| C | 6769 | 44 | 0.650022% |
| D | 6769 | 999 | 14.758458% |
Noise dominated data is calculated using 1-second bins in cleaned event files. If a bin has >2000 counts, and if more than 50% of those come from <1% of pixels, then it is considered to be noise-dominated and hence unusable.
| Quadrant | # 1 sec bins | Bins with >0 counts | Bins with >2000 counts | High rate bins dominated by noise | Noise dominated (total time) | Noise dominated (detector-on time) | Marked lightcurve |
|---|---|---|---|---|---|---|---|
| A | 7764 | 6770 | 19 | 19 | 0.24% | 0.28% | 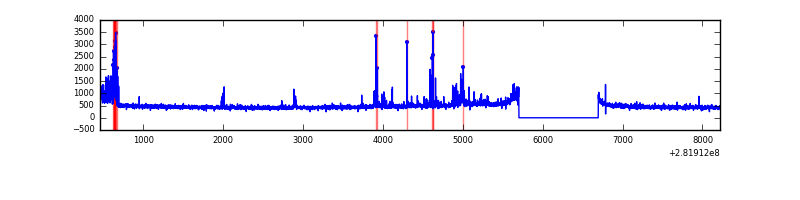 |
| B | 7764 | 6770 | 1 | 1 | 0.01% | 0.01% | 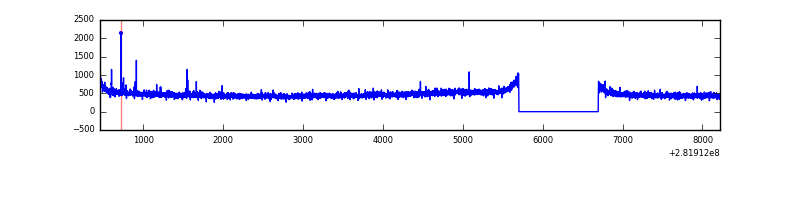 |
| C | 7764 | 6770 | 0 | 0 | 0.00% | 0.00% |  |
| D | 7764 | 6770 | 914 | 914 | 11.77% | 13.50% | 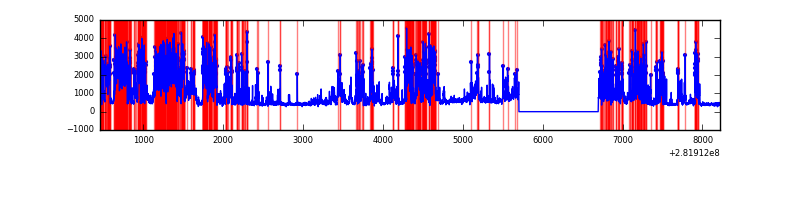 |
Top three noisy pixels from each quadrant. If the there are fewer than three noisy pixels in the level2.evt file, extra rows are filled as -1
| Pixel properties | Quadrant properties | ||||||
|---|---|---|---|---|---|---|---|
| Quadrant | DetID | PixID | Counts | Sigma | Mean | Median | Sigma |
| A | 14 | 235 | 277345 | 1674.48 | 811 | 794 | 165.2 |
| A | 0 | 226 | 7108 | 38.23 | 811 | 794 | 165.2 |
| A | 3 | 137 | 6123 | 32.27 | 811 | 794 | 165.2 |
| B | 12 | 111 | 19039 | 116.06 | 817 | 795 | 157.2 |
| B | 11 | 111 | 16306 | 98.67 | 817 | 795 | 157.2 |
| B | 14 | 111 | 14051 | 84.33 | 817 | 795 | 157.2 |
| C | 14 | 238 | 119091 | 645.9 | 777 | 781 | 183.2 |
| C | 3 | 233 | 35507 | 189.58 | 777 | 781 | 183.2 |
| C | 13 | 61 | 5596 | 26.29 | 777 | 781 | 183.2 |
| D | 11 | 176 | 3539165 | 19665.16 | 742 | 721 | 179.9 |
| D | 13 | 189 | 250651 | 1389.0 | 742 | 721 | 179.9 |
| D | 10 | 70 | 157855 | 873.28 | 742 | 721 | 179.9 |
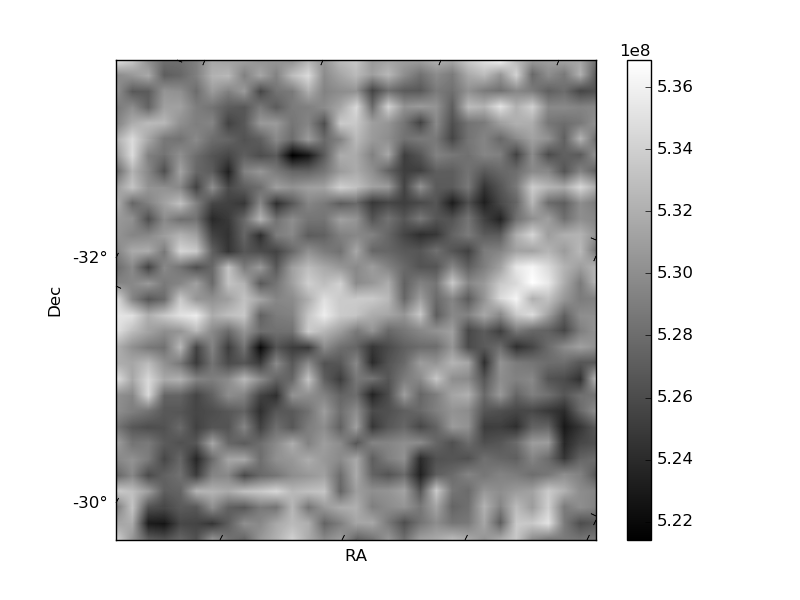
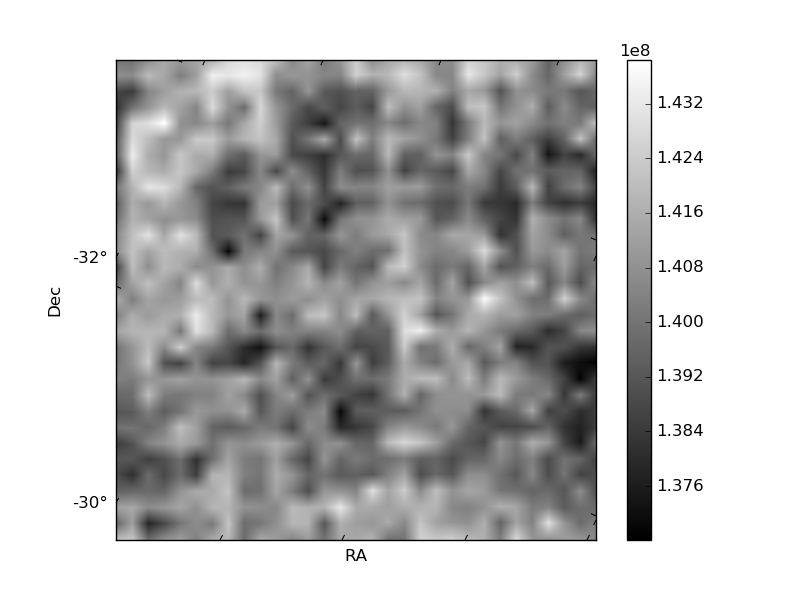
Histogram calculated using DETX and DETY for each event in the final _common_clean file
| Quadrant A | 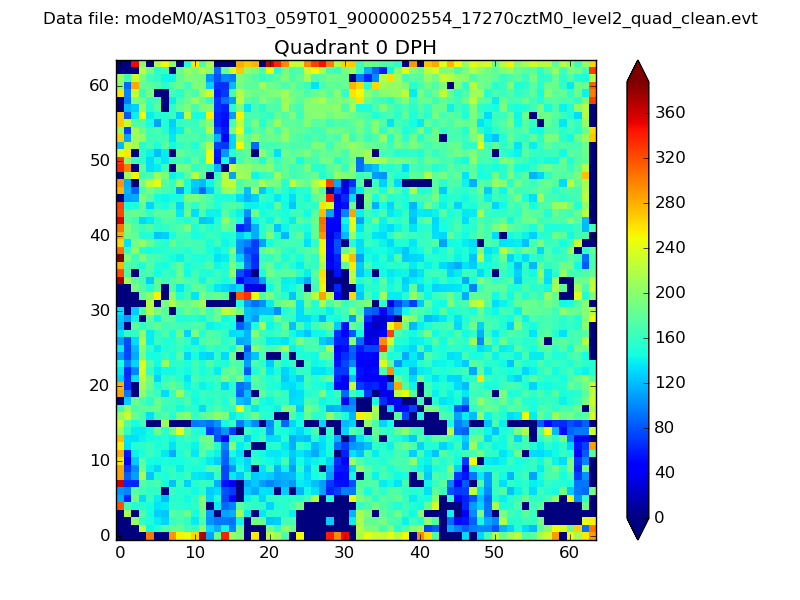 |
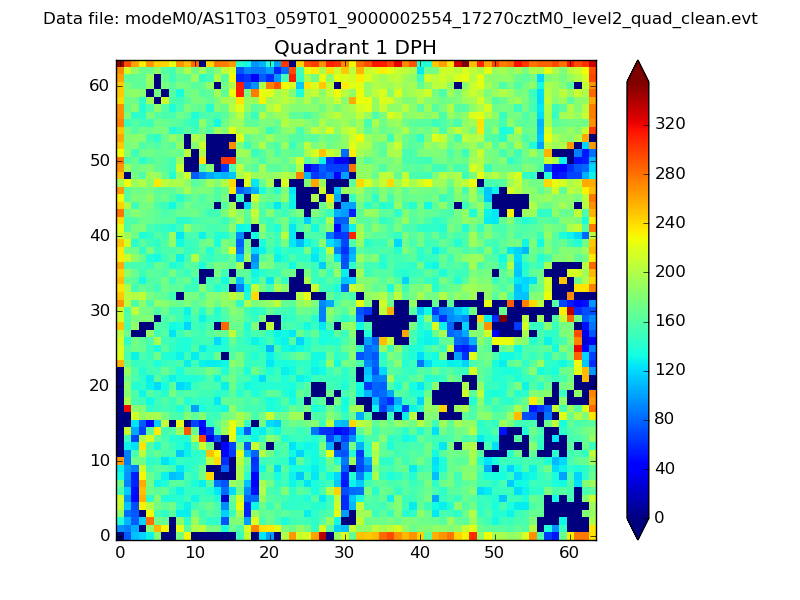 |
Quadrant B |
|---|---|---|---|
| Quadrant D |  |
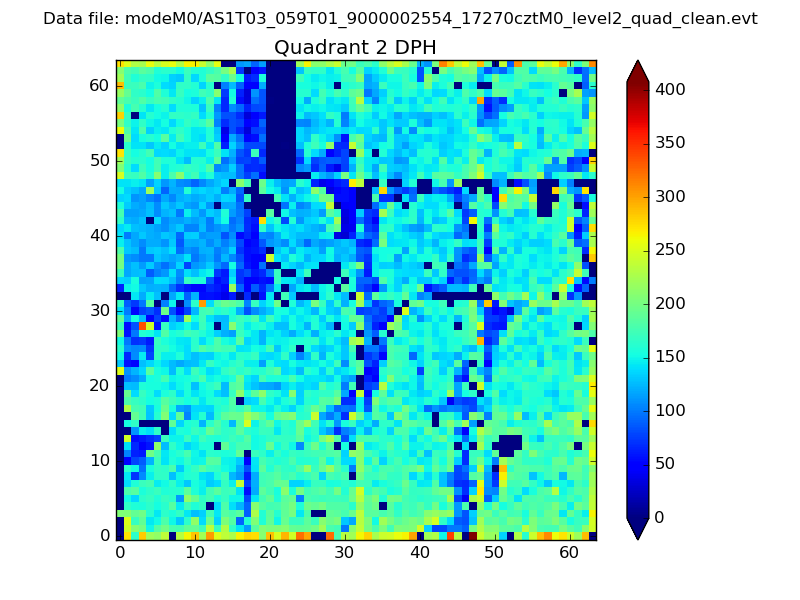 |
Quadrant C |
| Plot type | Count rate plots | Images |
|---|---|---|
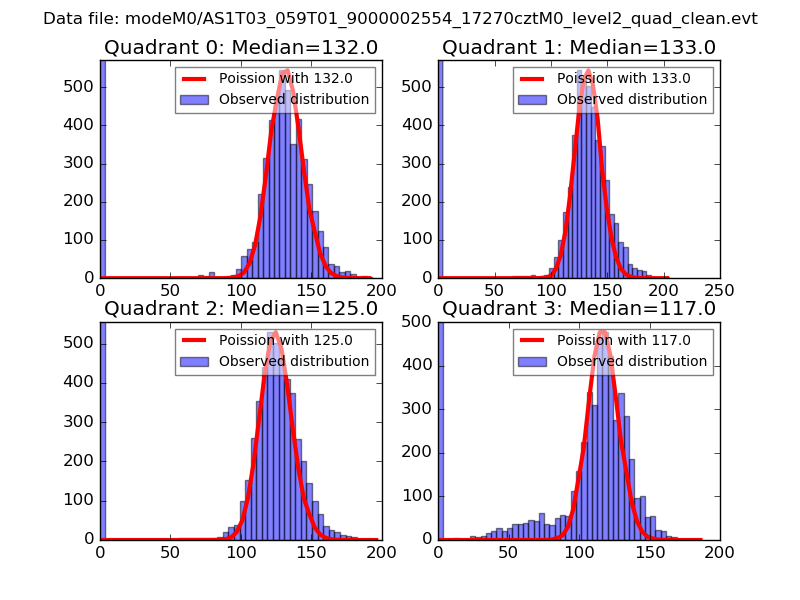
| Comparison with Poisson distribution Blue bars denote a histogram of data divided into 1 sec bins. Red curve is a Poisson curve with rate = median count rate of data. |
 |
 |
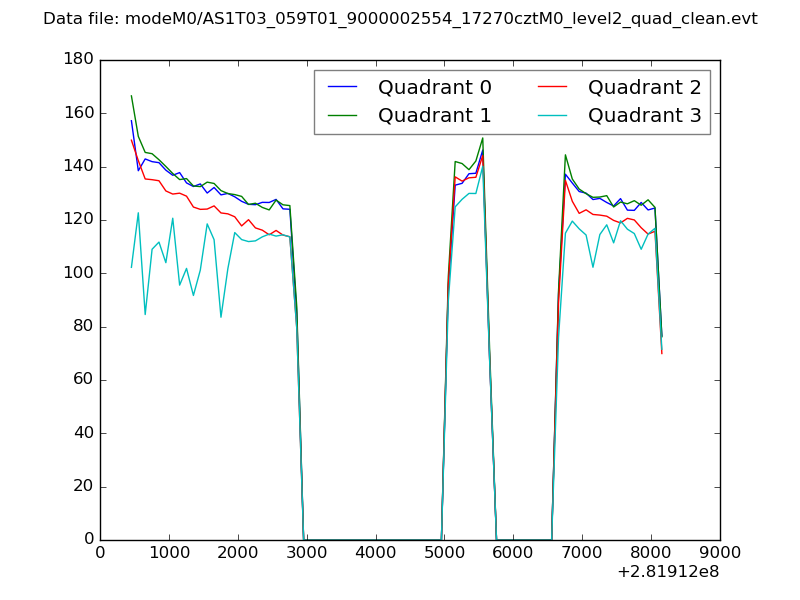
| Quadrant-wise count rates Data is divided into 100 sec bins |
 |
|
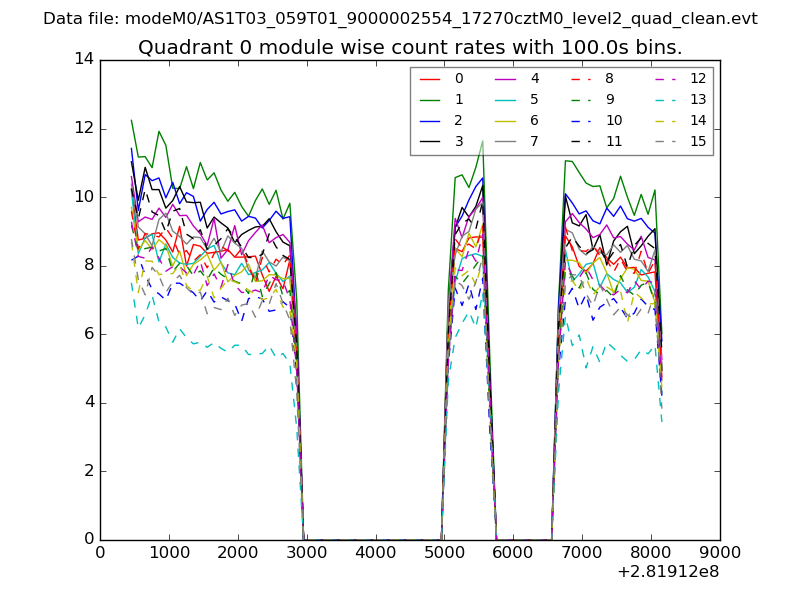
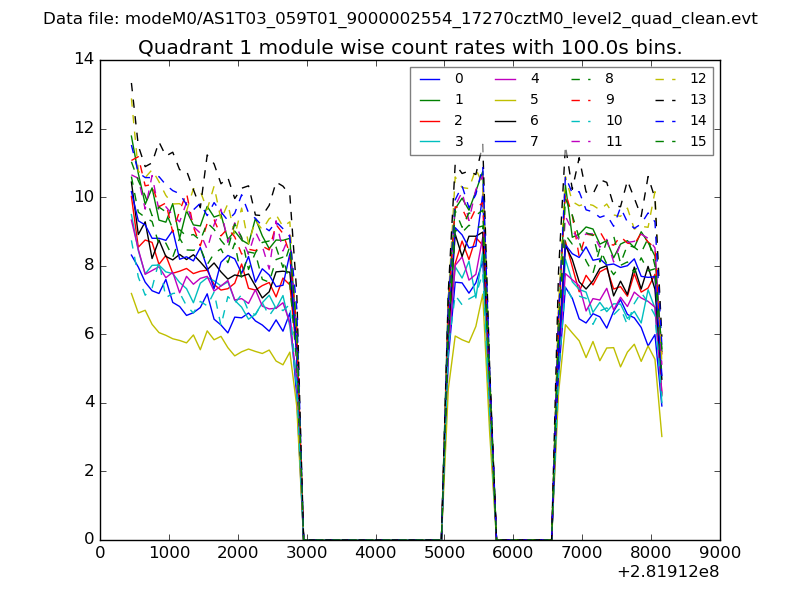
| Module-wise count rates for Quadrant A Data is divided into 100 sec bins |
 |
 |
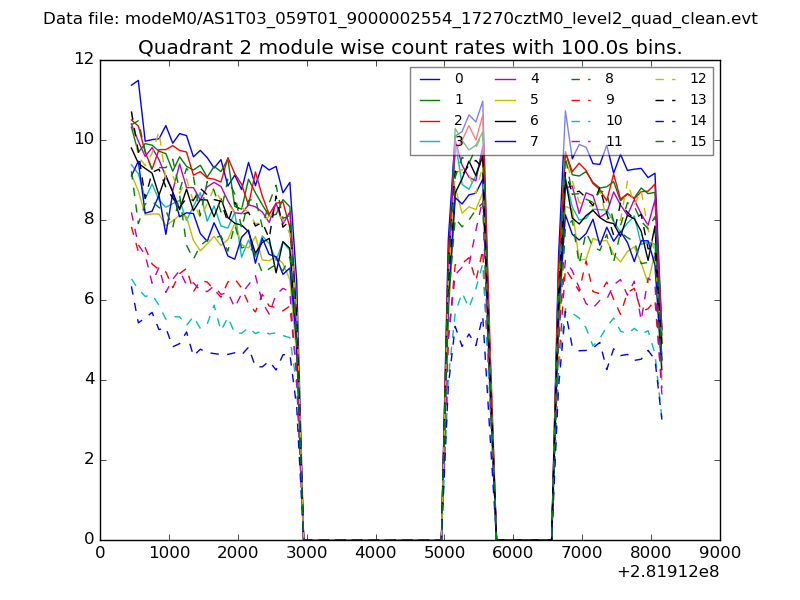
| Module-wise count rates for Quadrant B Data is divided into 100 sec bins |
 |
 |
| Module-wise count rates for Quadrant C Data is divided into 100 sec bins |
 |
 |
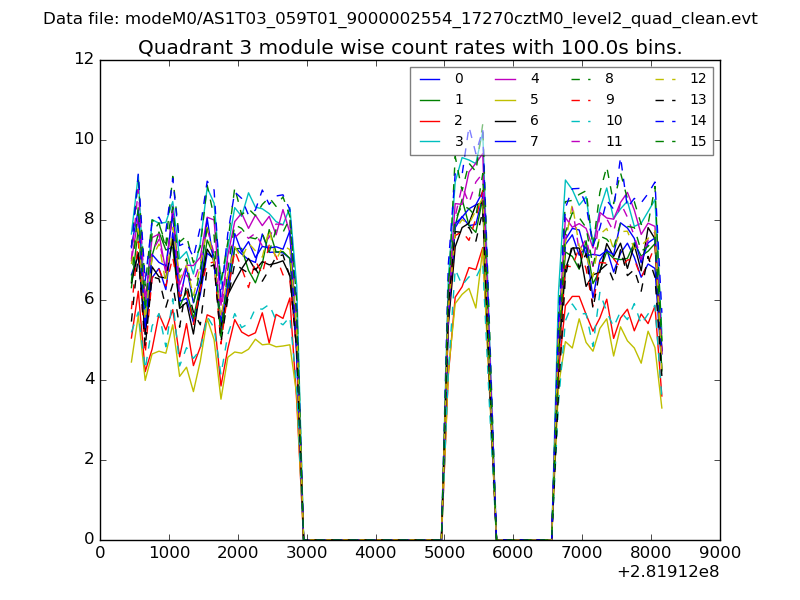
| Module-wise count rates for Quadrant D Data is divided into 100 sec bins |
 |
 |
| Parameter | Plot |
|---|---|
| CZT HV Monitor | 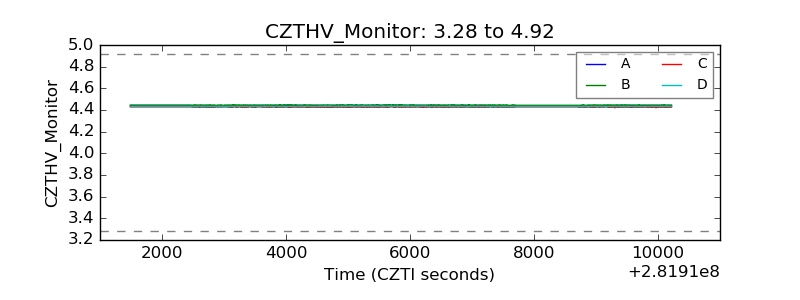 |
| D_VDD |  |
| Temperature 1 | 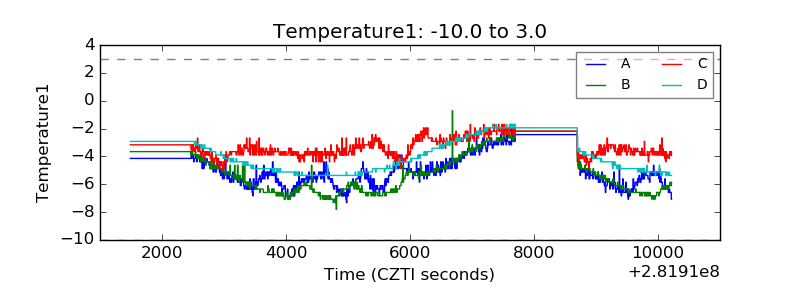 |
| Veto HV Monitor | 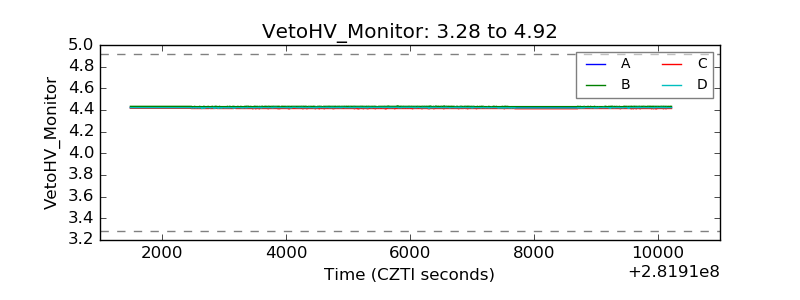 |
| Veto LLD | 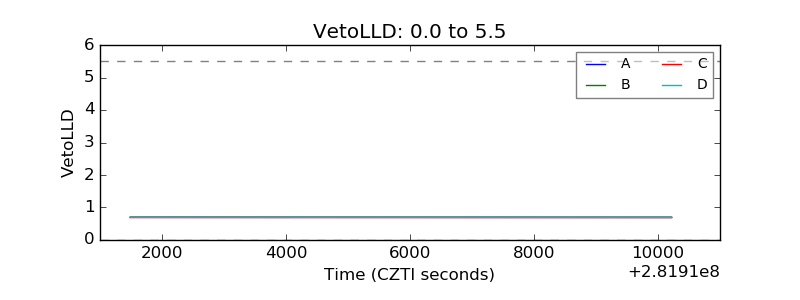 |
| Alpha Counter | 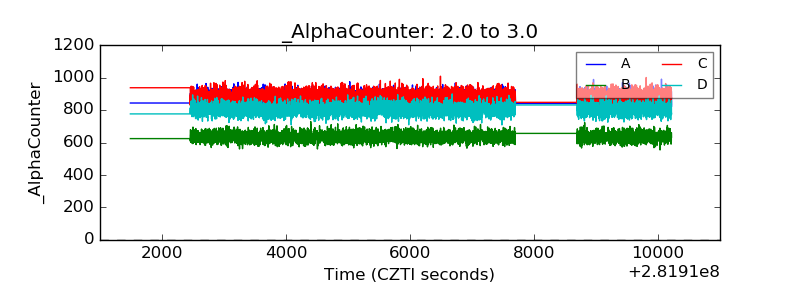 |
| _CPM_Rate | 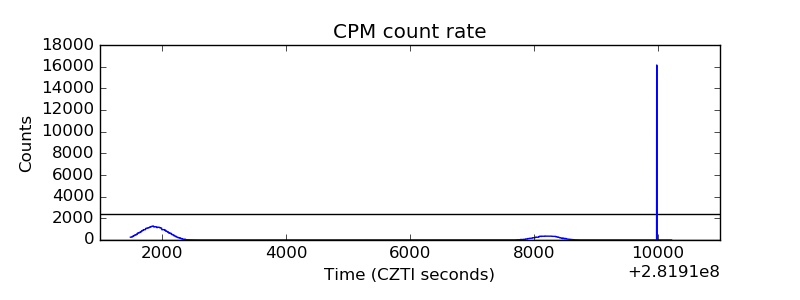 |
| CZT Counter | 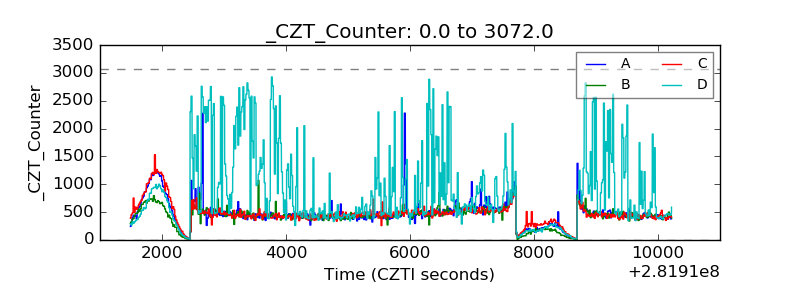 |
| +2.5 Volts monitor |  |
| +5 Volts monitor |  |
| _ROLL_ROT | 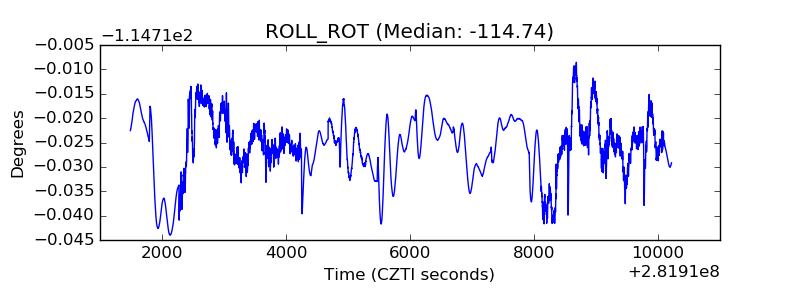 |
| _Roll_DEC | 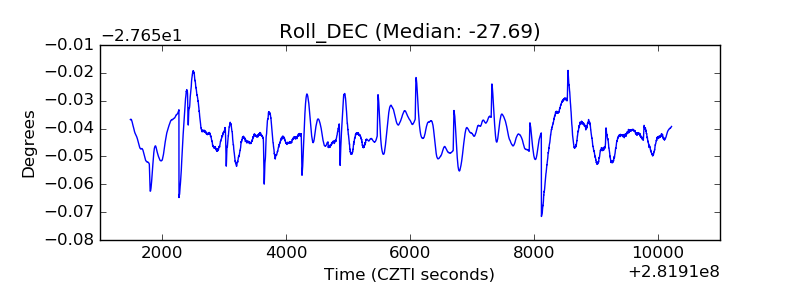 |
| _Roll_RA | 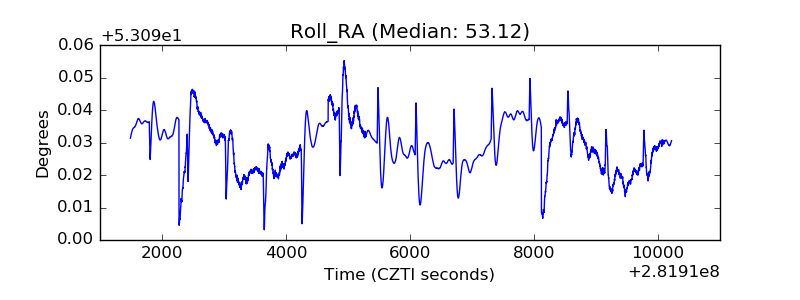 |
| Veto Counter | 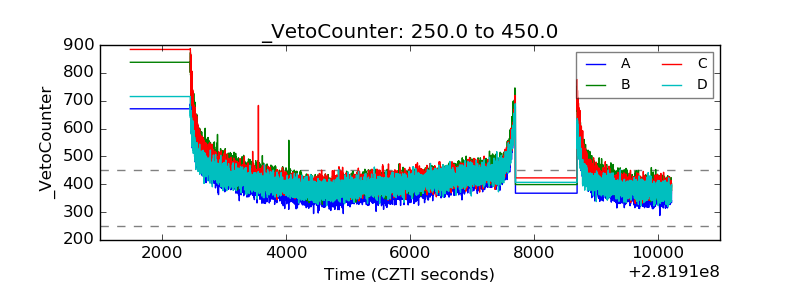 |