| Param | Original file | Final file |
|---|---|---|
| Filename | modeM0/AS1T03_059T01_9000002554_17272cztM0_level2.evt | modeM0/AS1T03_059T01_9000002554_17272cztM0_level2_quad_clean.evt |
| Size (bytes) | 559,647,360 | 108,734,400 |
| Size | 533.7 MB | 103.7 MB |
| Events in quadrant A | 3,690,697 | 708,509 |
| Events in quadrant B | 3,744,100 | 709,758 |
| Events in quadrant C | 3,661,484 | 670,496 |
| Events in quadrant D | 5,310,953 | 649,335 |
| Mode M9 | |||
|---|---|---|---|
| Quadrant | BADHDUFLAG | Total packets | Discarded packets |
| A | 0 | 11 | 0 |
| B | 0 | 11 | 0 |
| C | 0 | 11 | 0 |
| D | 0 | 11 | 0 |
| Mode SS | |||
|---|---|---|---|
| Quadrant | BADHDUFLAG | Total packets | Discarded packets |
| A | 0 | 164 | 0 |
| B | 0 | 164 | 0 |
| C | 0 | 164 | 0 |
| D | 0 | 164 | 0 |
| Mode M0 | |||
|---|---|---|---|
| Quadrant | BADHDUFLAG | Total packets | Discarded packets |
| A | 0 | 16361 | 2 |
| B | 0 | 16430 | 2 |
| C | 0 | 16261 | 2 |
| D | 0 | 21369 | 2 |
| Quadrant | Total seconds | Saturated seconds | Saturation percentage |
|---|---|---|---|
| A | 7981 | 31 | 0.388423% |
| B | 7982 | 48 | 0.601353% |
| C | 7982 | 62 | 0.776748% |
| D | 7981 | 330 | 4.134820% |
Noise dominated data is calculated using 1-second bins in cleaned event files. If a bin has >2000 counts, and if more than 50% of those come from <1% of pixels, then it is considered to be noise-dominated and hence unusable.
| Quadrant | # 1 sec bins | Bins with >0 counts | Bins with >2000 counts | High rate bins dominated by noise | Noise dominated (total time) | Noise dominated (detector-on time) | Marked lightcurve |
|---|---|---|---|---|---|---|---|
| A | 9031 | 7983 | 1 | 1 | 0.01% | 0.01% | 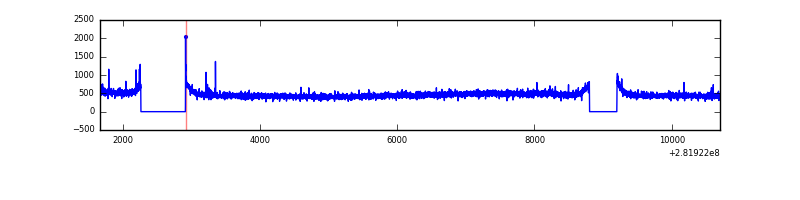 |
| B | 9032 | 7984 | 1 | 1 | 0.01% | 0.01% | 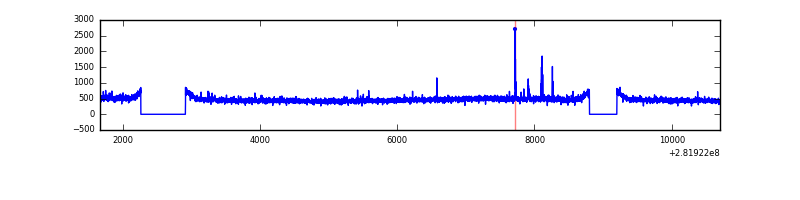 |
| C | 9032 | 7984 | 0 | 0 | 0.00% | 0.00% | 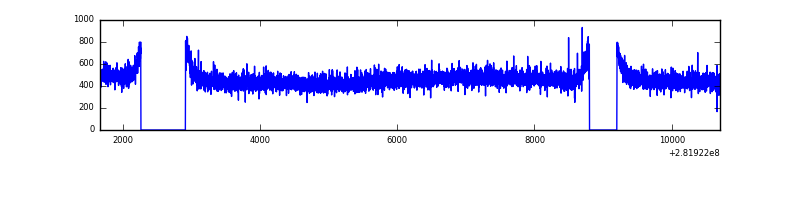 |
| D | 9031 | 7983 | 255 | 255 | 2.82% | 3.19% | 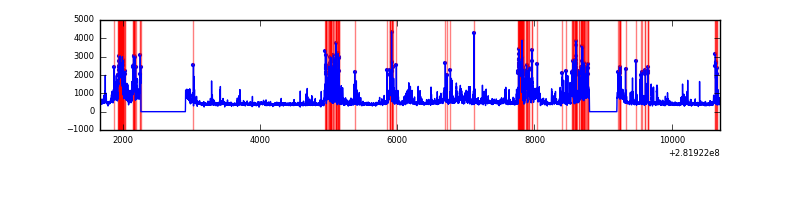 |
Top three noisy pixels from each quadrant. If the there are fewer than three noisy pixels in the level2.evt file, extra rows are filled as -1
| Pixel properties | Quadrant properties | ||||||
|---|---|---|---|---|---|---|---|
| Quadrant | DetID | PixID | Counts | Sigma | Mean | Median | Sigma |
| A | 0 | 8 | 29170 | 148.29 | 943 | 922 | 190.5 |
| A | 14 | 235 | 28687 | 145.75 | 943 | 922 | 190.5 |
| A | 0 | 226 | 8328 | 38.88 | 943 | 922 | 190.5 |
| B | 15 | 19 | 49013 | 262.53 | 944 | 917 | 183.2 |
| B | 12 | 111 | 22222 | 116.29 | 944 | 917 | 183.2 |
| B | 11 | 111 | 19307 | 100.38 | 944 | 917 | 183.2 |
| C | 14 | 238 | 139445 | 653.83 | 901 | 905 | 211.9 |
| C | 3 | 233 | 7259 | 29.99 | 901 | 905 | 211.9 |
| C | 13 | 61 | 6325 | 25.58 | 901 | 905 | 211.9 |
| D | 11 | 176 | 1231134 | 5670.76 | 894 | 868 | 216.9 |
| D | 10 | 70 | 340643 | 1566.15 | 894 | 868 | 216.9 |
| D | 13 | 189 | 248451 | 1141.2 | 894 | 868 | 216.9 |
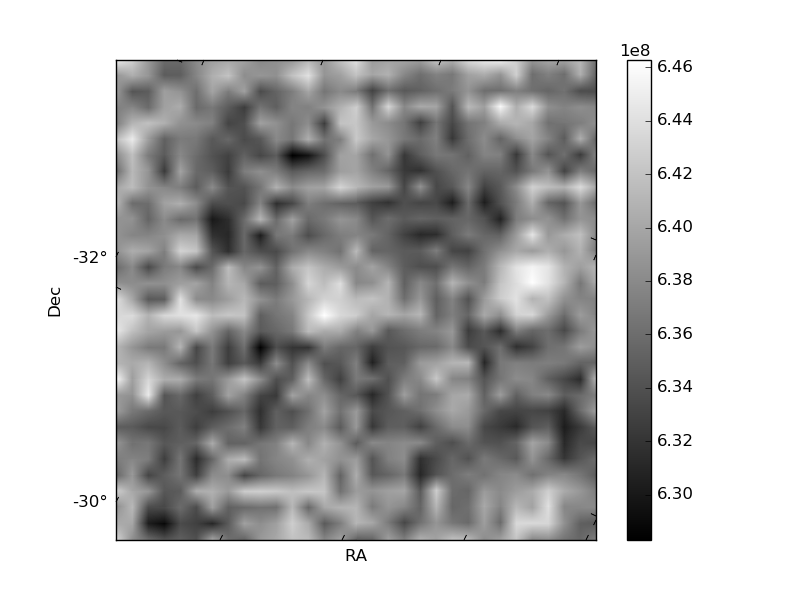
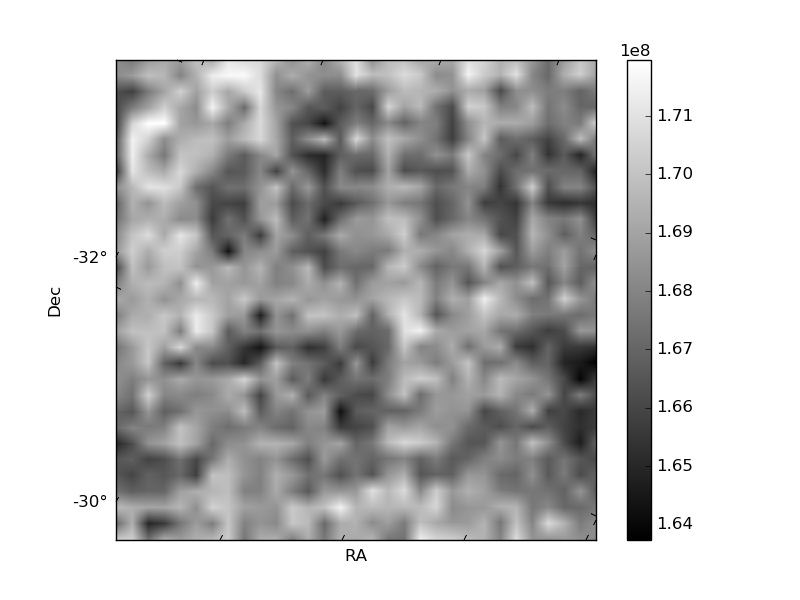
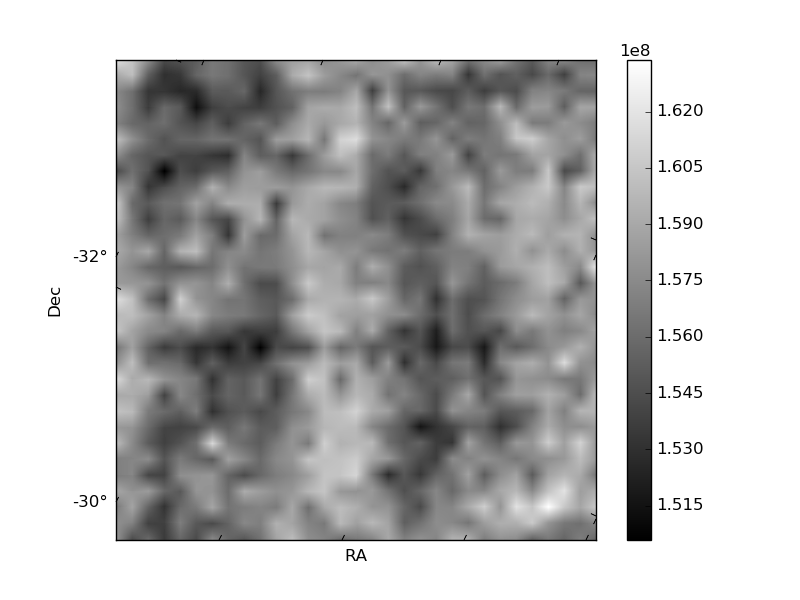
Histogram calculated using DETX and DETY for each event in the final _common_clean file
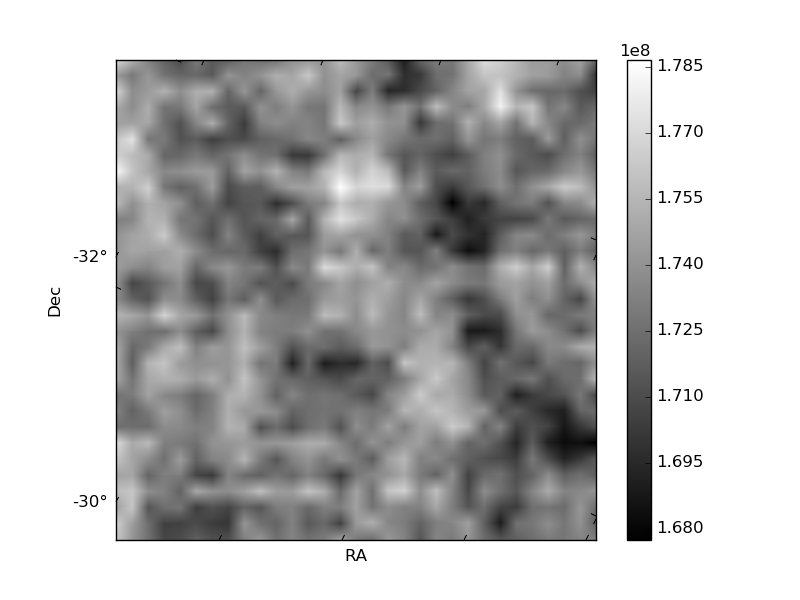
| Quadrant A | 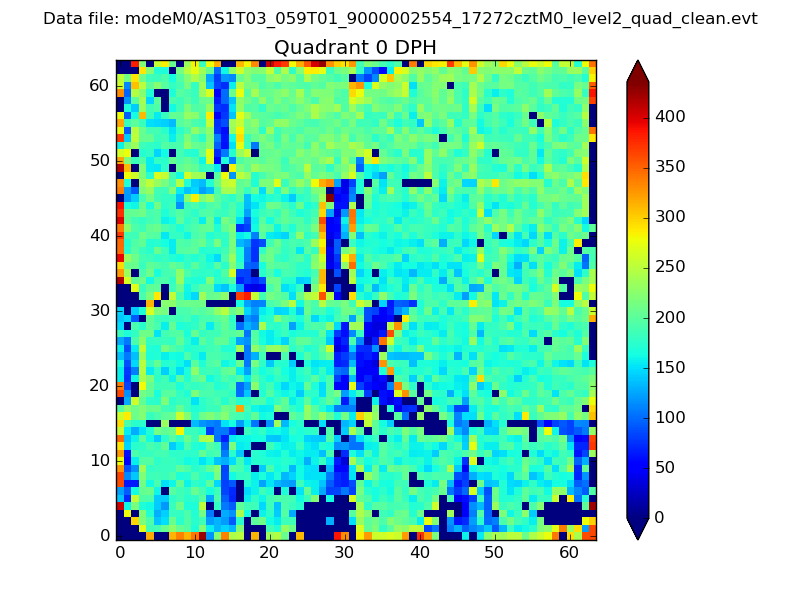 |
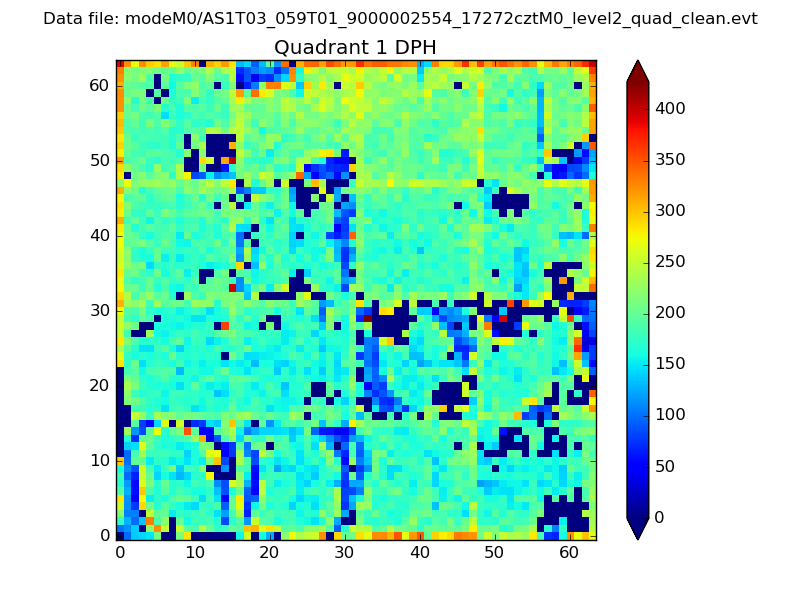 |
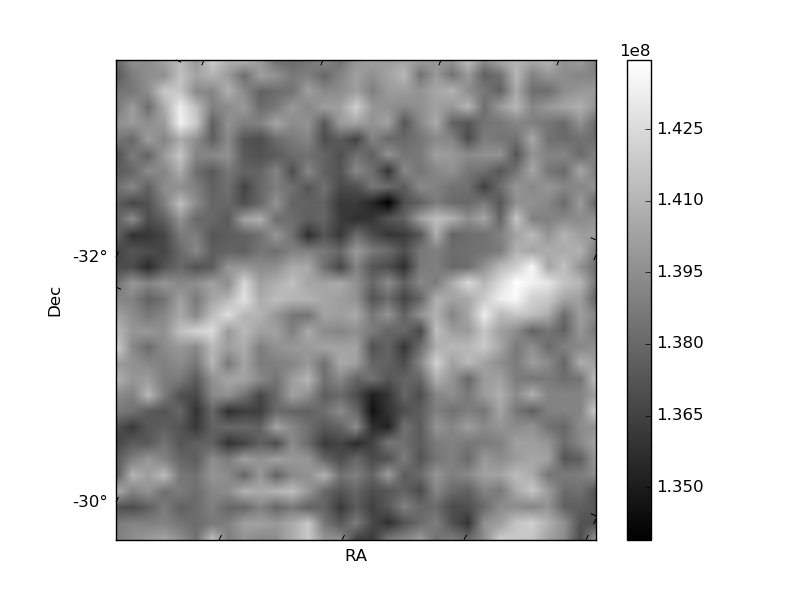
Quadrant B |
|---|---|---|---|
| Quadrant D |  |
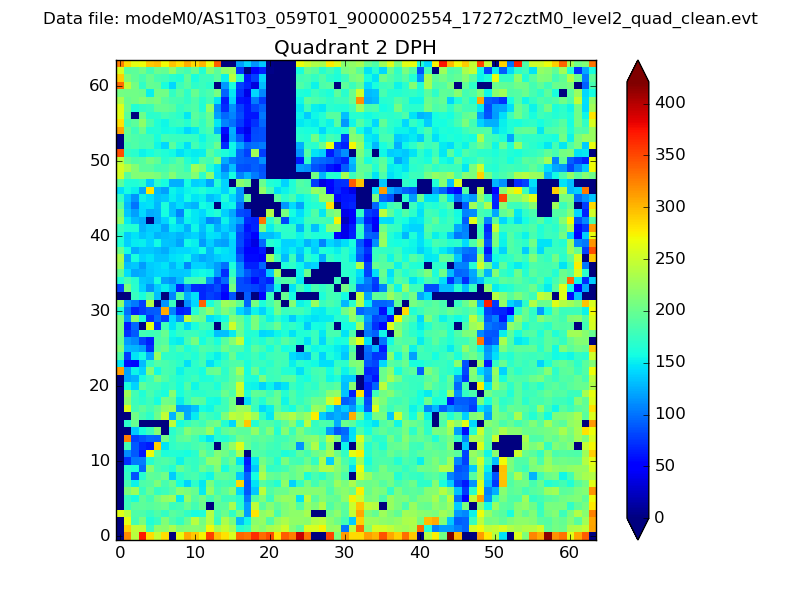 |
Quadrant C |
| Plot type | Count rate plots | Images |
|---|---|---|
| Comparison with Poisson distribution Blue bars denote a histogram of data divided into 1 sec bins. Red curve is a Poisson curve with rate = median count rate of data. |
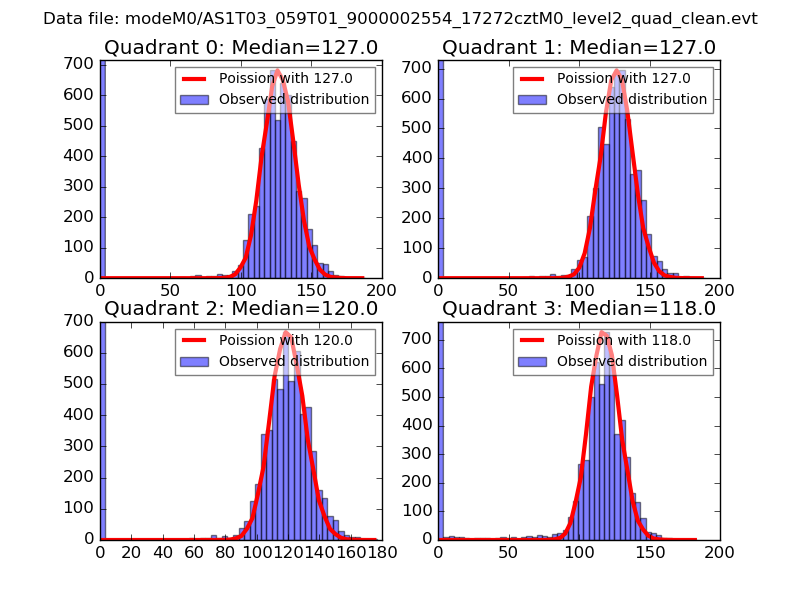 |
 |
| Quadrant-wise count rates Data is divided into 100 sec bins |
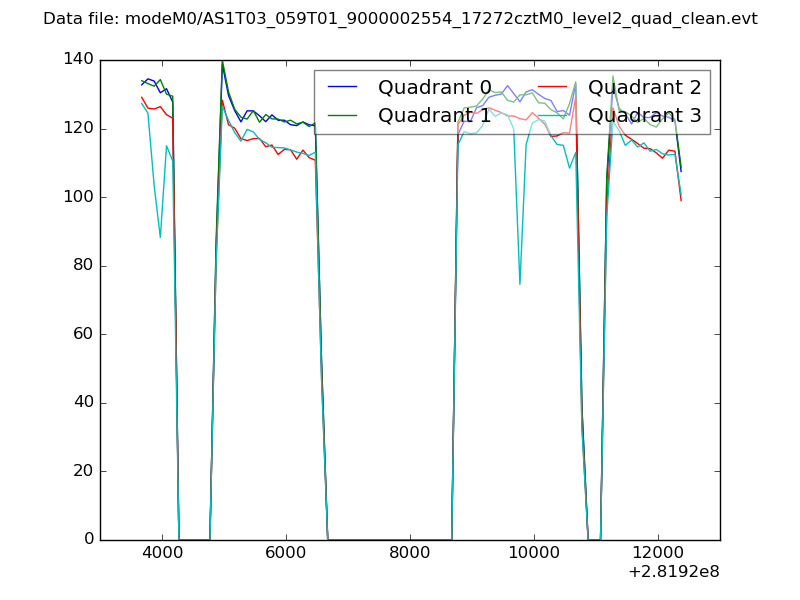 |
|
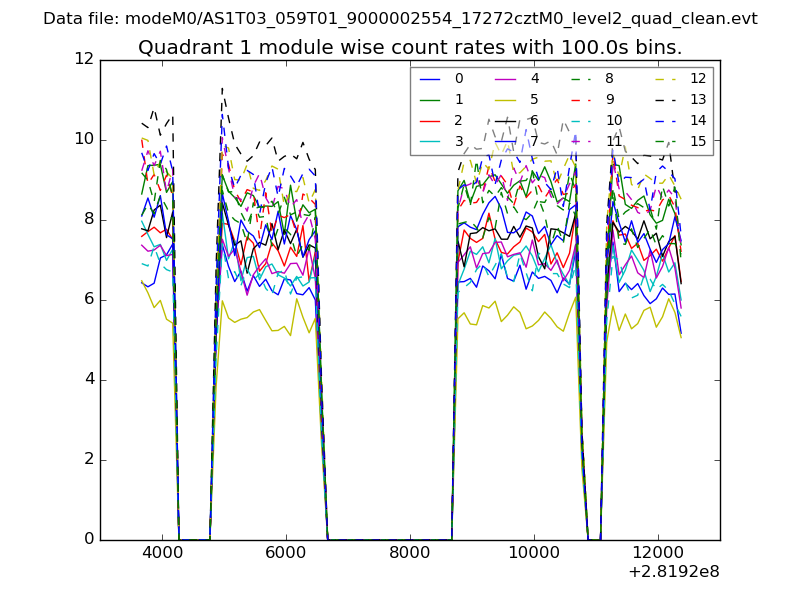
| Module-wise count rates for Quadrant A Data is divided into 100 sec bins |
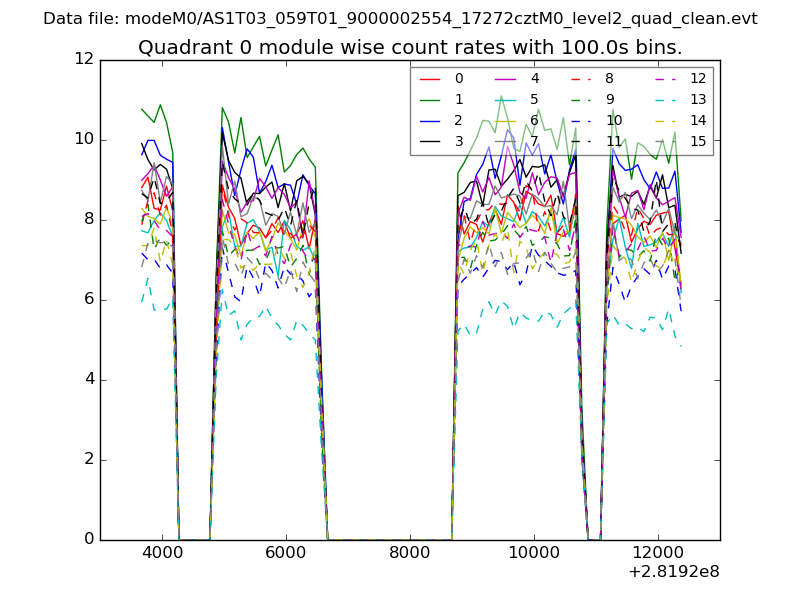 |
 |
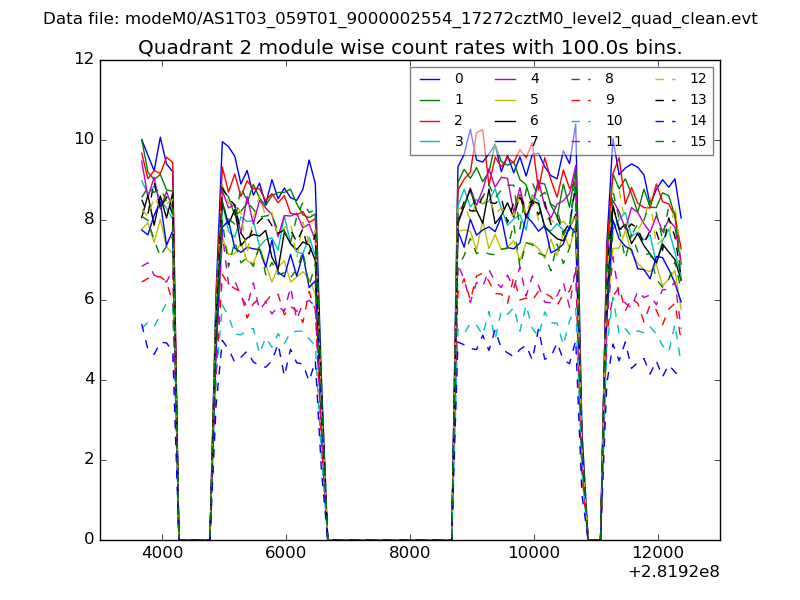
| Module-wise count rates for Quadrant B Data is divided into 100 sec bins |
 |
 |
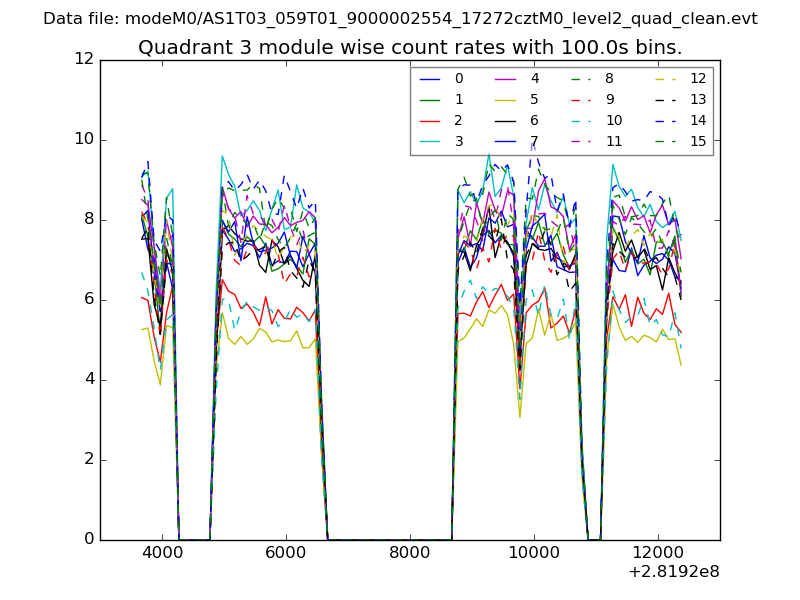
| Module-wise count rates for Quadrant C Data is divided into 100 sec bins |
 |
 |
| Module-wise count rates for Quadrant D Data is divided into 100 sec bins |
 |
 |
| Parameter | Plot |
|---|---|
| CZT HV Monitor | 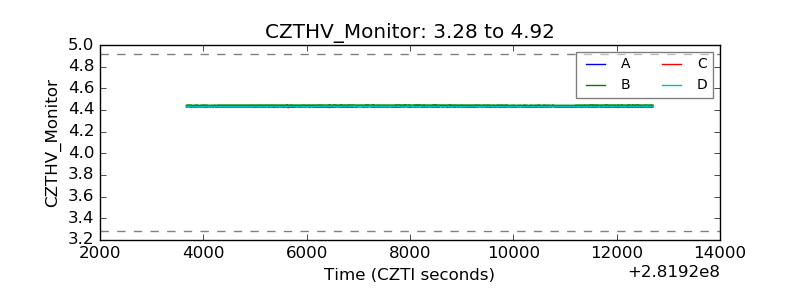 |
| D_VDD | 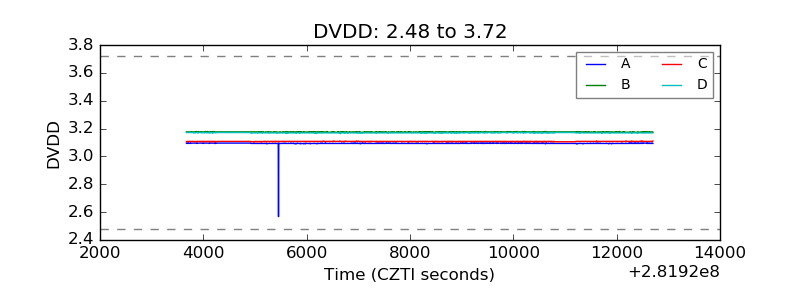 |
| Temperature 1 | 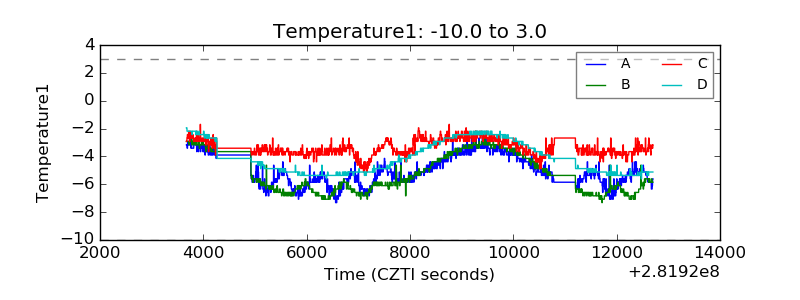 |
| Veto HV Monitor | 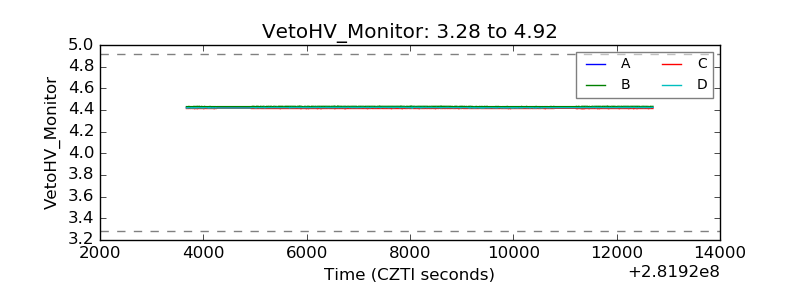 |
| Veto LLD | 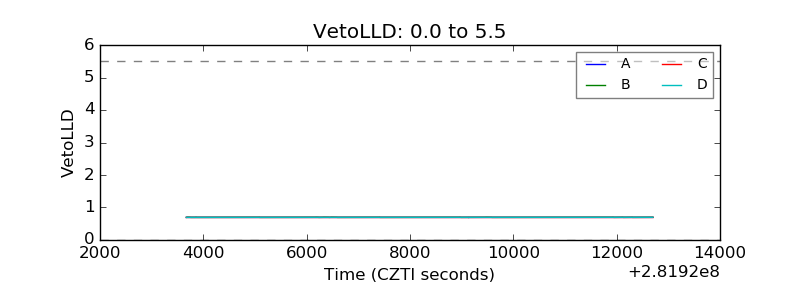 |
| Alpha Counter | 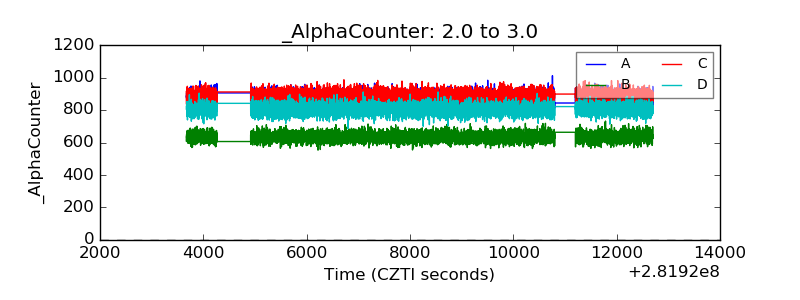 |
| _CPM_Rate | 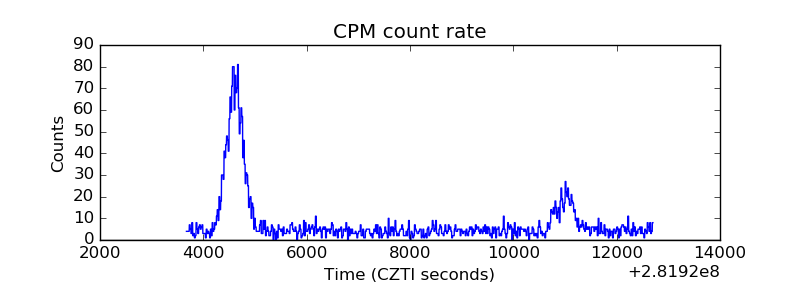 |
| CZT Counter | 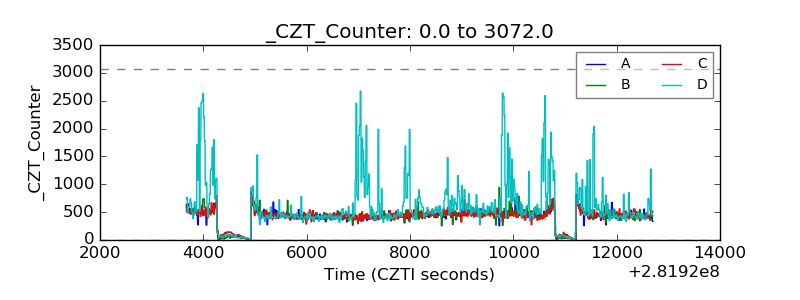 |
| +2.5 Volts monitor | 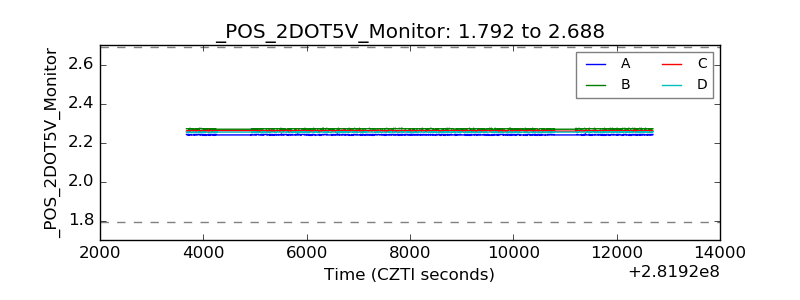 |
| +5 Volts monitor |  |
| _ROLL_ROT | 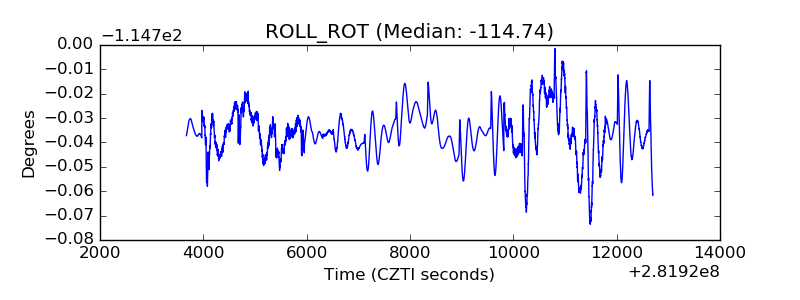 |
| _Roll_DEC | 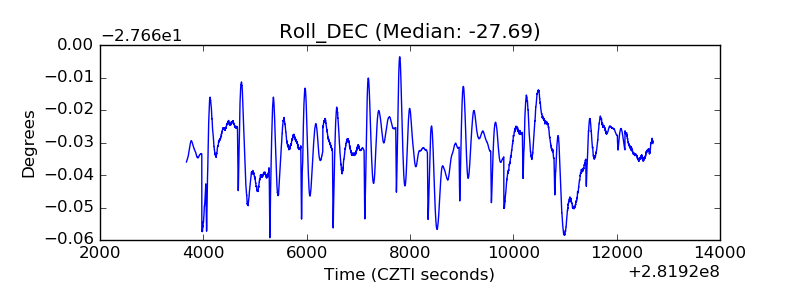 |
| _Roll_RA | 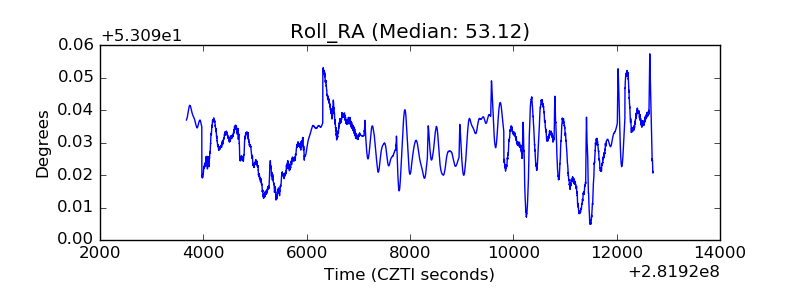 |
| Veto Counter | 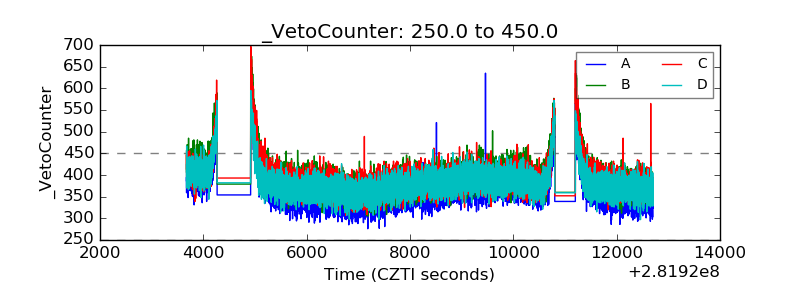 |