| Param | Original file | Final file |
|---|---|---|
| Filename | modeM0/AS1T03_059T01_9000002554_17273cztM0_level2.evt | modeM0/AS1T03_059T01_9000002554_17273cztM0_level2_quad_clean.evt |
| Size (bytes) | 506,808,000 | 92,401,920 |
| Size | 483.3 MB | 88.1 MB |
| Events in quadrant A | 3,853,381 | 580,465 |
| Events in quadrant B | 3,450,628 | 591,784 |
| Events in quadrant C | 3,421,252 | 557,328 |
| Events in quadrant D | 4,120,186 | 552,894 |
| Mode M9 | |||
|---|---|---|---|
| Quadrant | BADHDUFLAG | Total packets | Discarded packets |
| A | 0 | 4 | 0 |
| B | 0 | 5 | 0 |
| C | 0 | 5 | 0 |
| D | 0 | 5 | 0 |
| Mode SS | |||
|---|---|---|---|
| Quadrant | BADHDUFLAG | Total packets | Discarded packets |
| A | 0 | 148 | 0 |
| B | 0 | 148 | 0 |
| C | 0 | 148 | 0 |
| D | 0 | 148 | 0 |
| Mode M0 | |||
|---|---|---|---|
| Quadrant | BADHDUFLAG | Total packets | Discarded packets |
| A | 0 | 16530 | 2 |
| B | 0 | 15250 | 2 |
| C | 0 | 15240 | 2 |
| D | 0 | 17416 | 2 |
| Quadrant | Total seconds | Saturated seconds | Saturation percentage |
|---|---|---|---|
| A | 7414 | 225 | 3.034799% |
| B | 7414 | 132 | 1.780415% |
| C | 7413 | 167 | 2.252799% |
| D | 7413 | 168 | 2.266289% |
Noise dominated data is calculated using 1-second bins in cleaned event files. If a bin has >2000 counts, and if more than 50% of those come from <1% of pixels, then it is considered to be noise-dominated and hence unusable.
| Quadrant | # 1 sec bins | Bins with >0 counts | Bins with >2000 counts | High rate bins dominated by noise | Noise dominated (total time) | Noise dominated (detector-on time) | Marked lightcurve |
|---|---|---|---|---|---|---|---|
| A | 7684 | 7415 | 88 | 88 | 1.15% | 1.19% | 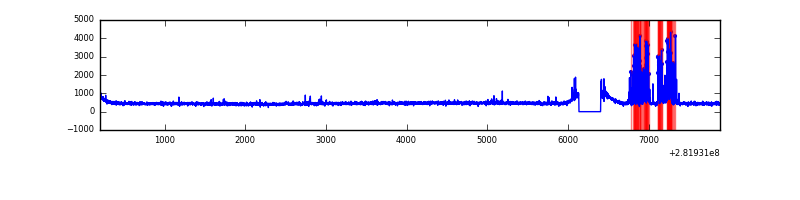 |
| B | 7684 | 7415 | 0 | 0 | 0.00% | 0.00% | 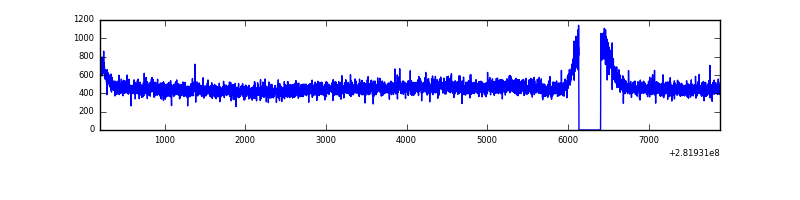 |
| C | 7683 | 7414 | 0 | 0 | 0.00% | 0.00% | 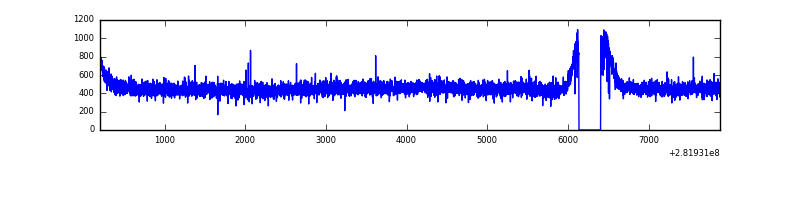 |
| D | 7683 | 7414 | 71 | 71 | 0.92% | 0.96% | 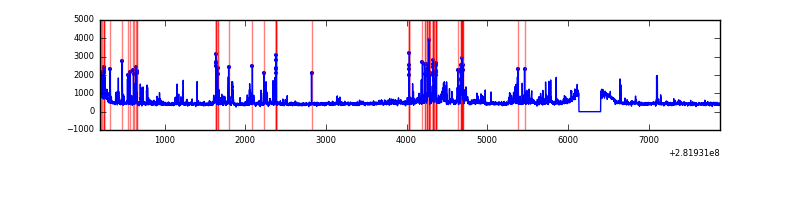 |
Top three noisy pixels from each quadrant. If the there are fewer than three noisy pixels in the level2.evt file, extra rows are filled as -1
| Pixel properties | Quadrant properties | ||||||
|---|---|---|---|---|---|---|---|
| Quadrant | DetID | PixID | Counts | Sigma | Mean | Median | Sigma |
| A | 14 | 235 | 466517 | 2625.17 | 875 | 854 | 177.4 |
| A | 0 | 8 | 13503 | 71.31 | 875 | 854 | 177.4 |
| A | 0 | 23 | 8317 | 42.07 | 875 | 854 | 177.4 |
| B | 12 | 111 | 21245 | 119.05 | 881 | 856 | 171.3 |
| B | 11 | 111 | 18351 | 102.15 | 881 | 856 | 171.3 |
| B | 14 | 111 | 16085 | 88.92 | 881 | 856 | 171.3 |
| C | 14 | 238 | 128526 | 638.77 | 843 | 846 | 199.9 |
| C | 3 | 233 | 6444 | 28.01 | 843 | 846 | 199.9 |
| C | 13 | 61 | 5879 | 25.18 | 843 | 846 | 199.9 |
| D | 11 | 176 | 529447 | 2533.63 | 854 | 828 | 208.6 |
| D | 10 | 70 | 136008 | 647.91 | 854 | 828 | 208.6 |
| D | 13 | 189 | 101130 | 480.74 | 854 | 828 | 208.6 |
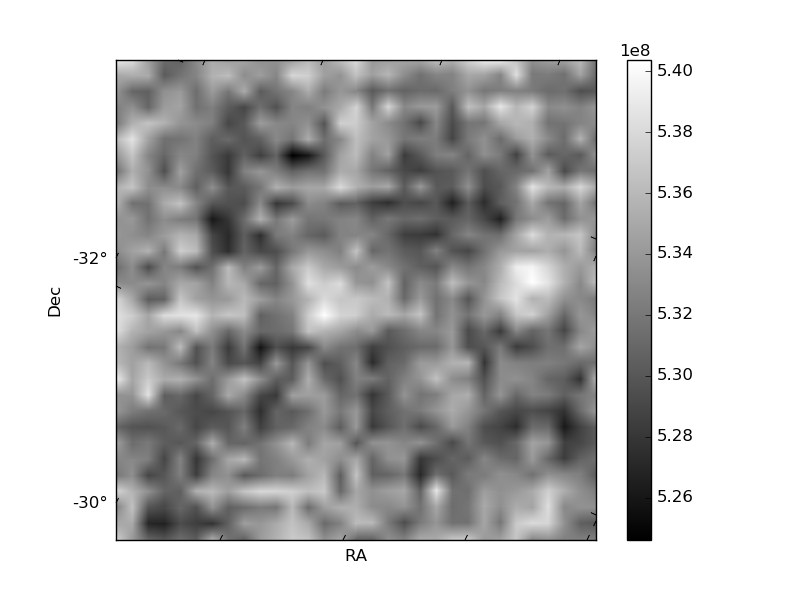
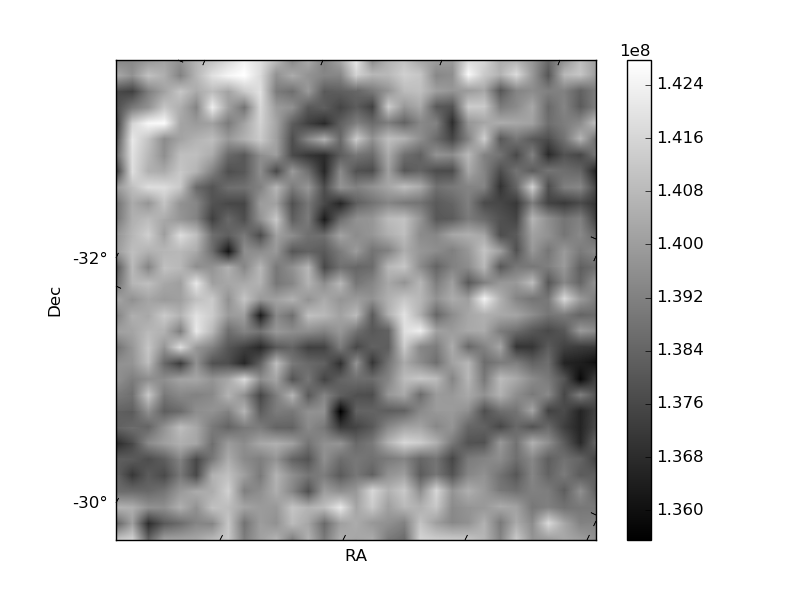
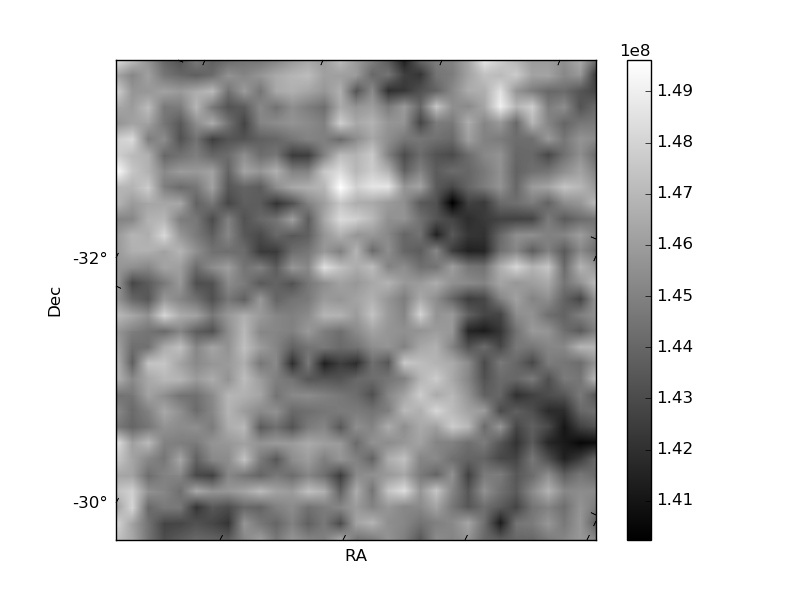
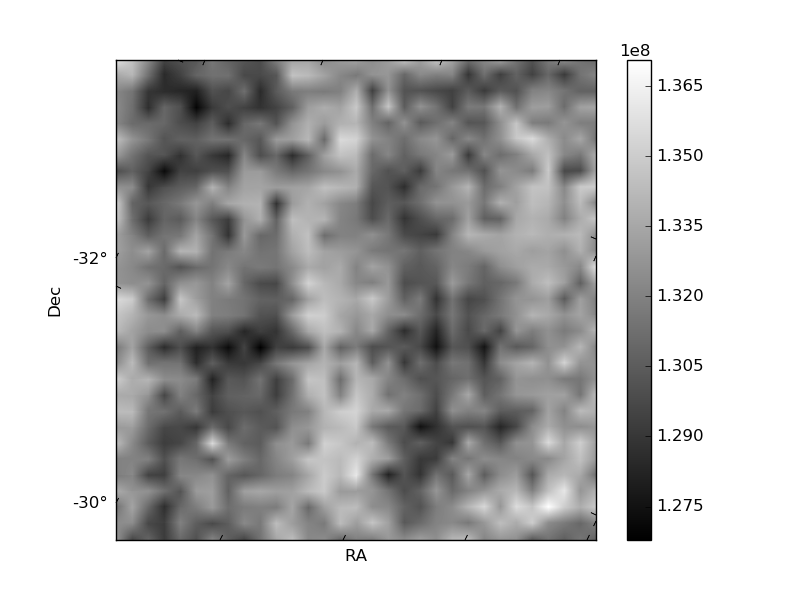
Histogram calculated using DETX and DETY for each event in the final _common_clean file
| Quadrant A | 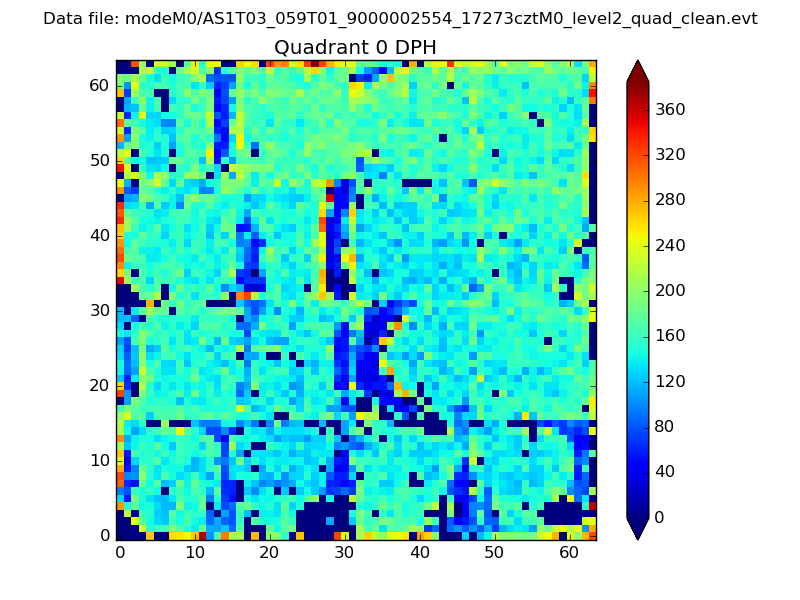 |
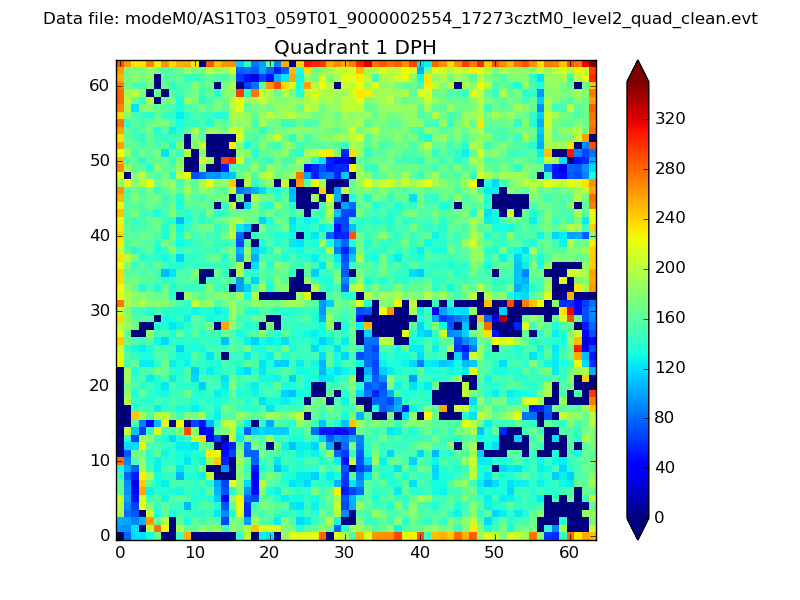 |
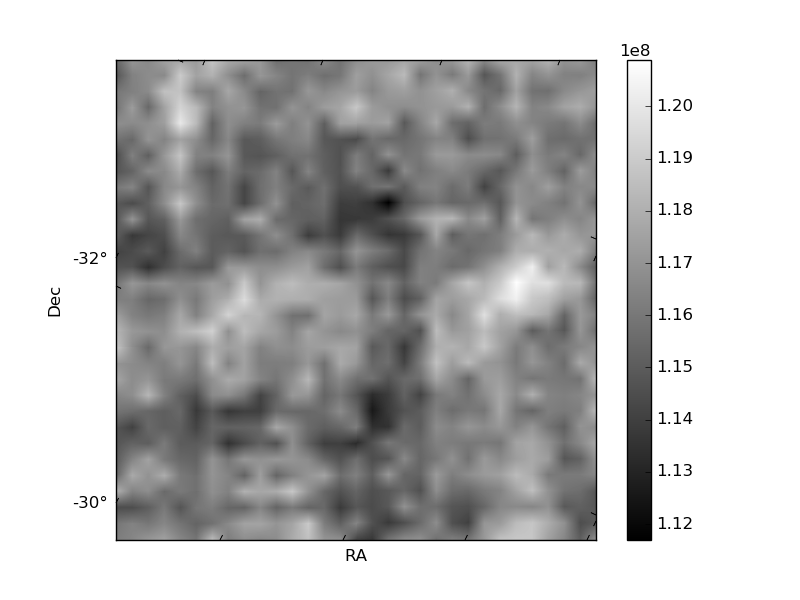
Quadrant B |
|---|---|---|---|
| Quadrant D | 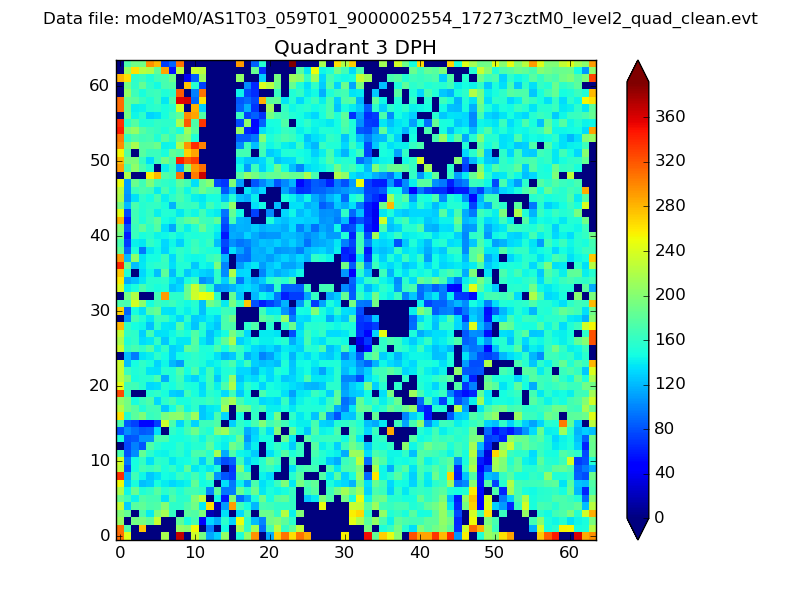 |
 |
Quadrant C |
| Plot type | Count rate plots | Images |
|---|---|---|
| Comparison with Poisson distribution Blue bars denote a histogram of data divided into 1 sec bins. Red curve is a Poisson curve with rate = median count rate of data. |
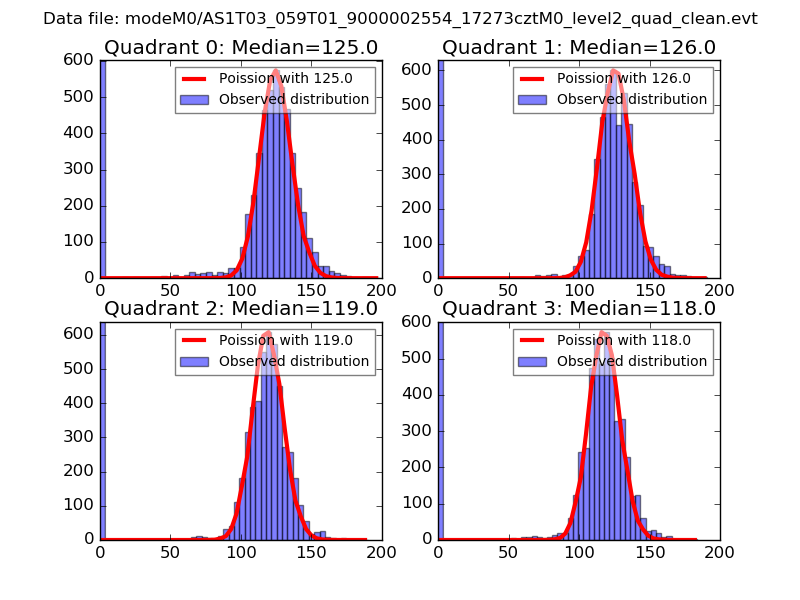 |
 |
| Quadrant-wise count rates Data is divided into 100 sec bins |
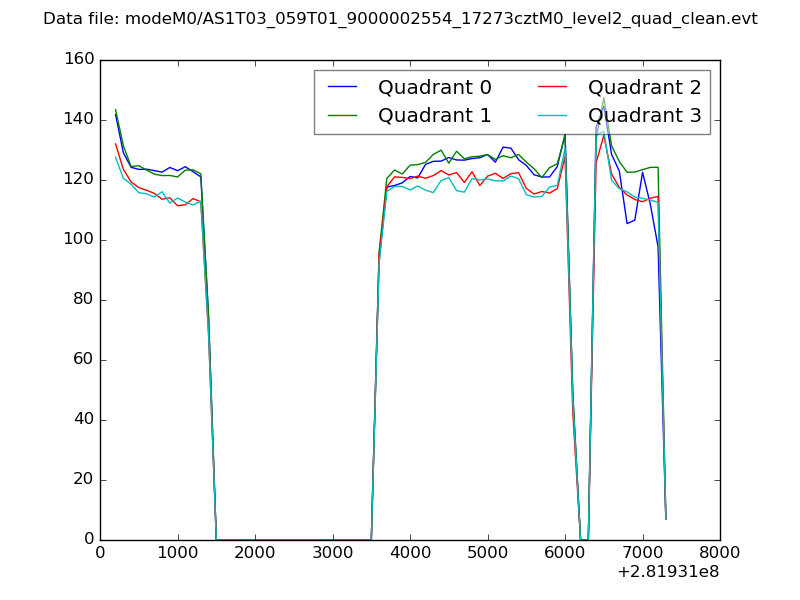 |
|
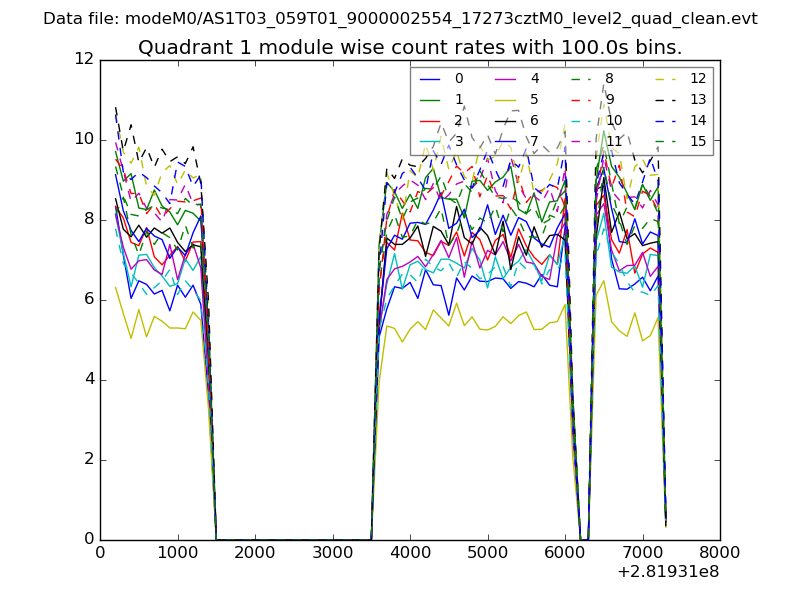
| Module-wise count rates for Quadrant A Data is divided into 100 sec bins |
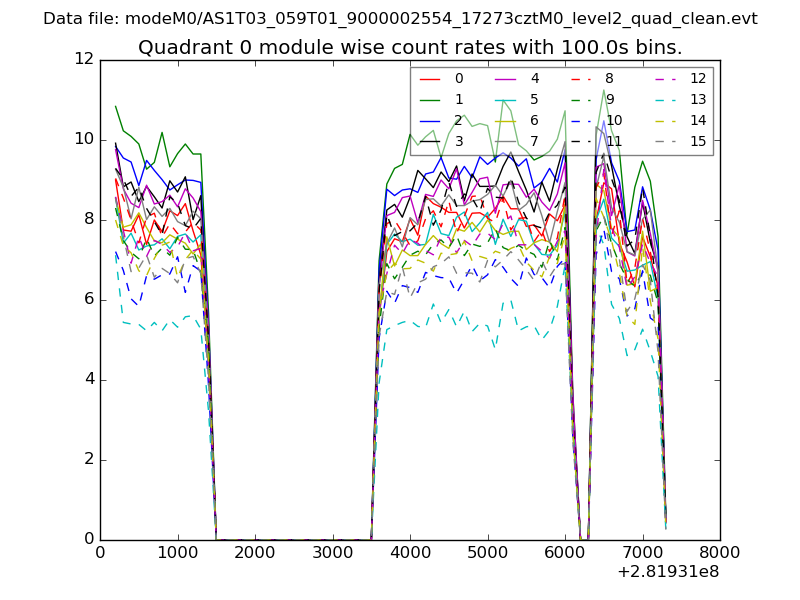 |
 |
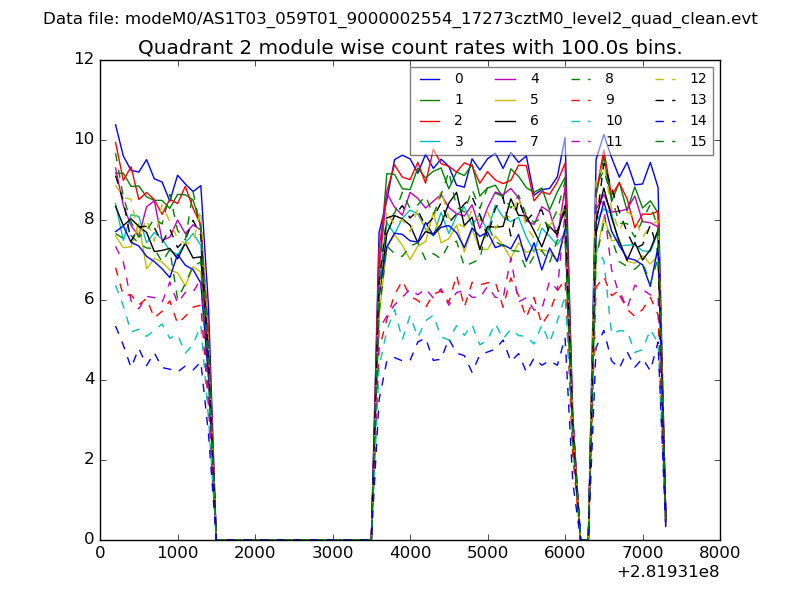
| Module-wise count rates for Quadrant B Data is divided into 100 sec bins |
 |
 |
| Module-wise count rates for Quadrant C Data is divided into 100 sec bins |
 |
 |
| Module-wise count rates for Quadrant D Data is divided into 100 sec bins |
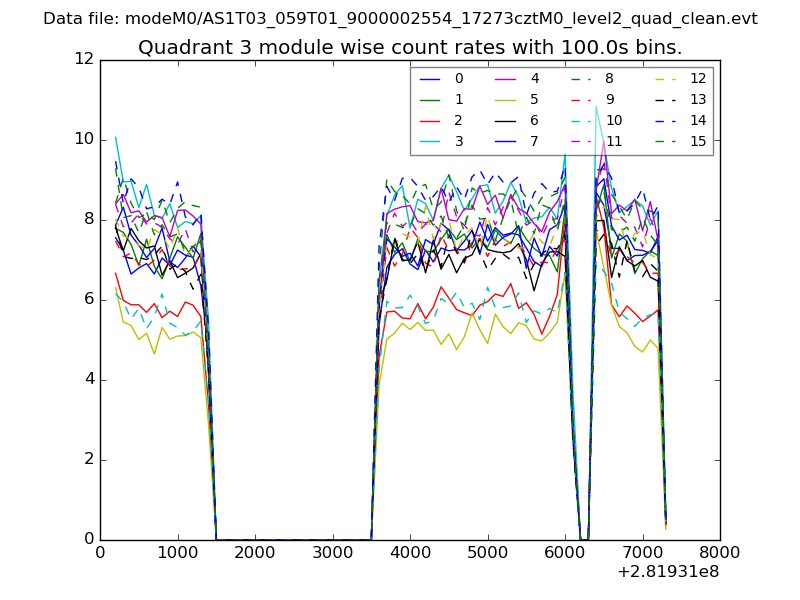 |
 |
| Parameter | Plot |
|---|---|
| CZT HV Monitor | 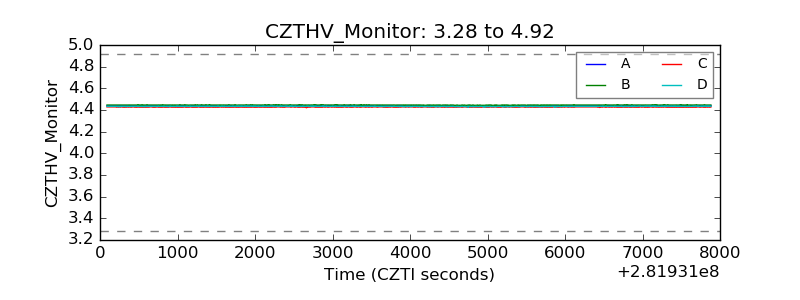 |
| D_VDD | 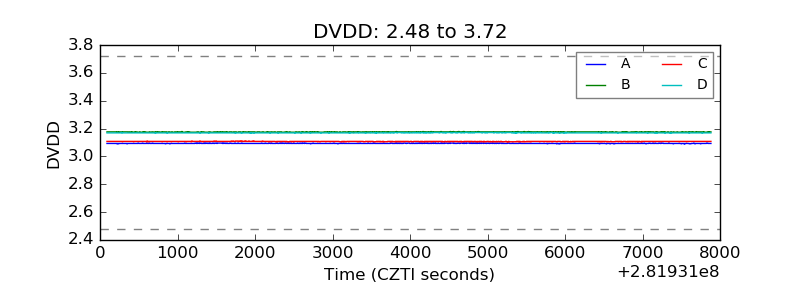 |
| Temperature 1 | 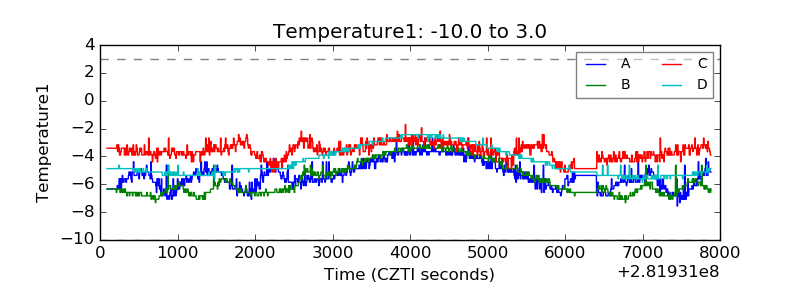 |
| Veto HV Monitor | 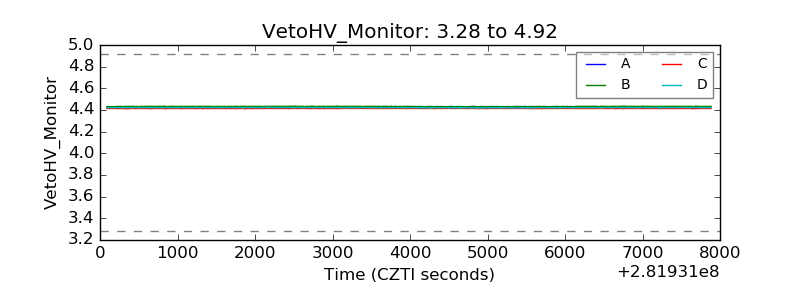 |
| Veto LLD | 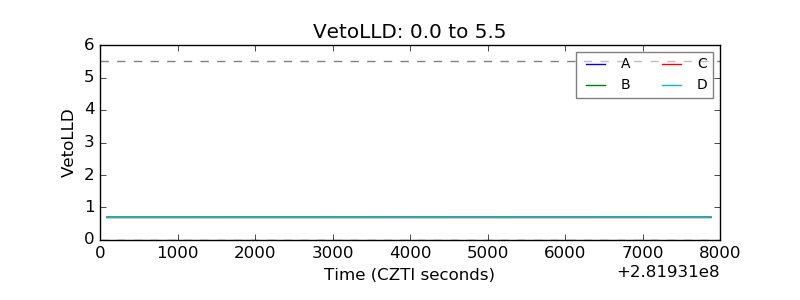 |
| Alpha Counter | 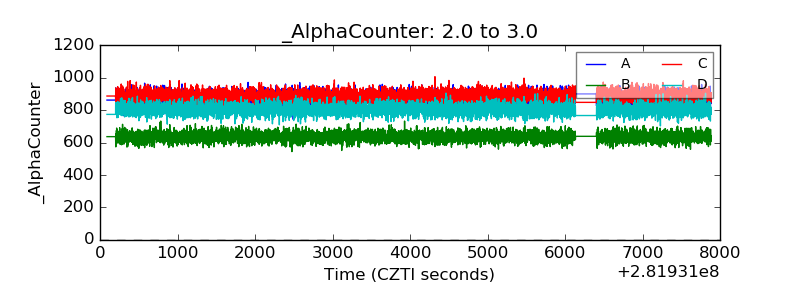 |
| _CPM_Rate | 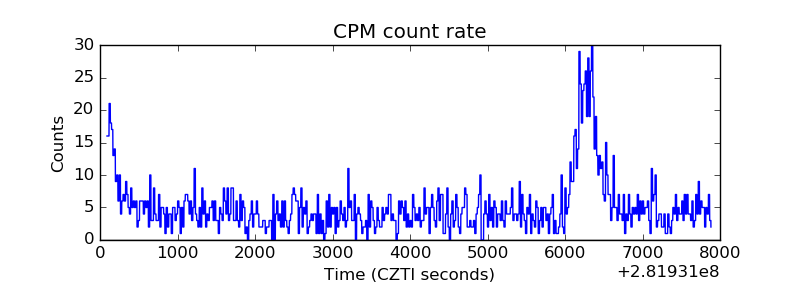 |
| CZT Counter | 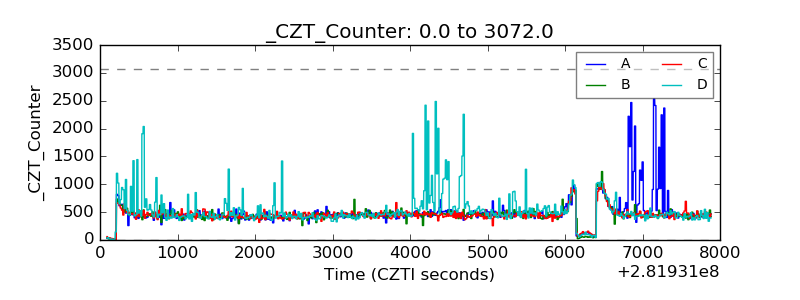 |
| +2.5 Volts monitor | 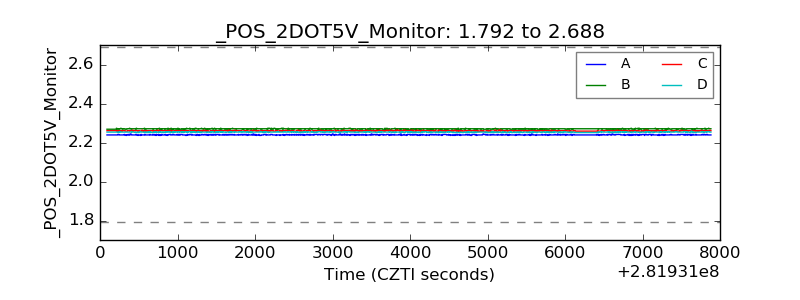 |
| +5 Volts monitor | 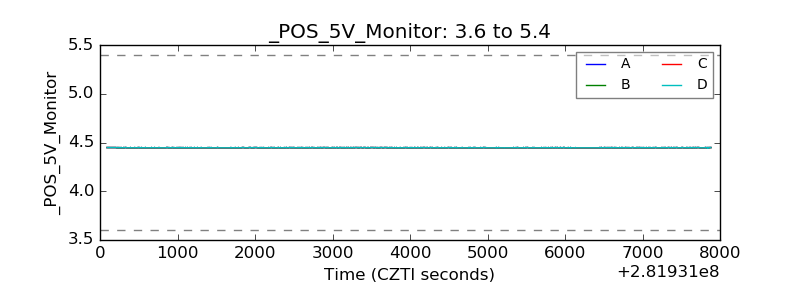 |
| _ROLL_ROT | 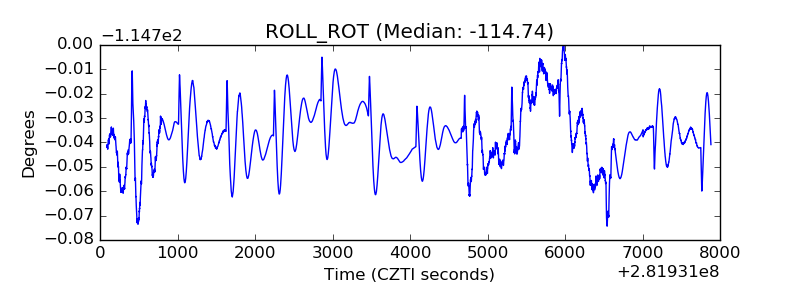 |
| _Roll_DEC | 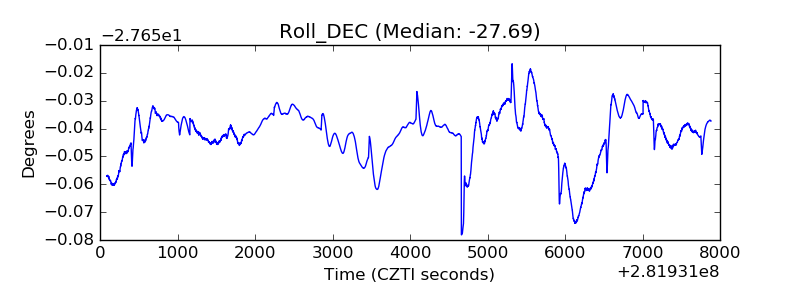 |
| _Roll_RA | 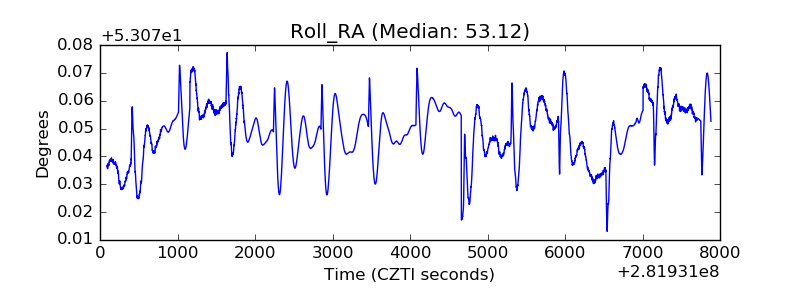 |
| Veto Counter | 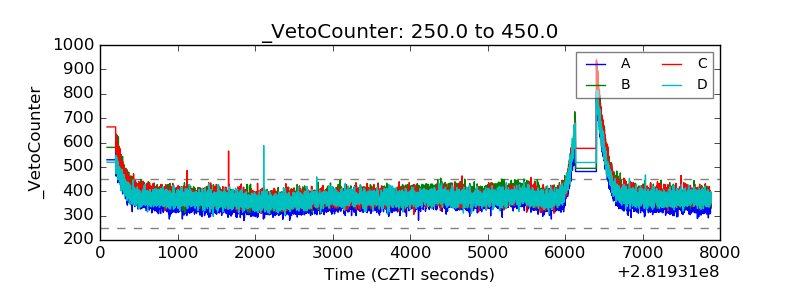 |