| Param | Original file | Final file |
|---|---|---|
| Filename | modeM0/AS1T03_059T01_9000002554_17276cztM0_level2.evt | modeM0/AS1T03_059T01_9000002554_17276cztM0_level2_quad_clean.evt |
| Size (bytes) | 1,358,297,280 | 223,295,040 |
| Size | 1.3 GB | 213.0 MB |
| Events in quadrant A | 10,354,895 | 1,379,462 |
| Events in quadrant B | 9,027,509 | 1,400,252 |
| Events in quadrant C | 8,927,703 | 1,337,563 |
| Events in quadrant D | 11,523,505 | 1,317,843 |
| Mode M9 | |||
|---|---|---|---|
| Quadrant | BADHDUFLAG | Total packets | Discarded packets |
| A | 0 | 21 | 0 |
| B | 0 | 21 | 0 |
| C | 0 | 21 | 0 |
| D | 0 | 21 | 0 |
| Mode SS | |||
|---|---|---|---|
| Quadrant | BADHDUFLAG | Total packets | Discarded packets |
| A | 0 | 394 | 0 |
| B | 0 | 394 | 0 |
| C | 0 | 394 | 0 |
| D | 0 | 394 | 0 |
| Mode M0 | |||
|---|---|---|---|
| Quadrant | BADHDUFLAG | Total packets | Discarded packets |
| A | 0 | 43803 | 4 |
| B | 0 | 39716 | 4 |
| C | 0 | 39581 | 4 |
| D | 0 | 47699 | 4 |
| Quadrant | Total seconds | Saturated seconds | Saturation percentage |
|---|---|---|---|
| A | 19263 | 635 | 3.296475% |
| B | 19263 | 331 | 1.718320% |
| C | 19263 | 404 | 2.097285% |
| D | 19263 | 569 | 2.953849% |
Noise dominated data is calculated using 1-second bins in cleaned event files. If a bin has >2000 counts, and if more than 50% of those come from <1% of pixels, then it is considered to be noise-dominated and hence unusable.
| Quadrant | # 1 sec bins | Bins with >0 counts | Bins with >2000 counts | High rate bins dominated by noise | Noise dominated (total time) | Noise dominated (detector-on time) | Marked lightcurve |
|---|---|---|---|---|---|---|---|
| A | 21378 | 19267 | 275 | 275 | 1.29% | 1.43% | 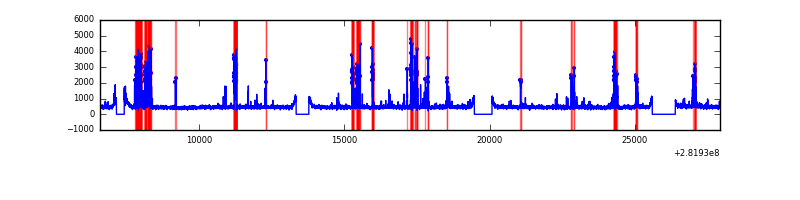 |
| B | 21378 | 19267 | 2 | 2 | 0.01% | 0.01% | 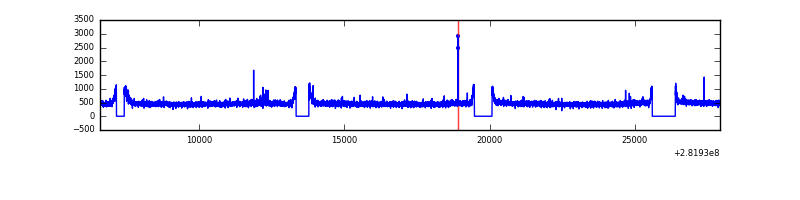 |
| C | 21378 | 19267 | 0 | 0 | 0.00% | 0.00% | 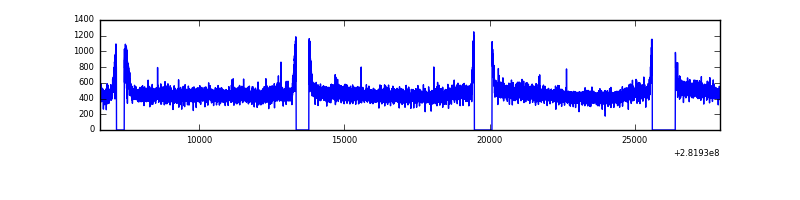 |
| D | 21378 | 19267 | 276 | 276 | 1.29% | 1.43% | 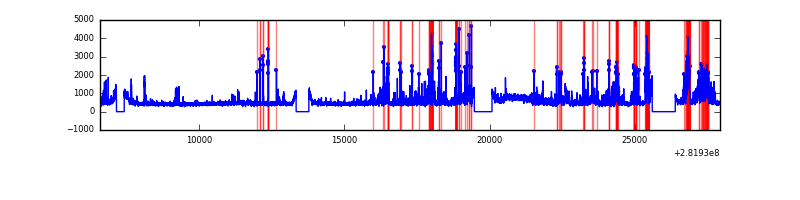 |
Top three noisy pixels from each quadrant. If the there are fewer than three noisy pixels in the level2.evt file, extra rows are filled as -1
| Pixel properties | Quadrant properties | ||||||
|---|---|---|---|---|---|---|---|
| Quadrant | DetID | PixID | Counts | Sigma | Mean | Median | Sigma |
| A | 14 | 235 | 1572245 | 3424.93 | 2281 | 2232 | 458.4 |
| A | 0 | 226 | 20570 | 40.0 | 2281 | 2232 | 458.4 |
| A | 3 | 137 | 17873 | 34.12 | 2281 | 2232 | 458.4 |
| B | 12 | 111 | 55399 | 119.98 | 2292 | 2228 | 443.2 |
| B | 11 | 111 | 48105 | 103.52 | 2292 | 2228 | 443.2 |
| B | 0 | 230 | 45769 | 98.25 | 2292 | 2228 | 443.2 |
| C | 14 | 238 | 335666 | 645.15 | 2200 | 2212 | 516.9 |
| C | 3 | 233 | 17300 | 29.19 | 2200 | 2212 | 516.9 |
| C | 13 | 61 | 15243 | 25.21 | 2200 | 2212 | 516.9 |
| D | 11 | 176 | 1396896 | 2603.21 | 2218 | 2152 | 535.8 |
| D | 11 | 66 | 505722 | 939.89 | 2218 | 2152 | 535.8 |
| D | 13 | 168 | 305299 | 565.81 | 2218 | 2152 | 535.8 |
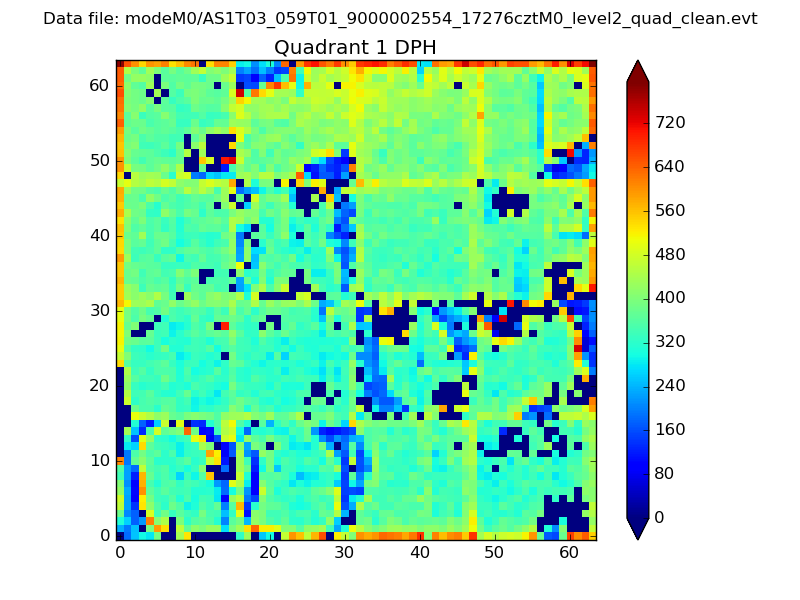
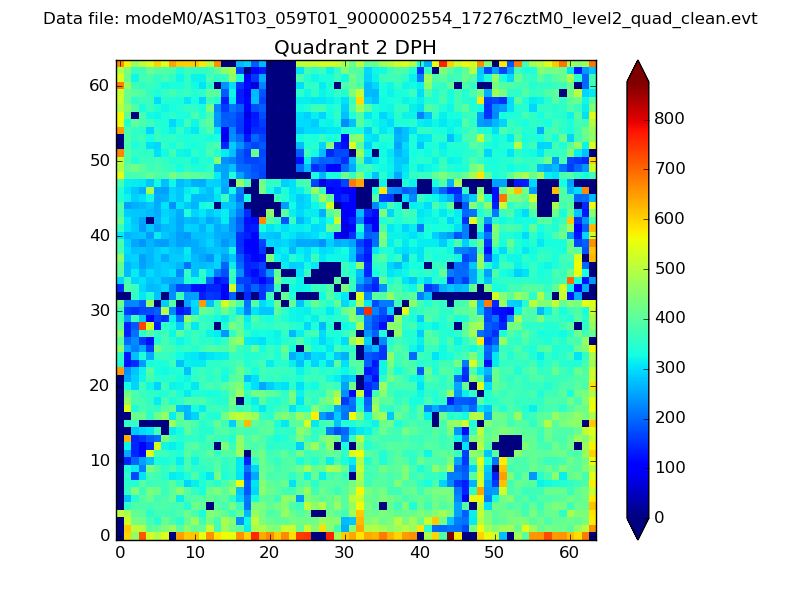
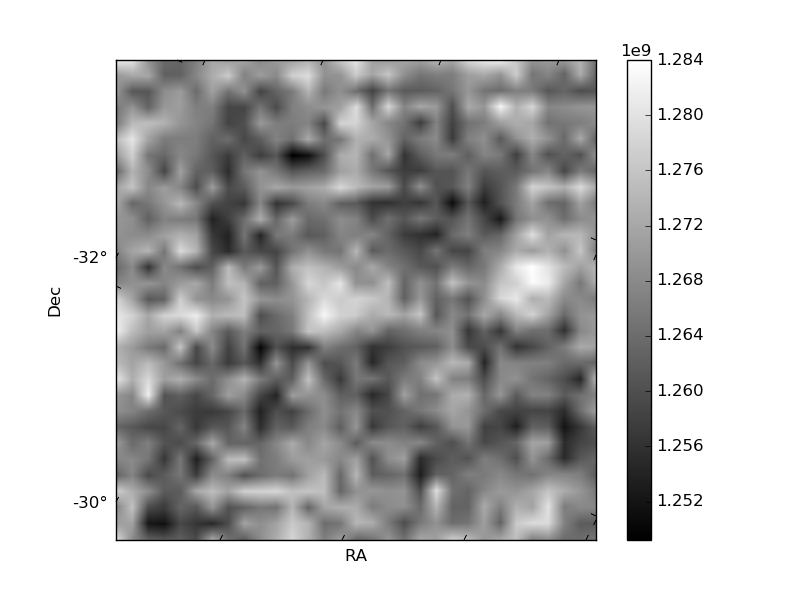
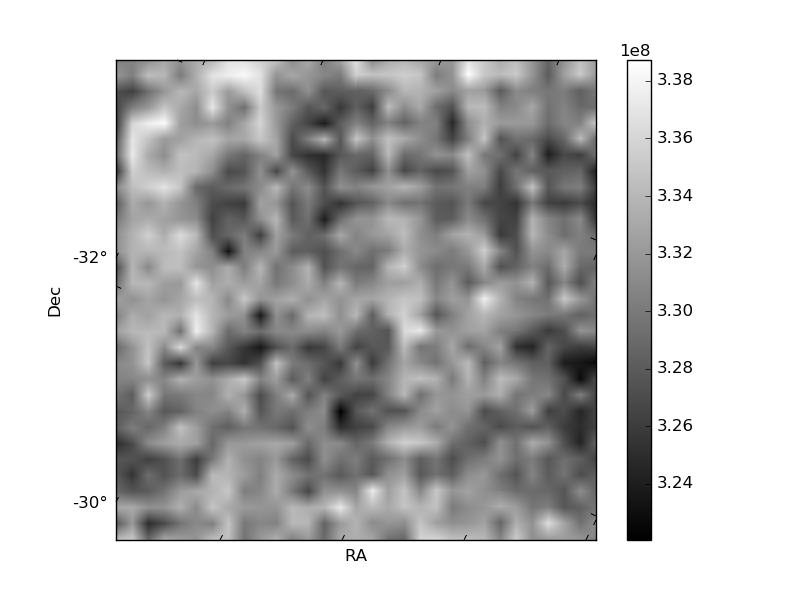
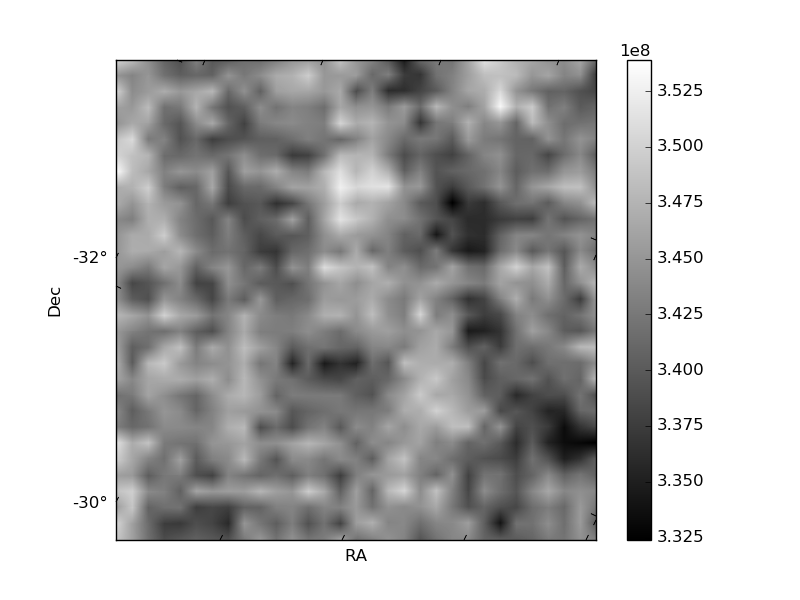
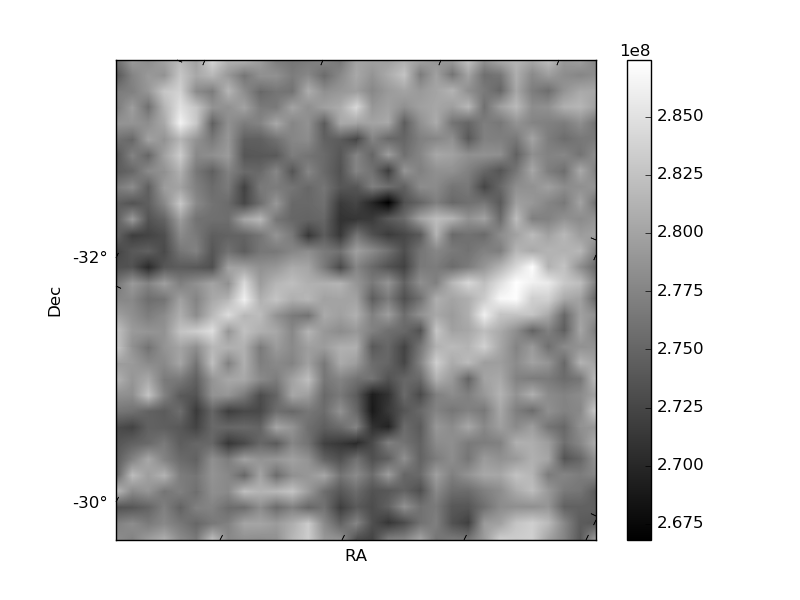
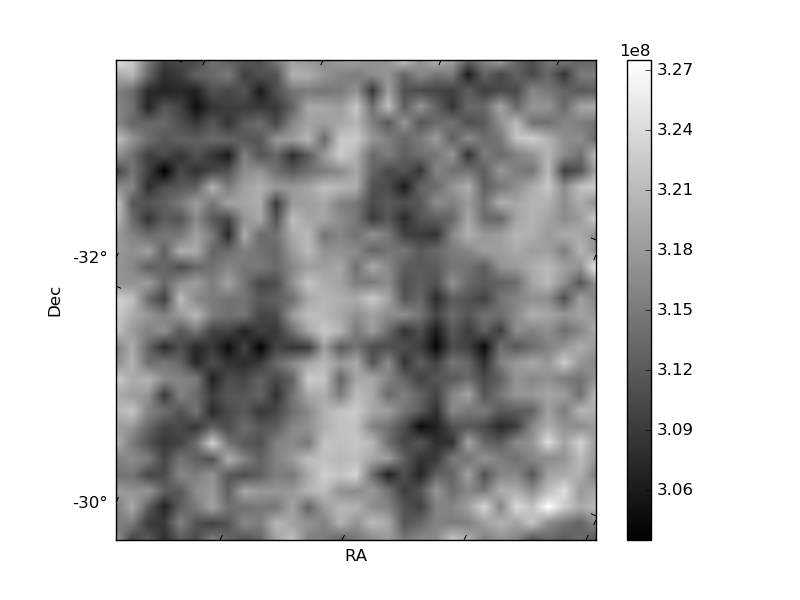
Histogram calculated using DETX and DETY for each event in the final _common_clean file
| Quadrant A | 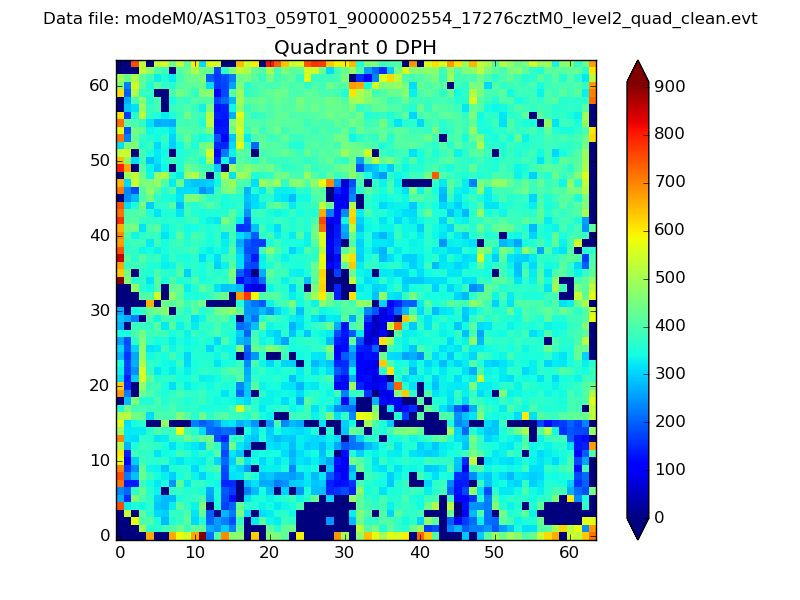 |
 |
Quadrant B |
|---|---|---|---|
| Quadrant D |  |
 |
Quadrant C |
| Plot type | Count rate plots | Images |
|---|---|---|
| Comparison with Poisson distribution Blue bars denote a histogram of data divided into 1 sec bins. Red curve is a Poisson curve with rate = median count rate of data. |
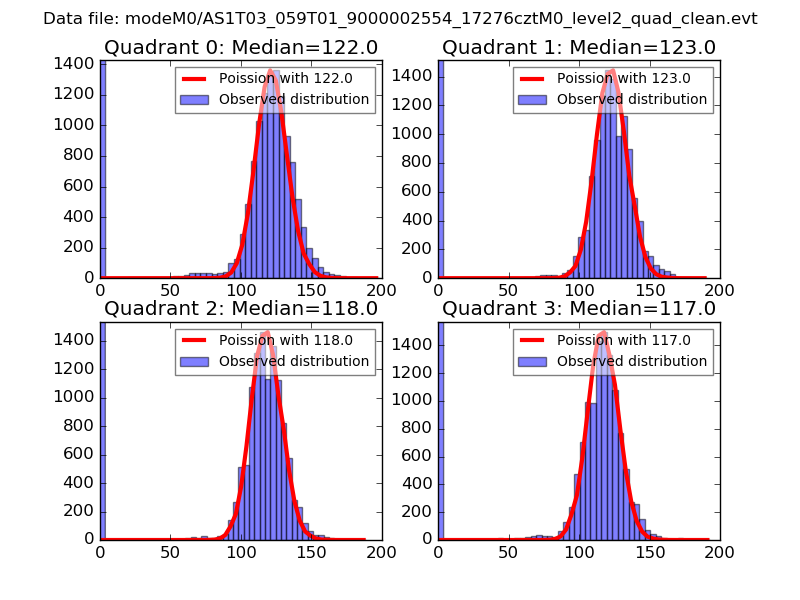 |
 |
| Quadrant-wise count rates Data is divided into 100 sec bins |
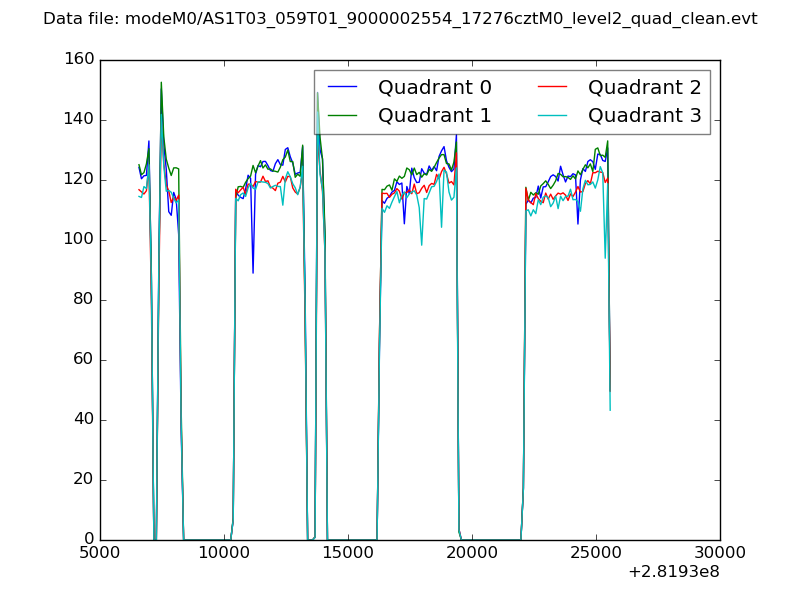 |
|
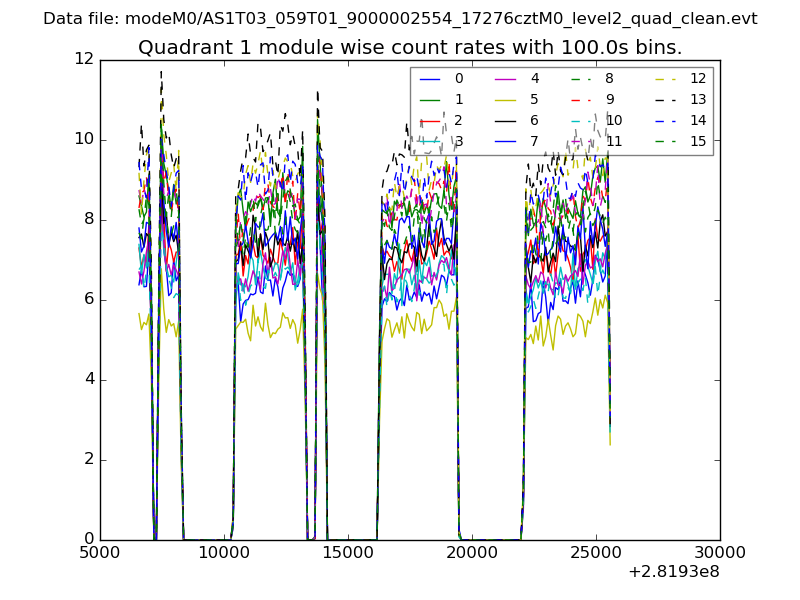
| Module-wise count rates for Quadrant A Data is divided into 100 sec bins |
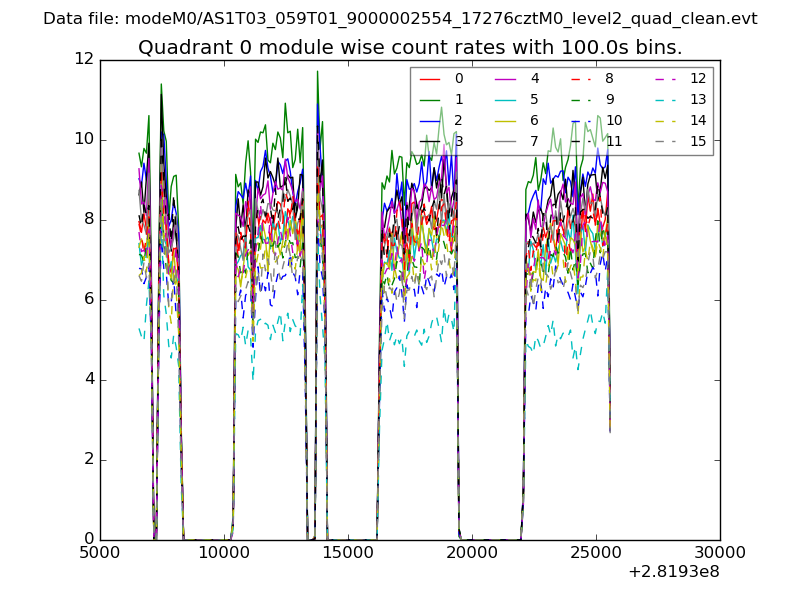 |
 |
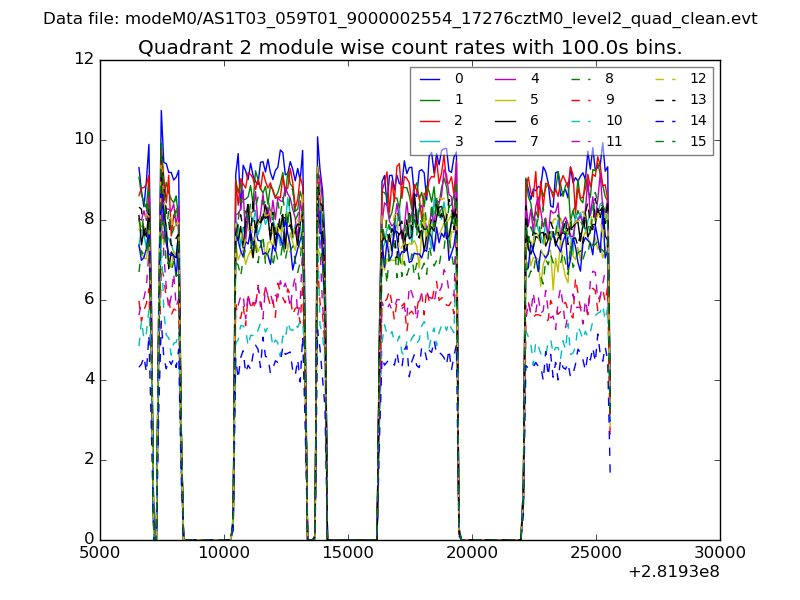
| Module-wise count rates for Quadrant B Data is divided into 100 sec bins |
 |
 |
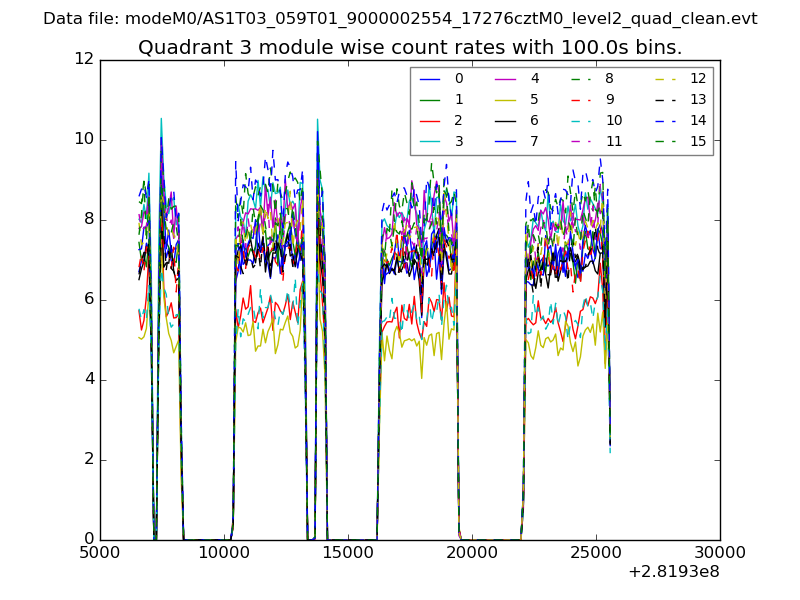
| Module-wise count rates for Quadrant C Data is divided into 100 sec bins |
 |
 |
| Module-wise count rates for Quadrant D Data is divided into 100 sec bins |
 |
 |
| Parameter | Plot |
|---|---|
| CZT HV Monitor | 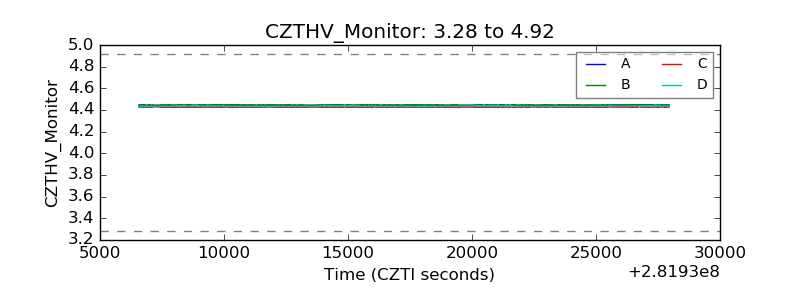 |
| D_VDD | 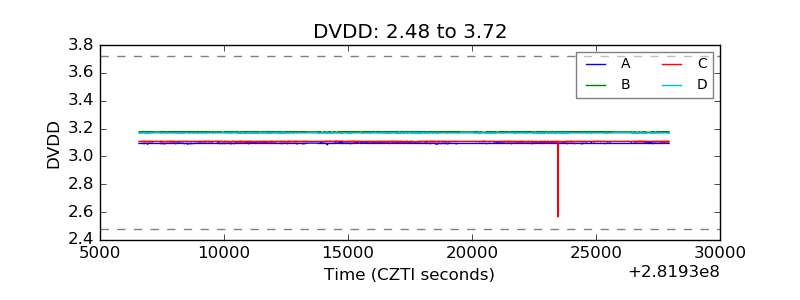 |
| Temperature 1 | 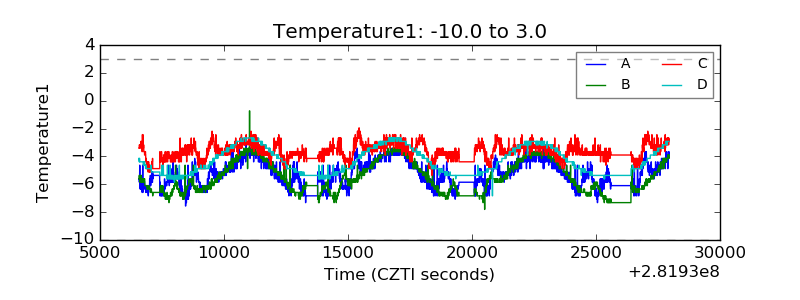 |
| Veto HV Monitor | 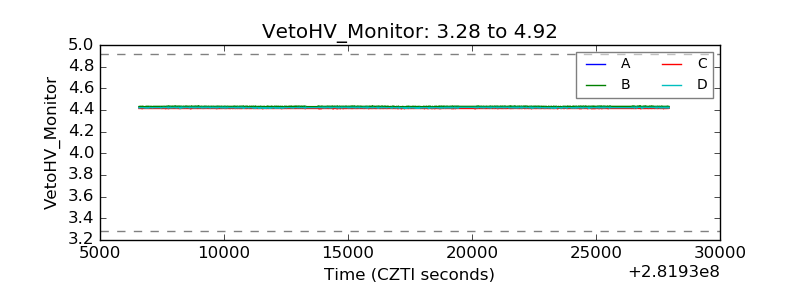 |
| Veto LLD | 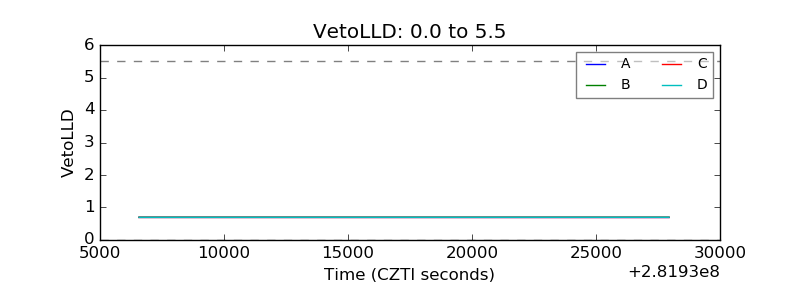 |
| Alpha Counter | 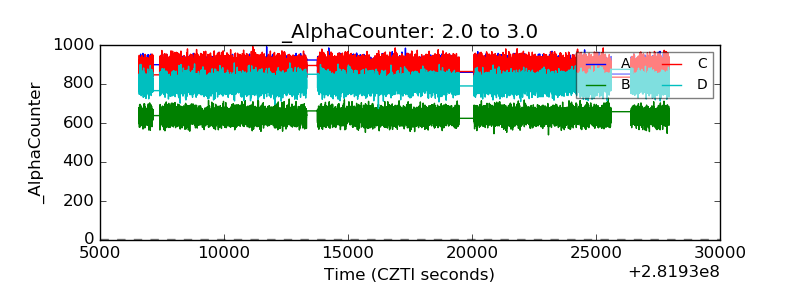 |
| _CPM_Rate | 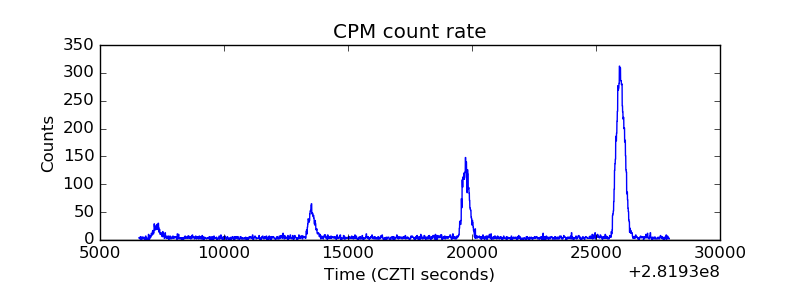 |
| CZT Counter | 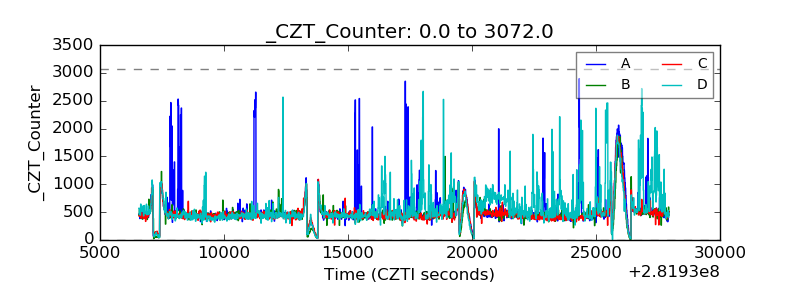 |
| +2.5 Volts monitor |  |
| +5 Volts monitor | 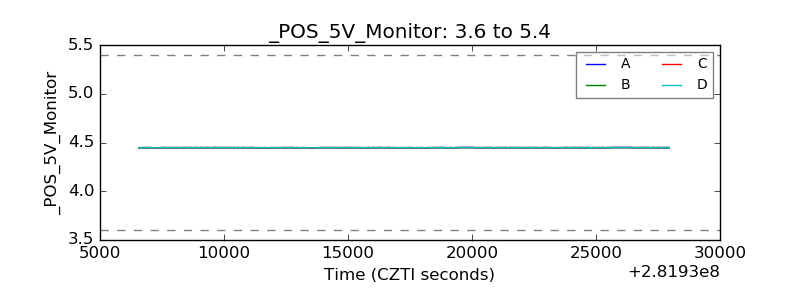 |
| _ROLL_ROT | 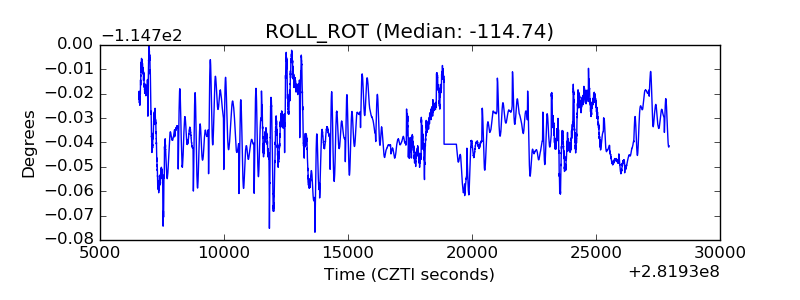 |
| _Roll_DEC | 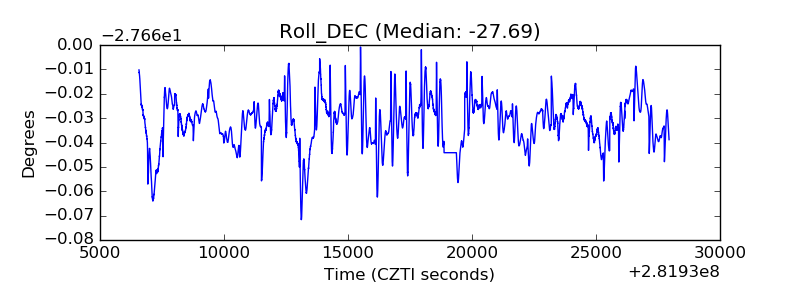 |
| _Roll_RA | 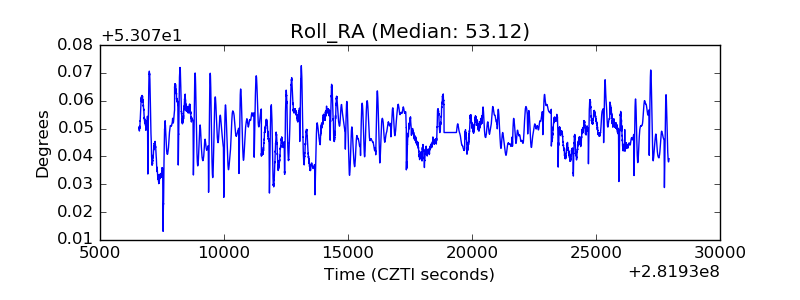 |
| Veto Counter | 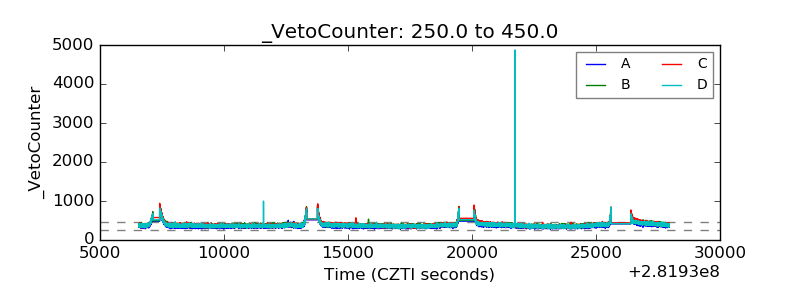 |