| Param | Original file | Final file |
|---|---|---|
| Filename | modeM0/AS1T03_059T01_9000002554_17277cztM0_level2.evt | modeM0/AS1T03_059T01_9000002554_17277cztM0_level2_quad_clean.evt |
| Size (bytes) | 551,324,160 | 89,809,920 |
| Size | 525.8 MB | 85.6 MB |
| Events in quadrant A | 4,543,052 | 552,652 |
| Events in quadrant B | 3,559,703 | 569,448 |
| Events in quadrant C | 3,553,631 | 543,689 |
| Events in quadrant D | 4,537,603 | 538,150 |
| Mode M9 | |||
|---|---|---|---|
| Quadrant | BADHDUFLAG | Total packets | Discarded packets |
| A | 0 | 18 | 0 |
| B | 0 | 18 | 0 |
| C | 0 | 18 | 0 |
| D | 0 | 18 | 0 |
| Mode SS | |||
|---|---|---|---|
| Quadrant | BADHDUFLAG | Total packets | Discarded packets |
| A | 0 | 152 | 0 |
| B | 0 | 152 | 0 |
| C | 0 | 152 | 0 |
| D | 0 | 152 | 0 |
| Mode M0 | |||
|---|---|---|---|
| Quadrant | BADHDUFLAG | Total packets | Discarded packets |
| A | 0 | 18339 | 2 |
| B | 0 | 15351 | 3 |
| C | 0 | 15386 | 2 |
| D | 0 | 18589 | 2 |
| Quadrant | Total seconds | Saturated seconds | Saturation percentage |
|---|---|---|---|
| A | 7411 | 311 | 4.196465% |
| B | 7410 | 106 | 1.430499% |
| C | 7411 | 130 | 1.754149% |
| D | 7411 | 293 | 3.953583% |
Noise dominated data is calculated using 1-second bins in cleaned event files. If a bin has >2000 counts, and if more than 50% of those come from <1% of pixels, then it is considered to be noise-dominated and hence unusable.
| Quadrant | # 1 sec bins | Bins with >0 counts | Bins with >2000 counts | High rate bins dominated by noise | Noise dominated (total time) | Noise dominated (detector-on time) | Marked lightcurve |
|---|---|---|---|---|---|---|---|
| A | 9146 | 7413 | 196 | 196 | 2.14% | 2.64% | 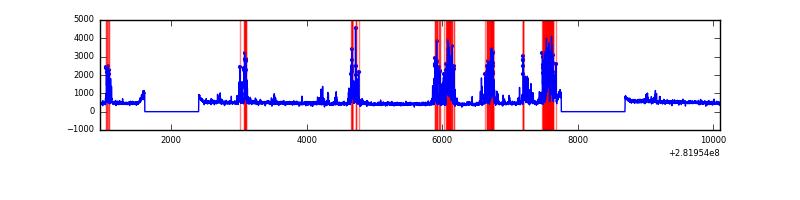 |
| B | 9145 | 7411 | 0 | 0 | 0.00% | 0.00% | 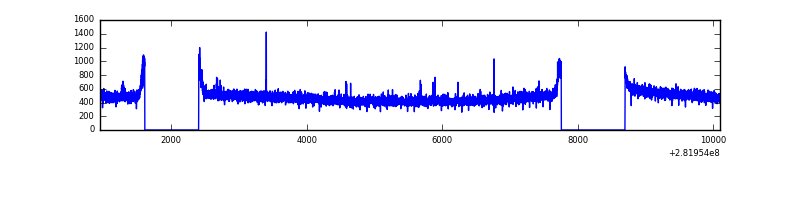 |
| C | 9146 | 7413 | 0 | 0 | 0.00% | 0.00% | 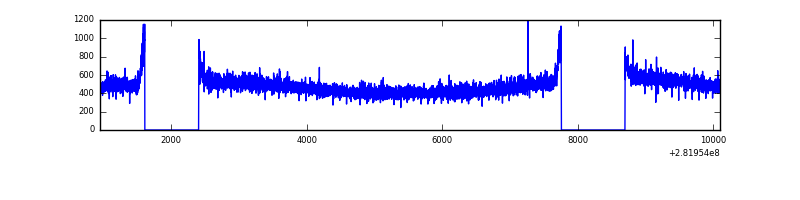 |
| D | 9146 | 7413 | 171 | 171 | 1.87% | 2.31% | 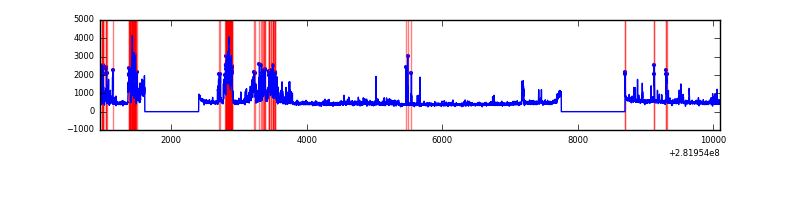 |
Top three noisy pixels from each quadrant. If the there are fewer than three noisy pixels in the level2.evt file, extra rows are filled as -1
| Pixel properties | Quadrant properties | ||||||
|---|---|---|---|---|---|---|---|
| Quadrant | DetID | PixID | Counts | Sigma | Mean | Median | Sigma |
| A | 14 | 235 | 1077874 | 5904.96 | 901 | 882 | 182.4 |
| A | 0 | 226 | 7915 | 38.56 | 901 | 882 | 182.4 |
| A | 3 | 137 | 6868 | 32.82 | 901 | 882 | 182.4 |
| B | 12 | 111 | 21503 | 117.25 | 906 | 882 | 175.9 |
| B | 11 | 111 | 18913 | 102.52 | 906 | 882 | 175.9 |
| B | 14 | 111 | 16781 | 90.4 | 906 | 882 | 175.9 |
| C | 14 | 238 | 132620 | 641.42 | 873 | 877 | 205.4 |
| C | 3 | 233 | 14895 | 68.25 | 873 | 877 | 205.4 |
| C | 13 | 61 | 5980 | 24.85 | 873 | 877 | 205.4 |
| D | 11 | 176 | 691887 | 3232.17 | 877 | 849 | 213.8 |
| D | 2 | 136 | 269179 | 1255.05 | 877 | 849 | 213.8 |
| D | 5 | 222 | 126937 | 589.75 | 877 | 849 | 213.8 |
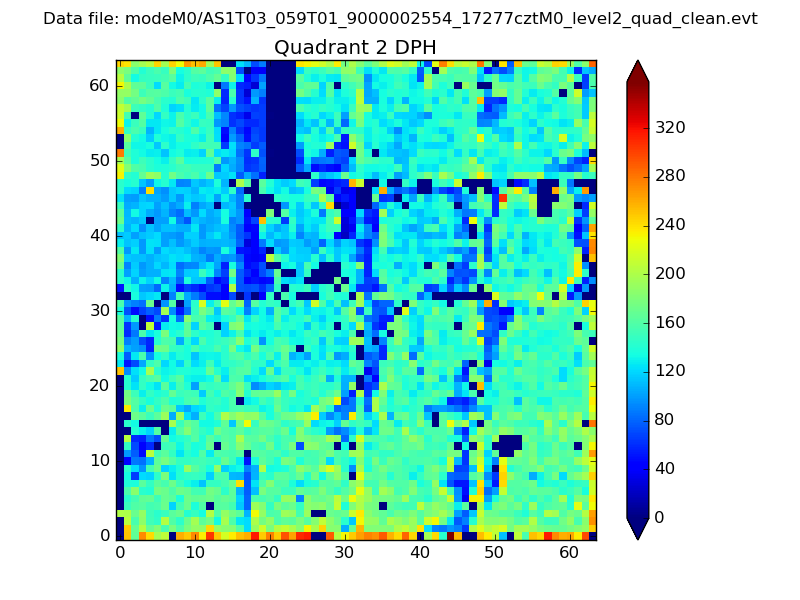
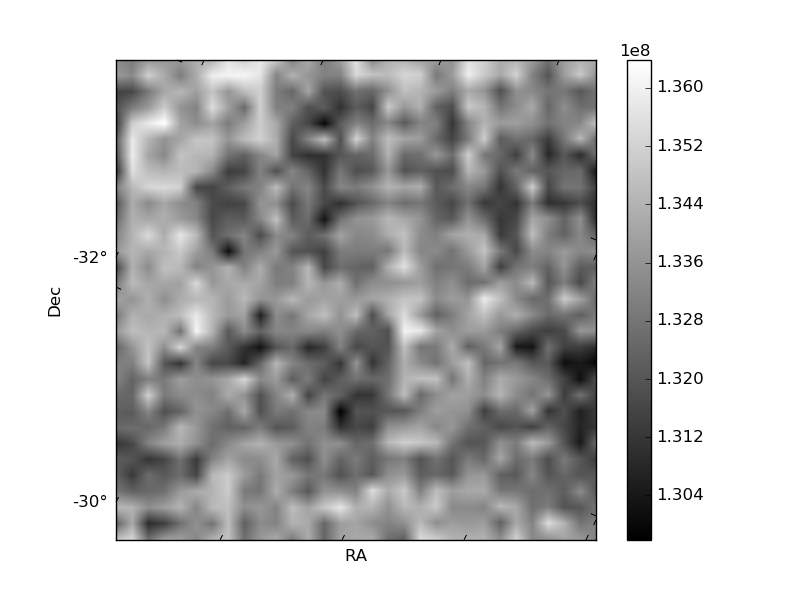
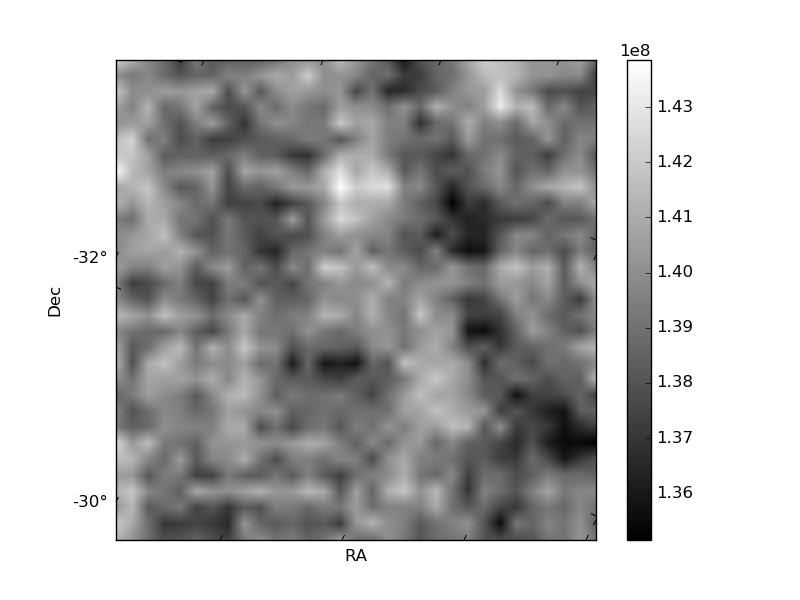
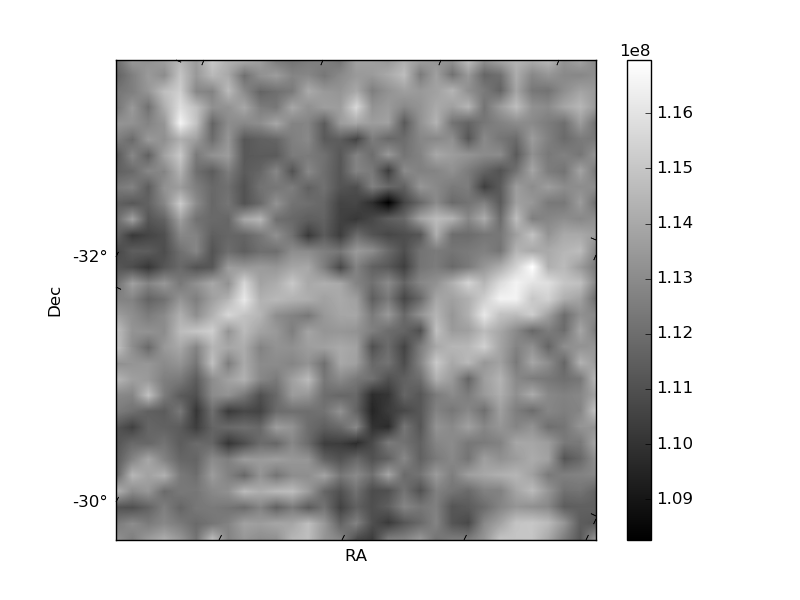
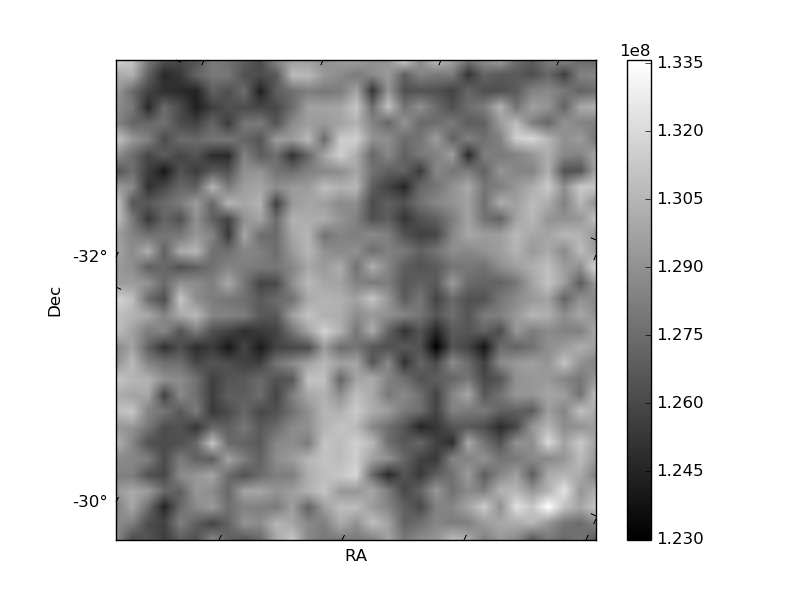
Histogram calculated using DETX and DETY for each event in the final _common_clean file
| Quadrant A |  |
 |
Quadrant B |
|---|---|---|---|
| Quadrant D | 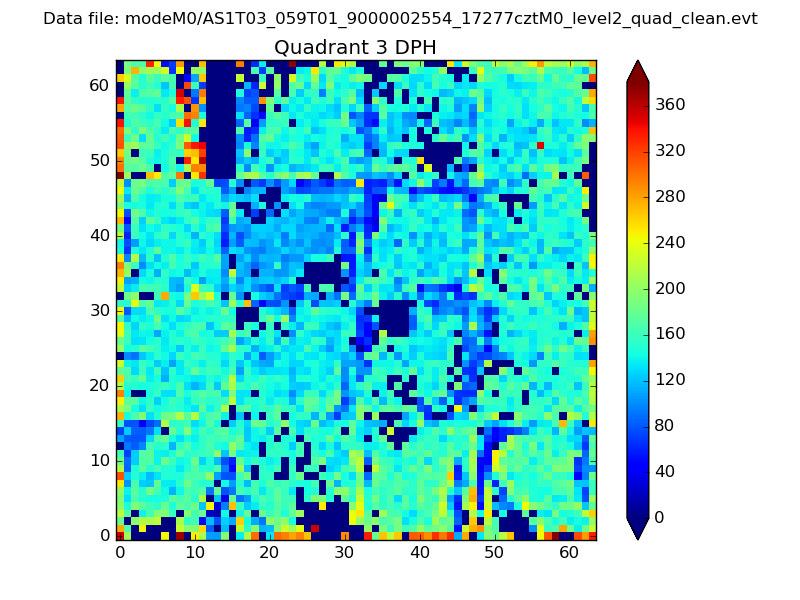 |
 |
Quadrant C |
| Plot type | Count rate plots | Images |
|---|---|---|
| Comparison with Poisson distribution Blue bars denote a histogram of data divided into 1 sec bins. Red curve is a Poisson curve with rate = median count rate of data. |
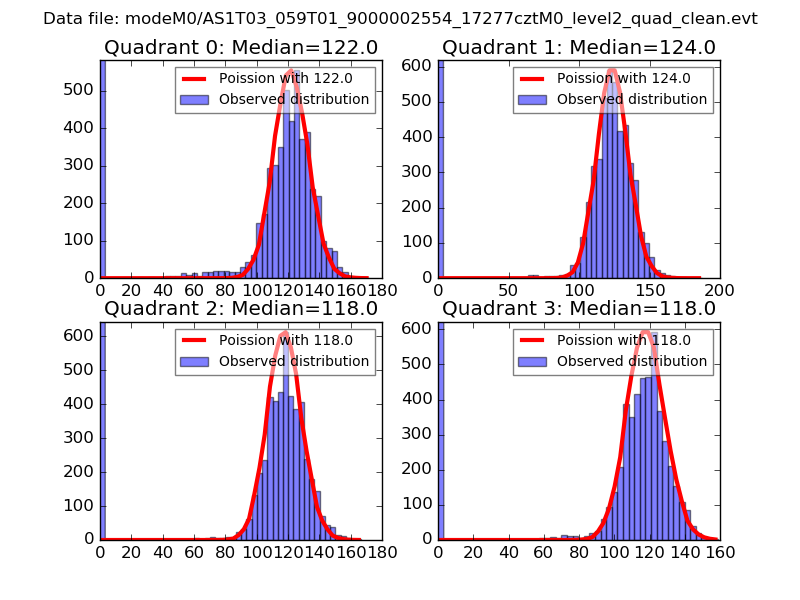 |
 |
| Quadrant-wise count rates Data is divided into 100 sec bins |
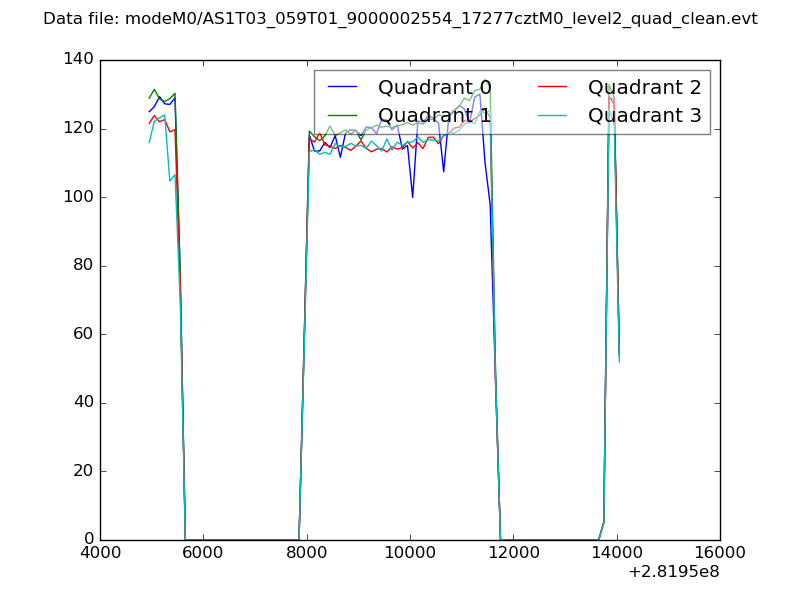 |
|
| Module-wise count rates for Quadrant A Data is divided into 100 sec bins |
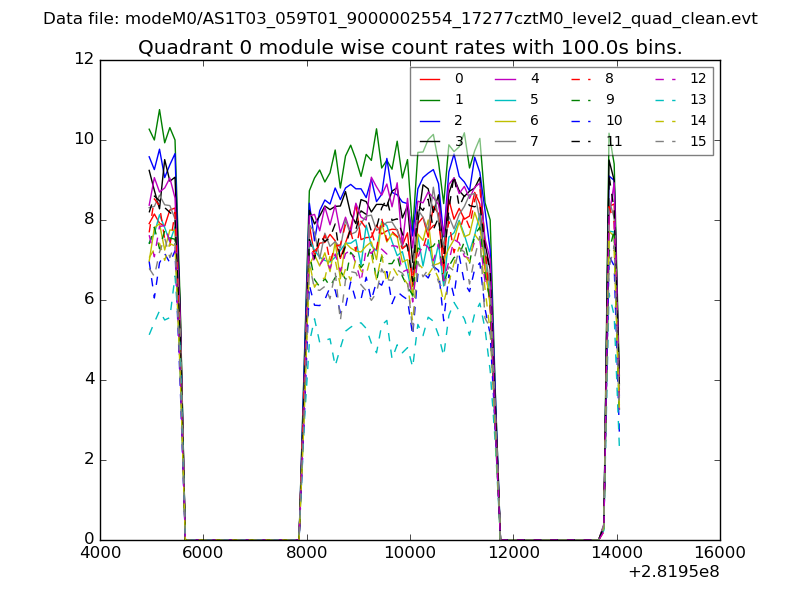 |
 |
| Module-wise count rates for Quadrant B Data is divided into 100 sec bins |
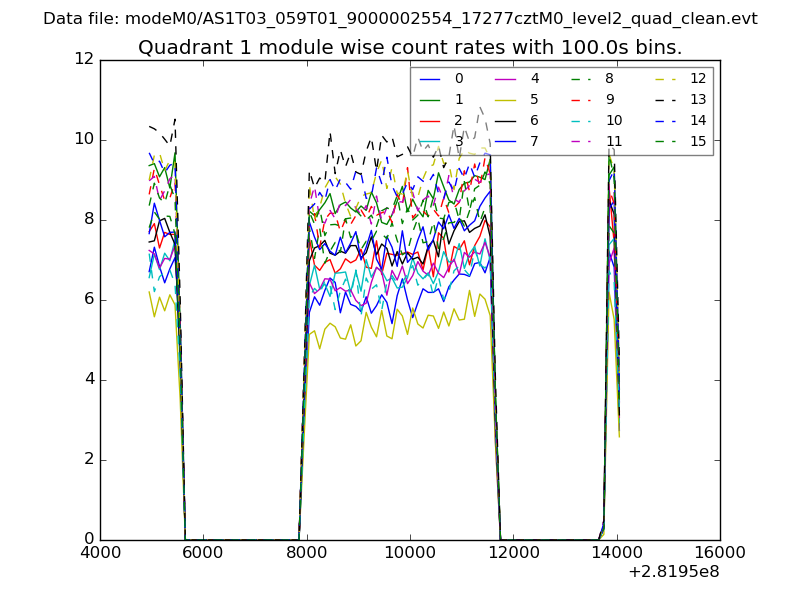 |
 |
| Module-wise count rates for Quadrant C Data is divided into 100 sec bins |
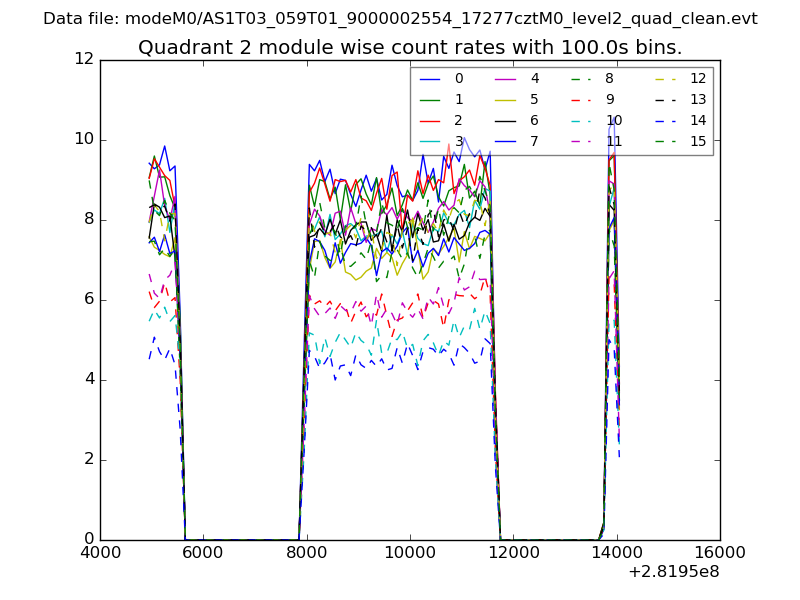 |
 |
| Module-wise count rates for Quadrant D Data is divided into 100 sec bins |
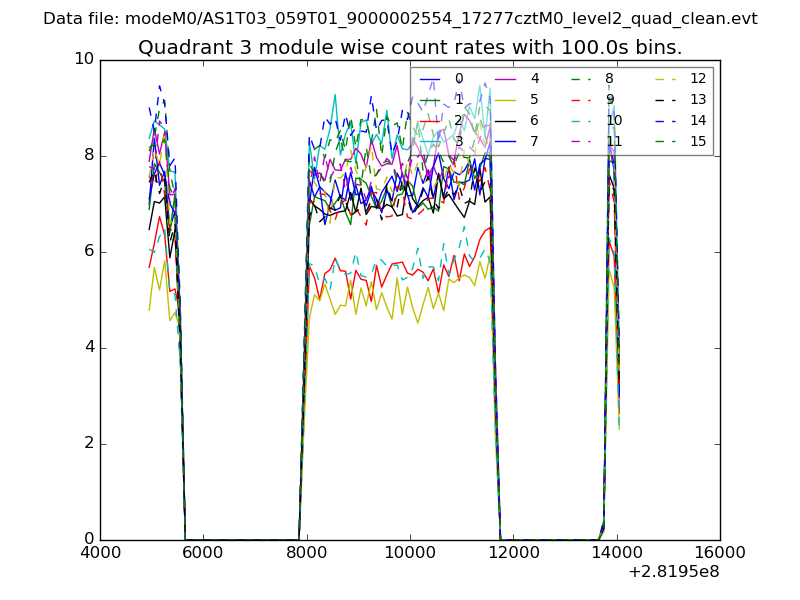 |
 |
| Parameter | Plot |
|---|---|
| CZT HV Monitor | 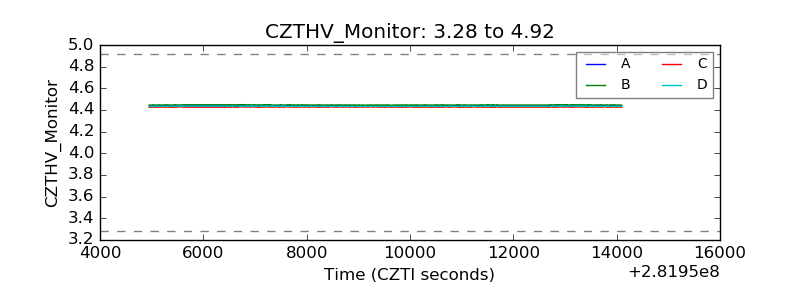 |
| D_VDD | 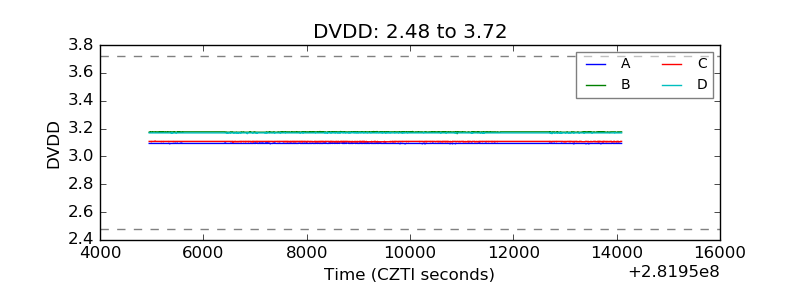 |
| Temperature 1 | 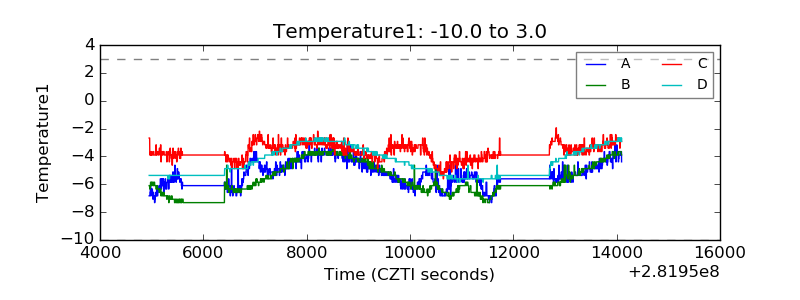 |
| Veto HV Monitor | 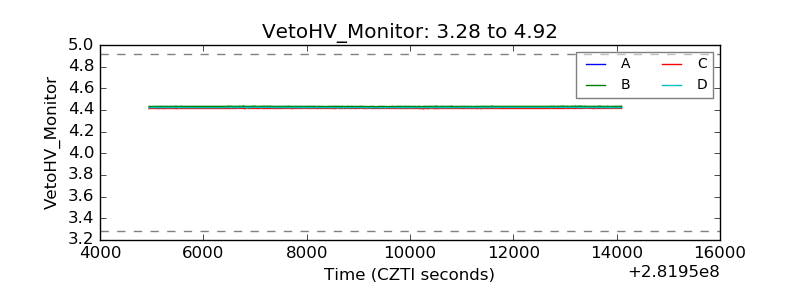 |
| Veto LLD | 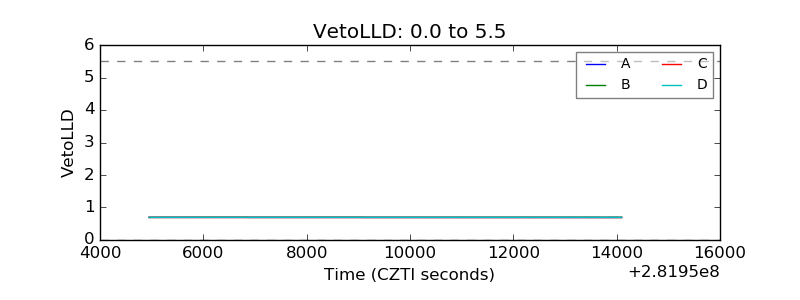 |
| Alpha Counter | 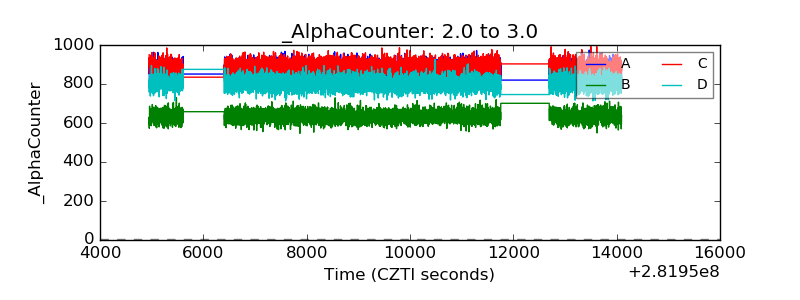 |
| _CPM_Rate | 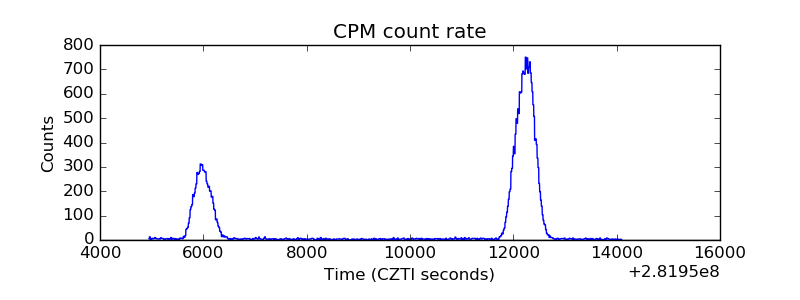 |
| CZT Counter | 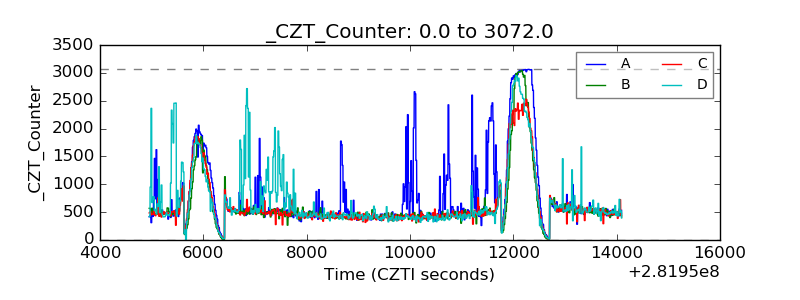 |
| +2.5 Volts monitor |  |
| +5 Volts monitor |  |
| _ROLL_ROT |  |
| _Roll_DEC | 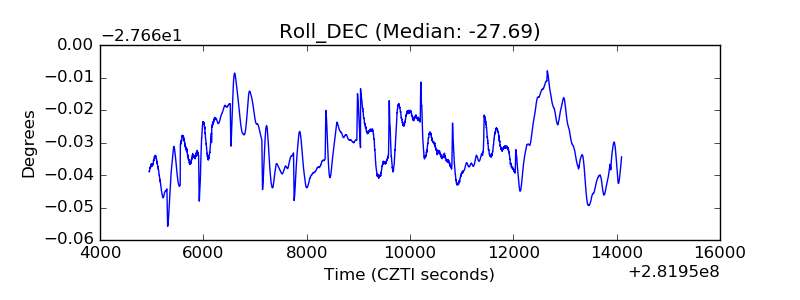 |
| _Roll_RA | 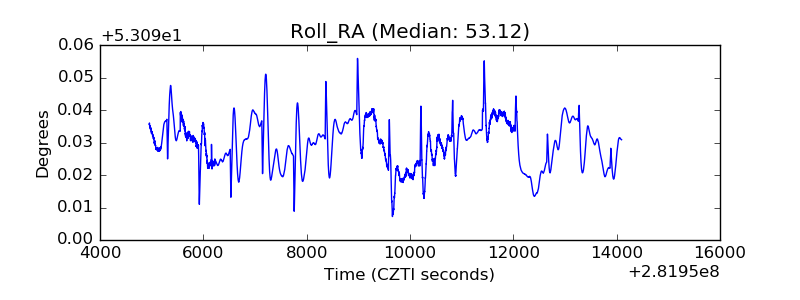 |
| Veto Counter | 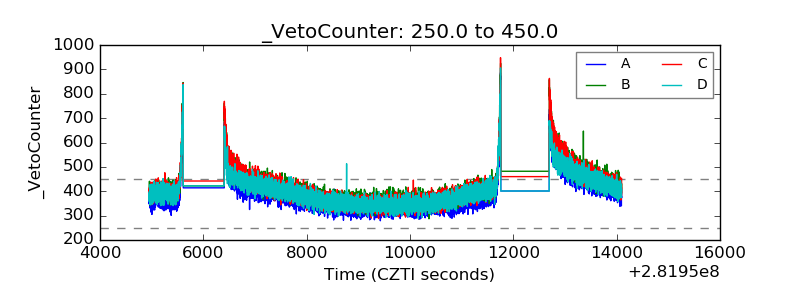 |