| Param | Original file | Final file |
|---|---|---|
| Filename | modeM0/AS1T03_059T01_9000002554_17279cztM0_level2.evt | modeM0/AS1T03_059T01_9000002554_17279cztM0_level2_quad_clean.evt |
| Size (bytes) | 507,752,640 | 86,348,160 |
| Size | 484.2 MB | 82.3 MB |
| Events in quadrant A | 3,859,249 | 549,599 |
| Events in quadrant B | 3,214,451 | 560,150 |
| Events in quadrant C | 3,215,636 | 532,059 |
| Events in quadrant D | 4,641,666 | 514,268 |
| Mode M9 | |||
|---|---|---|---|
| Quadrant | BADHDUFLAG | Total packets | Discarded packets |
| A | 0 | 15 | 0 |
| B | 0 | 16 | 0 |
| C | 0 | 16 | 0 |
| D | 0 | 16 | 0 |
| Mode SS | |||
|---|---|---|---|
| Quadrant | BADHDUFLAG | Total packets | Discarded packets |
| A | 0 | 132 | 0 |
| B | 0 | 132 | 0 |
| C | 0 | 132 | 0 |
| D | 0 | 132 | 0 |
| Mode M0 | |||
|---|---|---|---|
| Quadrant | BADHDUFLAG | Total packets | Discarded packets |
| A | 0 | 15877 | 2 |
| B | 0 | 13843 | 2 |
| C | 0 | 13920 | 2 |
| D | 0 | 18315 | 2 |
| Quadrant | Total seconds | Saturated seconds | Saturation percentage |
|---|---|---|---|
| A | 6582 | 207 | 3.144941% |
| B | 6582 | 70 | 1.063507% |
| C | 6582 | 108 | 1.640839% |
| D | 6582 | 368 | 5.591006% |
Noise dominated data is calculated using 1-second bins in cleaned event files. If a bin has >2000 counts, and if more than 50% of those come from <1% of pixels, then it is considered to be noise-dominated and hence unusable.
| Quadrant | # 1 sec bins | Bins with >0 counts | Bins with >2000 counts | High rate bins dominated by noise | Noise dominated (total time) | Noise dominated (detector-on time) | Marked lightcurve |
|---|---|---|---|---|---|---|---|
| A | 7672 | 6582 | 106 | 106 | 1.38% | 1.61% | 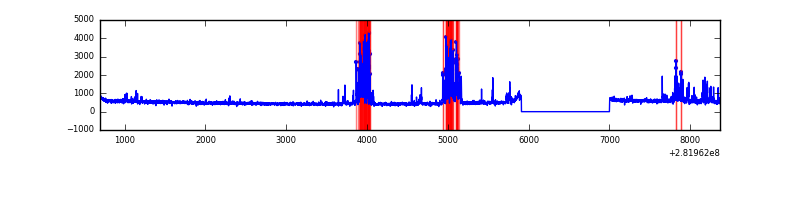 |
| B | 7672 | 6582 | 0 | 0 | 0.00% | 0.00% | 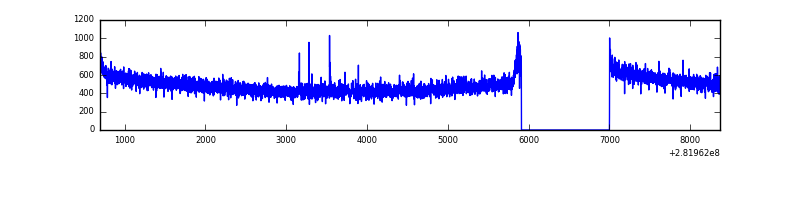 |
| C | 7672 | 6582 | 0 | 0 | 0.00% | 0.00% | 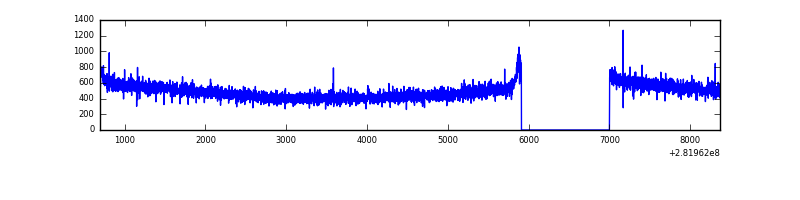 |
| D | 7672 | 6582 | 263 | 263 | 3.43% | 4.00% | 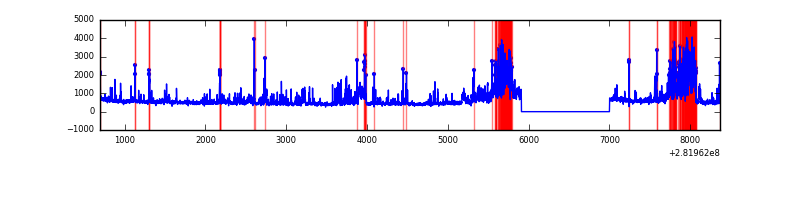 |
Top three noisy pixels from each quadrant. If the there are fewer than three noisy pixels in the level2.evt file, extra rows are filled as -1
| Pixel properties | Quadrant properties | ||||||
|---|---|---|---|---|---|---|---|
| Quadrant | DetID | PixID | Counts | Sigma | Mean | Median | Sigma |
| A | 14 | 235 | 692758 | 4161.72 | 824 | 807 | 166.3 |
| A | 0 | 226 | 7187 | 38.37 | 824 | 807 | 166.3 |
| A | 3 | 137 | 6199 | 32.43 | 824 | 807 | 166.3 |
| B | 12 | 111 | 19201 | 117.35 | 821 | 801 | 156.8 |
| B | 11 | 111 | 16782 | 101.92 | 821 | 801 | 156.8 |
| B | 14 | 111 | 14797 | 89.26 | 821 | 801 | 156.8 |
| C | 14 | 238 | 121515 | 660.65 | 784 | 789 | 182.7 |
| C | 3 | 233 | 28087 | 149.38 | 784 | 789 | 182.7 |
| C | 7 | 220 | 8510 | 42.25 | 784 | 789 | 182.7 |
| D | 11 | 176 | 919744 | 4792.11 | 785 | 761 | 191.8 |
| D | 5 | 222 | 618514 | 3221.32 | 785 | 761 | 191.8 |
| D | 11 | 66 | 38298 | 195.74 | 785 | 761 | 191.8 |
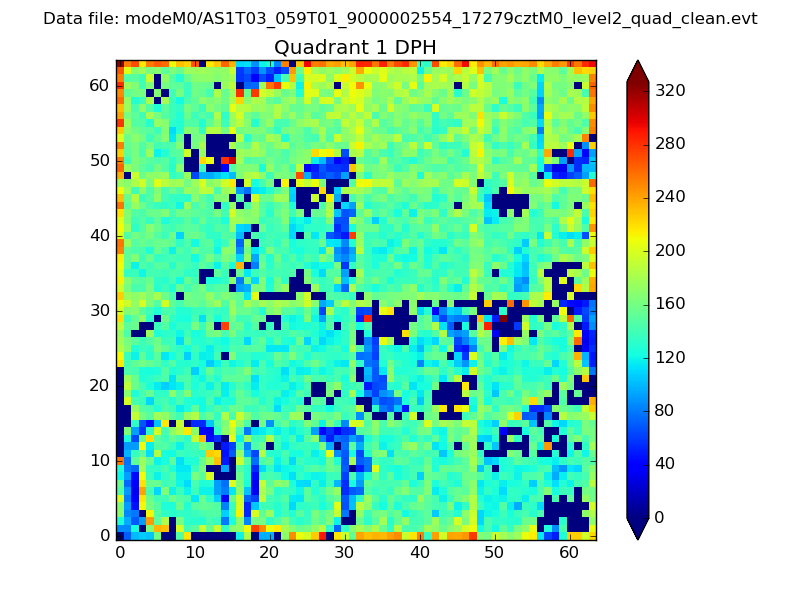
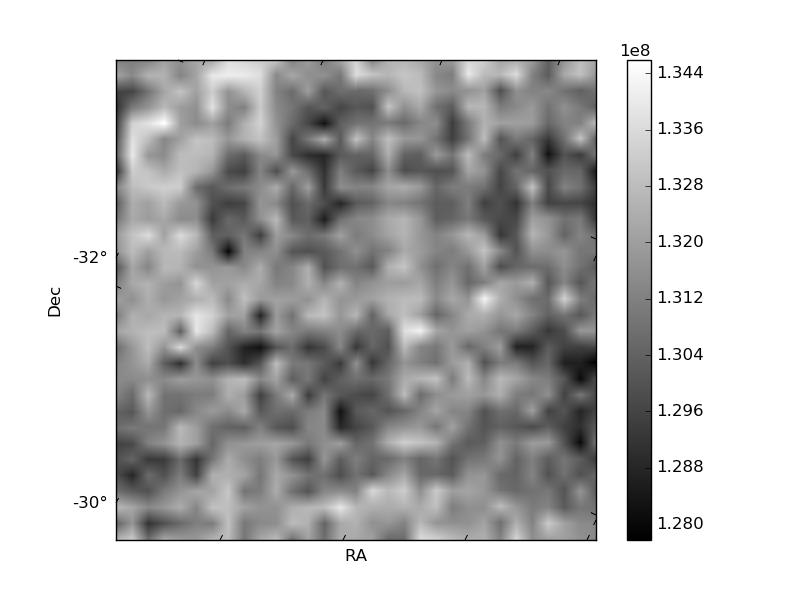
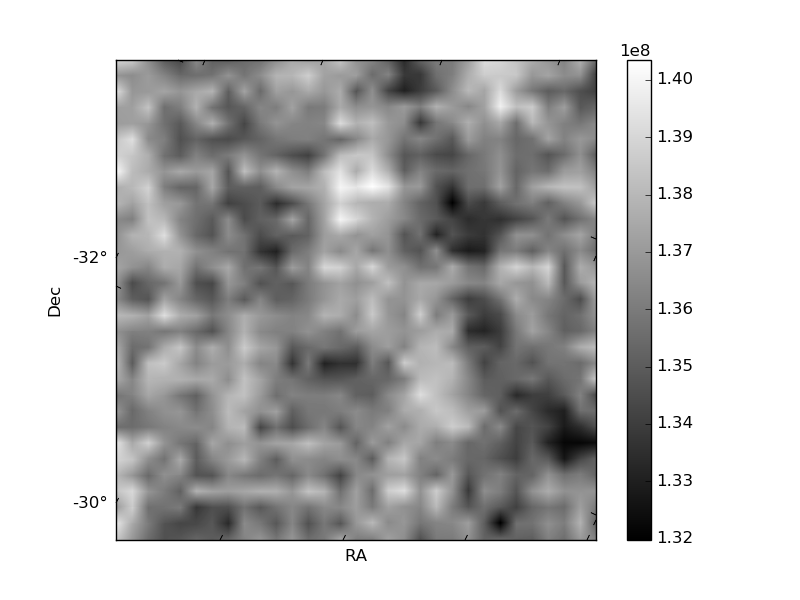
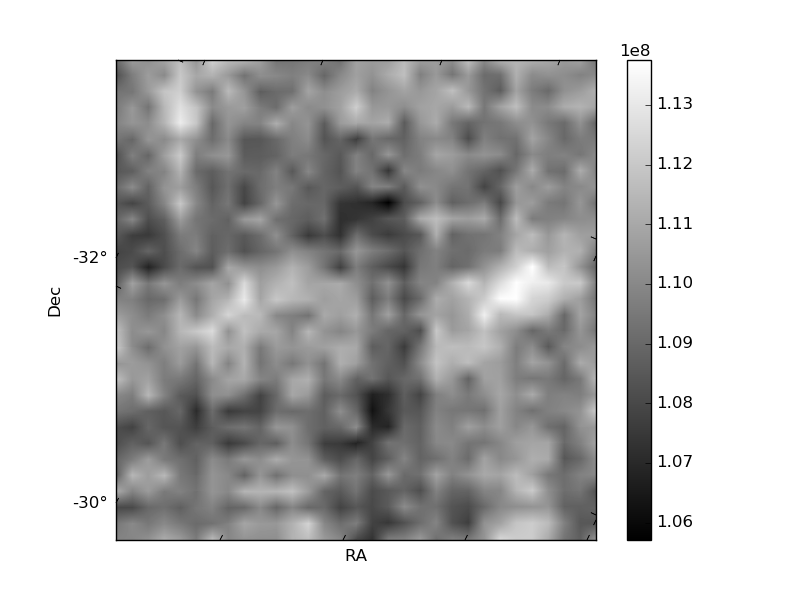
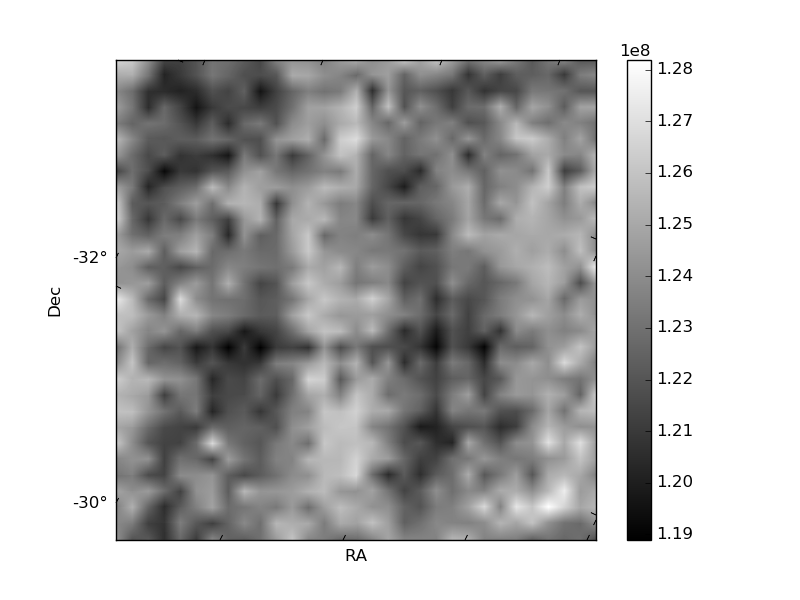
Histogram calculated using DETX and DETY for each event in the final _common_clean file
| Quadrant A |  |
 |
Quadrant B |
|---|---|---|---|
| Quadrant D | 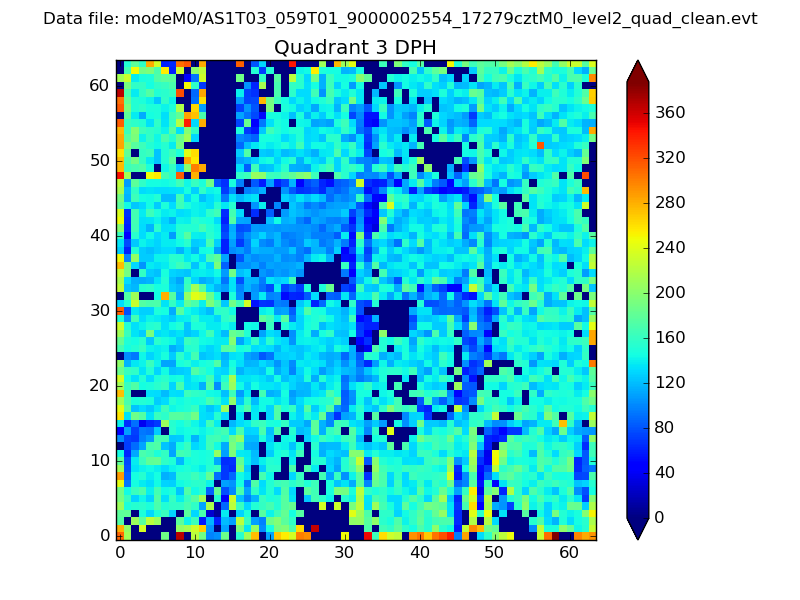 |
 |
Quadrant C |
| Plot type | Count rate plots | Images |
|---|---|---|
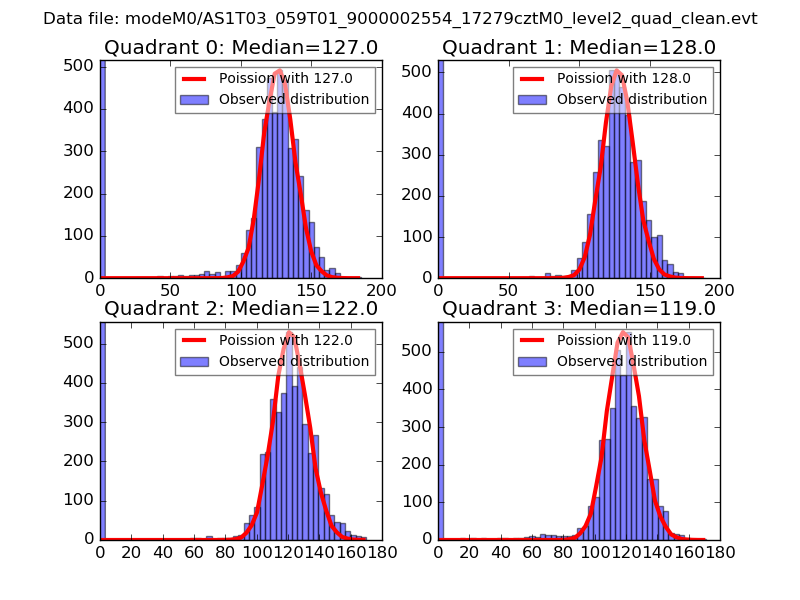
| Comparison with Poisson distribution Blue bars denote a histogram of data divided into 1 sec bins. Red curve is a Poisson curve with rate = median count rate of data. |
 |
 |
| Quadrant-wise count rates Data is divided into 100 sec bins |
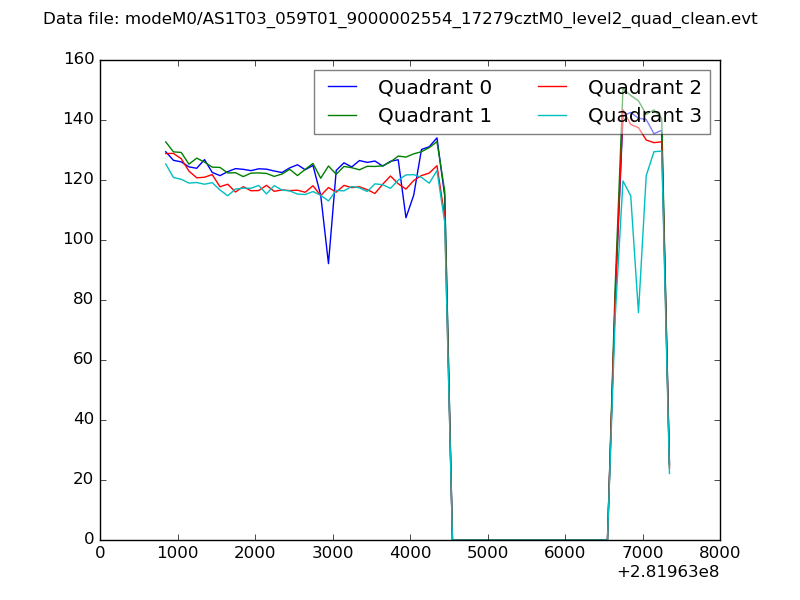 |
|
| Module-wise count rates for Quadrant A Data is divided into 100 sec bins |
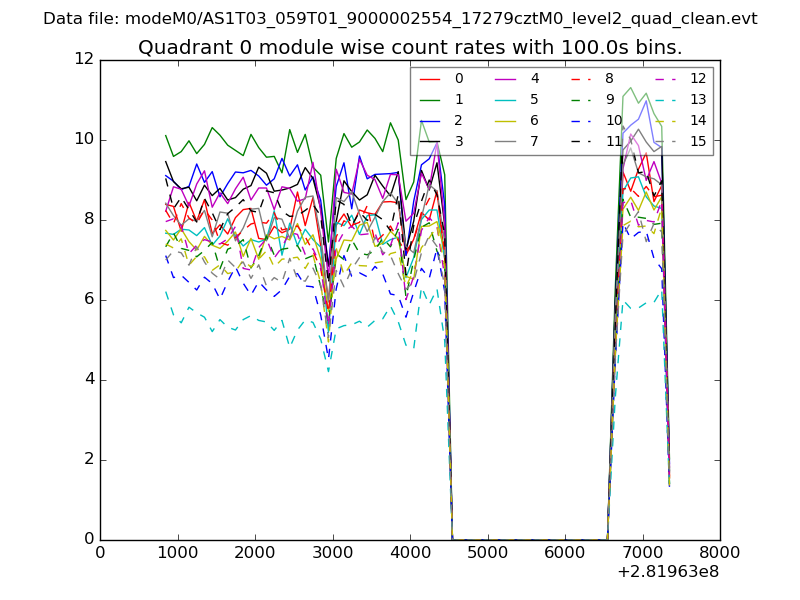 |
 |
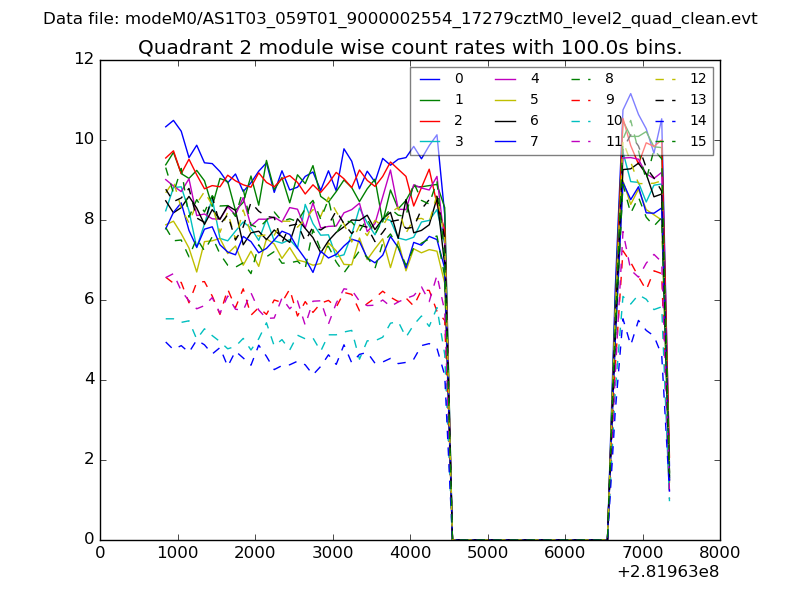
| Module-wise count rates for Quadrant B Data is divided into 100 sec bins |
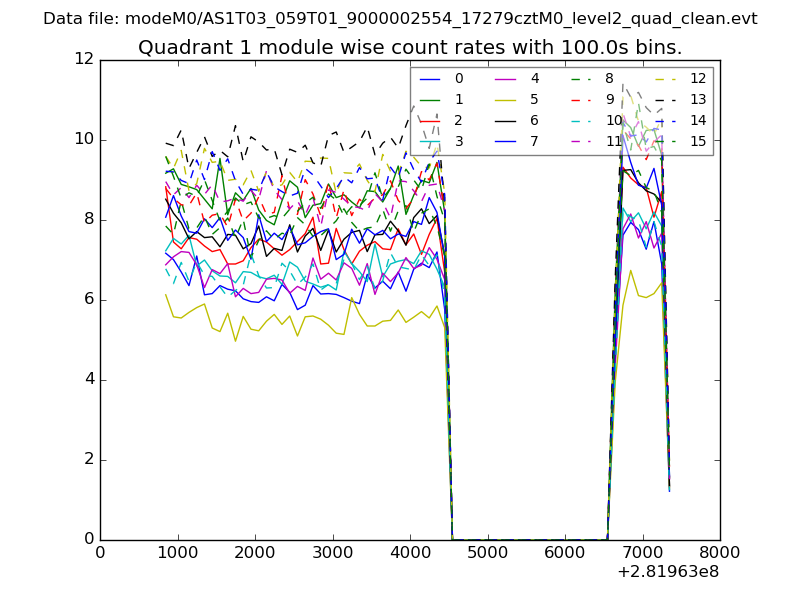 |
 |
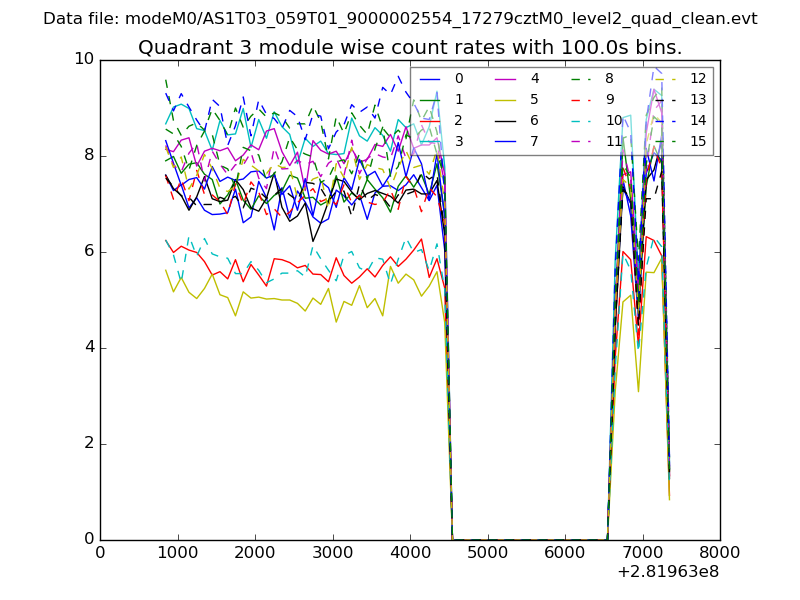
| Module-wise count rates for Quadrant C Data is divided into 100 sec bins |
 |
 |
| Module-wise count rates for Quadrant D Data is divided into 100 sec bins |
 |
 |
| Parameter | Plot |
|---|---|
| CZT HV Monitor | 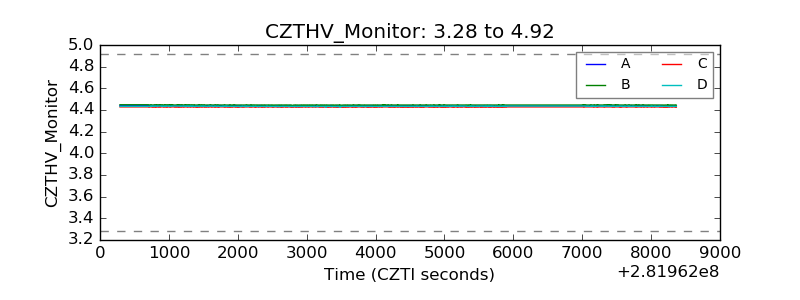 |
| D_VDD | 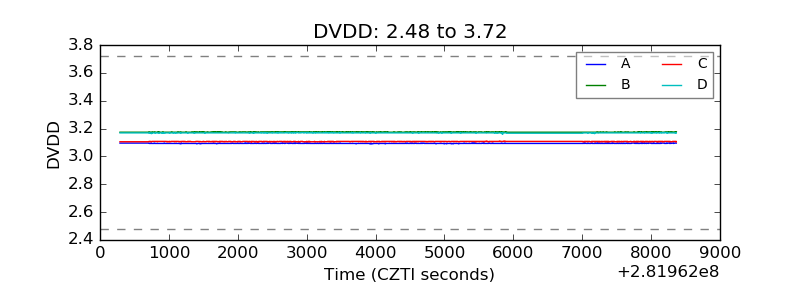 |
| Temperature 1 | 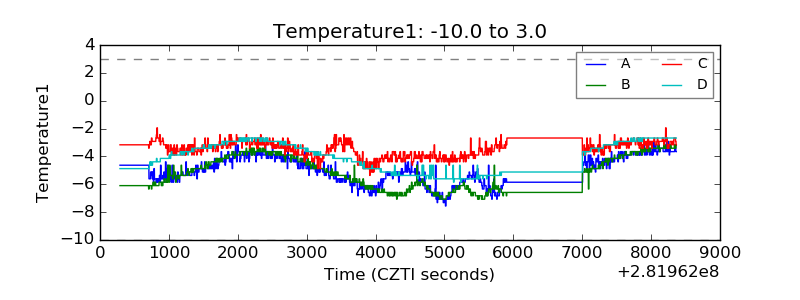 |
| Veto HV Monitor | 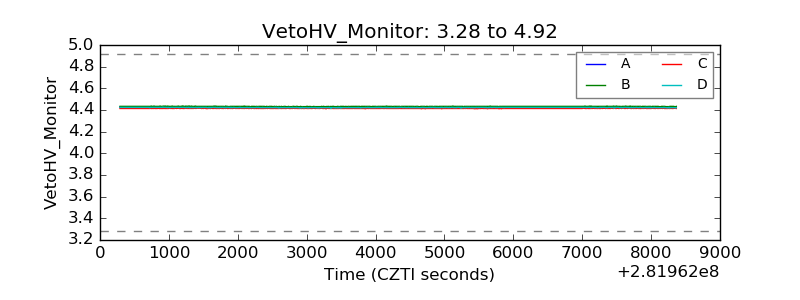 |
| Veto LLD | 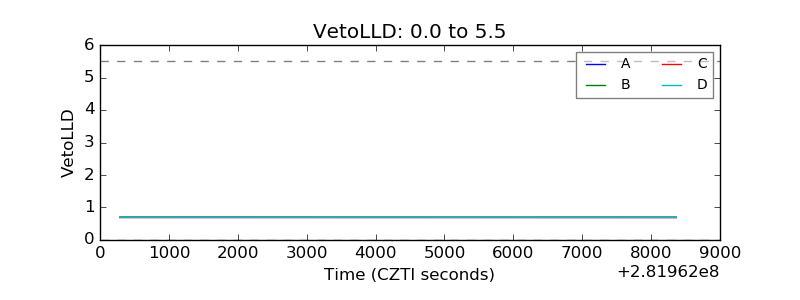 |
| Alpha Counter | 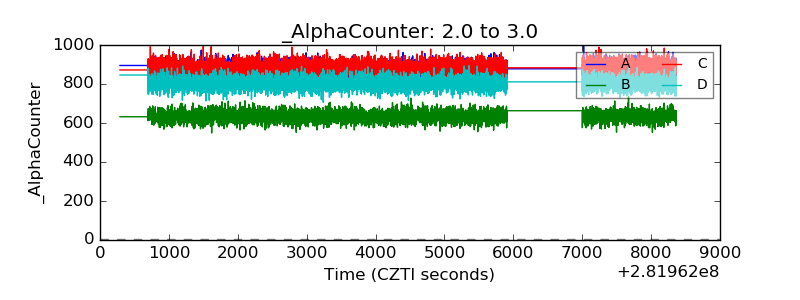 |
| _CPM_Rate | 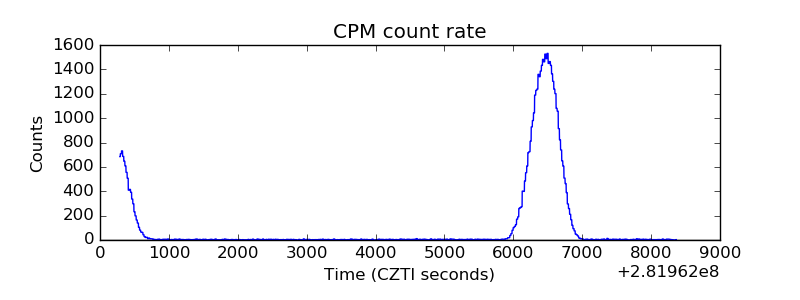 |
| CZT Counter | 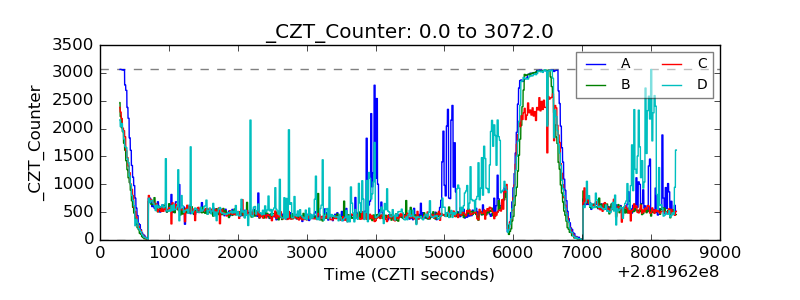 |
| +2.5 Volts monitor |  |
| +5 Volts monitor |  |
| _ROLL_ROT | 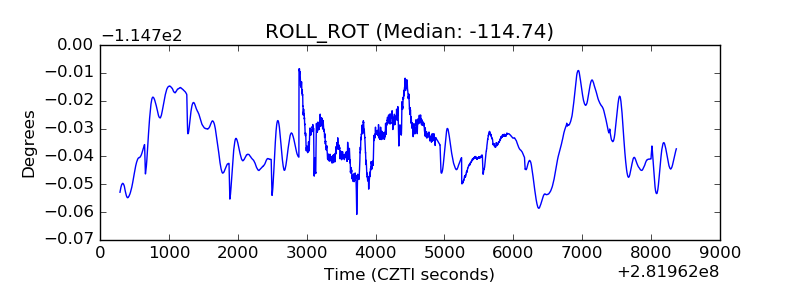 |
| _Roll_DEC | 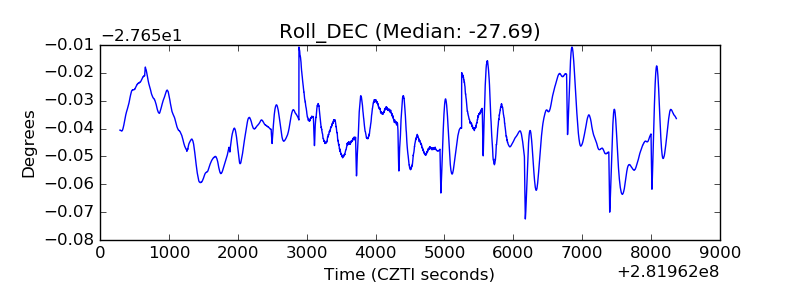 |
| _Roll_RA | 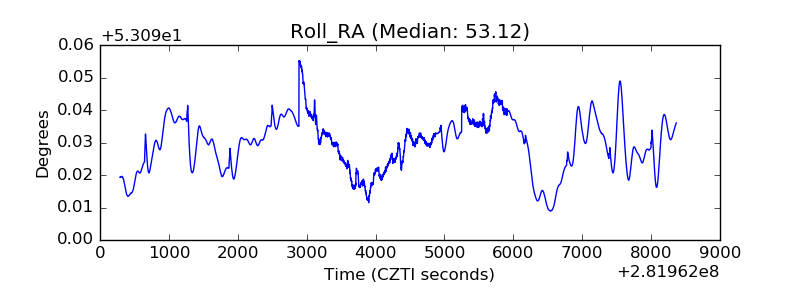 |
| Veto Counter | 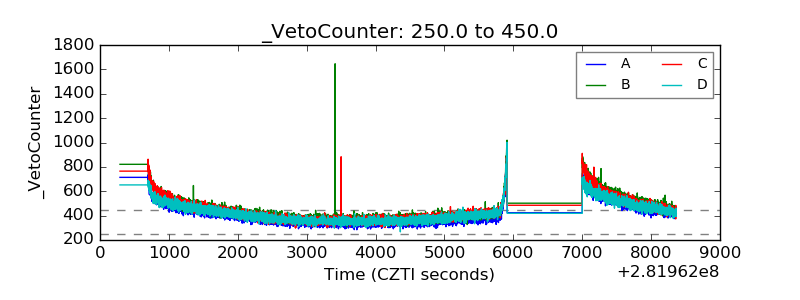 |