| Param | Original file | Final file |
|---|---|---|
| Filename | modeM0/AS1T03_059T01_9000002554_17280cztM0_level2.evt | modeM0/AS1T03_059T01_9000002554_17280cztM0_level2_quad_clean.evt |
| Size (bytes) | 627,488,640 | 94,302,720 |
| Size | 598.4 MB | 89.9 MB |
| Events in quadrant A | 6,105,130 | 593,771 |
| Events in quadrant B | 3,258,739 | 645,146 |
| Events in quadrant C | 3,256,553 | 602,959 |
| Events in quadrant D | 5,948,109 | 565,221 |
| Mode M9 | |||
|---|---|---|---|
| Quadrant | BADHDUFLAG | Total packets | Discarded packets |
| A | 0 | 23 | 0 |
| B | 0 | 23 | 0 |
| C | 0 | 23 | 0 |
| D | 0 | 23 | 0 |
| Mode SS | |||
|---|---|---|---|
| Quadrant | BADHDUFLAG | Total packets | Discarded packets |
| A | 0 | 132 | 0 |
| B | 0 | 132 | 0 |
| C | 0 | 132 | 0 |
| D | 0 | 132 | 0 |
| Mode M0 | |||
|---|---|---|---|
| Quadrant | BADHDUFLAG | Total packets | Discarded packets |
| A | 0 | 22608 | 2 |
| B | 0 | 13929 | 2 |
| C | 0 | 13905 | 2 |
| D | 0 | 22083 | 2 |
| Quadrant | Total seconds | Saturated seconds | Saturation percentage |
|---|---|---|---|
| A | 6429 | 856 | 13.314668% |
| B | 6429 | 112 | 1.742106% |
| C | 6430 | 135 | 2.099533% |
| D | 6430 | 690 | 10.730949% |
Noise dominated data is calculated using 1-second bins in cleaned event files. If a bin has >2000 counts, and if more than 50% of those come from <1% of pixels, then it is considered to be noise-dominated and hence unusable.
| Quadrant | # 1 sec bins | Bins with >0 counts | Bins with >2000 counts | High rate bins dominated by noise | Noise dominated (total time) | Noise dominated (detector-on time) | Marked lightcurve |
|---|---|---|---|---|---|---|---|
| A | 8714 | 6430 | 617 | 617 | 7.08% | 9.60% | 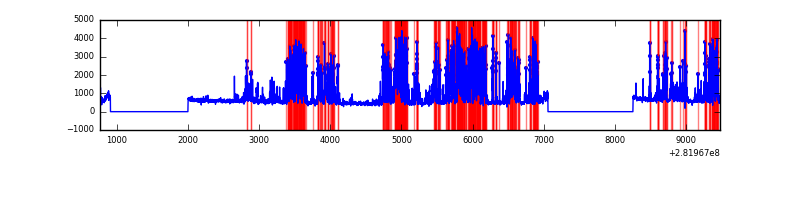 |
| B | 8714 | 6429 | 0 | 0 | 0.00% | 0.00% | 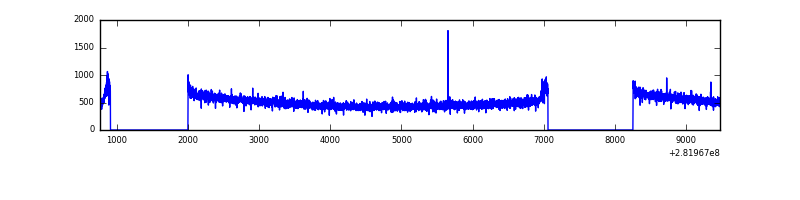 |
| C | 8715 | 6431 | 0 | 0 | 0.00% | 0.00% | 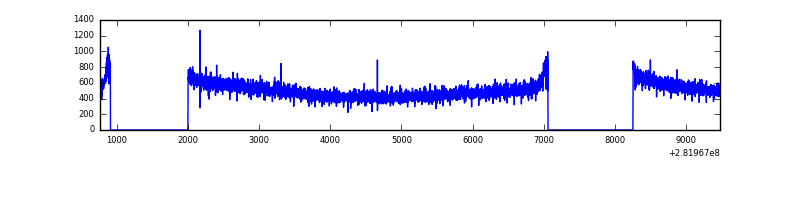 |
| D | 8715 | 6431 | 614 | 614 | 7.05% | 9.55% | 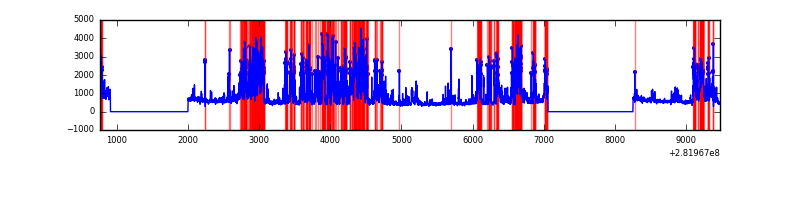 |
Top three noisy pixels from each quadrant. If the there are fewer than three noisy pixels in the level2.evt file, extra rows are filled as -1
| Pixel properties | Quadrant properties | ||||||
|---|---|---|---|---|---|---|---|
| Quadrant | DetID | PixID | Counts | Sigma | Mean | Median | Sigma |
| A | 14 | 235 | 3002937 | 18639.57 | 808 | 790 | 161.1 |
| A | 0 | 226 | 7083 | 39.07 | 808 | 790 | 161.1 |
| A | 12 | 194 | 5852 | 31.43 | 808 | 790 | 161.1 |
| B | 12 | 111 | 19032 | 115.07 | 832 | 811 | 158.3 |
| B | 11 | 111 | 16706 | 100.38 | 832 | 811 | 158.3 |
| B | 14 | 111 | 14198 | 84.55 | 832 | 811 | 158.3 |
| C | 14 | 238 | 124176 | 673.97 | 787 | 794 | 183.1 |
| C | 3 | 233 | 54511 | 293.43 | 787 | 794 | 183.1 |
| C | 7 | 220 | 8920 | 44.39 | 787 | 794 | 183.1 |
| D | 11 | 176 | 2359909 | 12553.83 | 778 | 755 | 187.9 |
| D | 5 | 222 | 419210 | 2226.73 | 778 | 755 | 187.9 |
| D | 10 | 70 | 184291 | 976.65 | 778 | 755 | 187.9 |
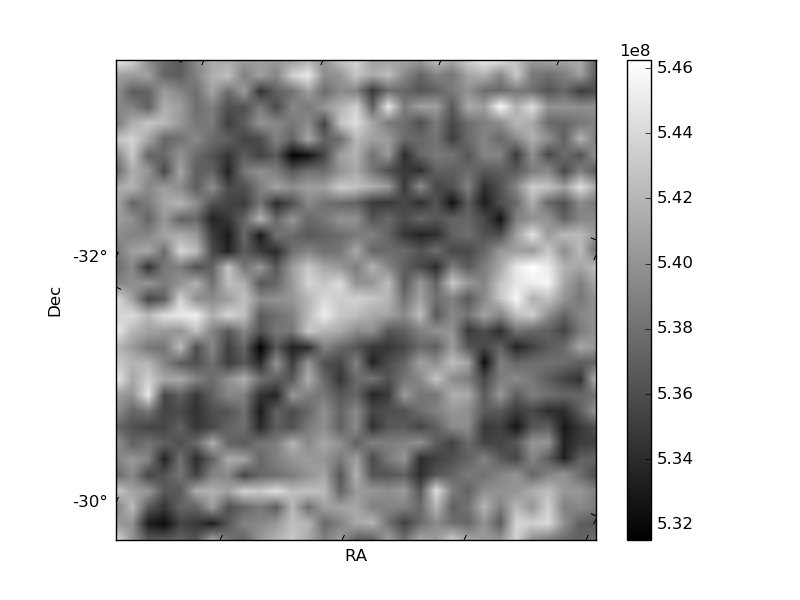
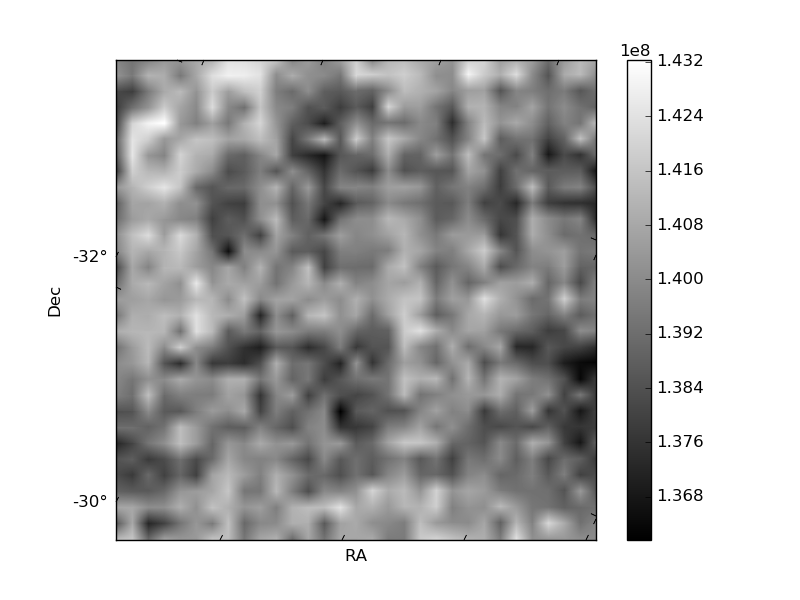
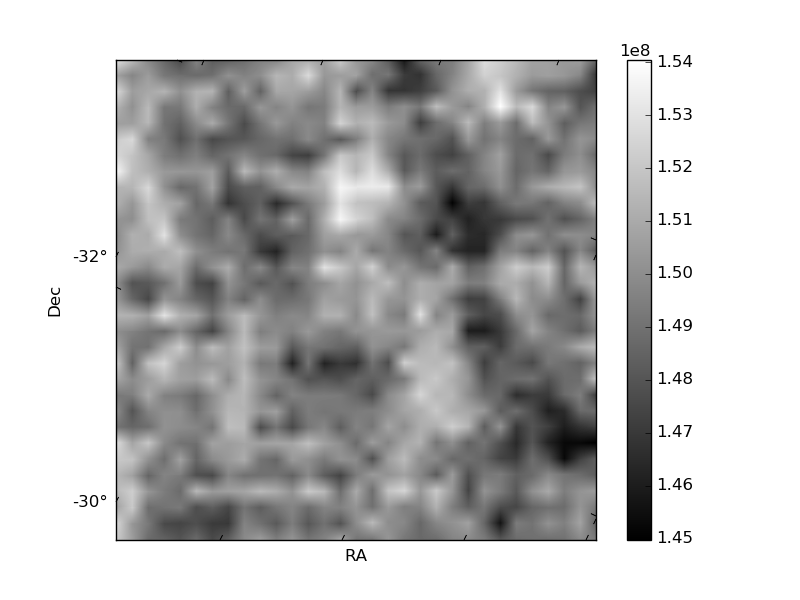
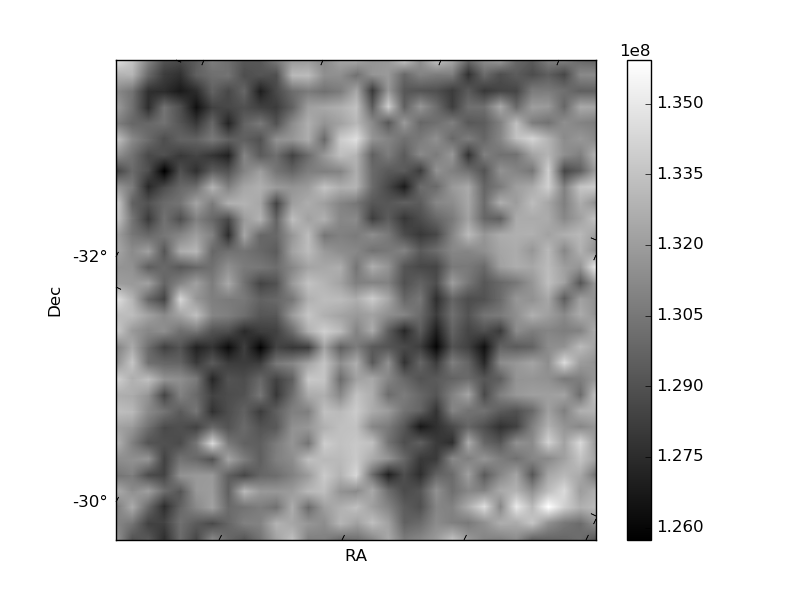
Histogram calculated using DETX and DETY for each event in the final _common_clean file
| Quadrant A | 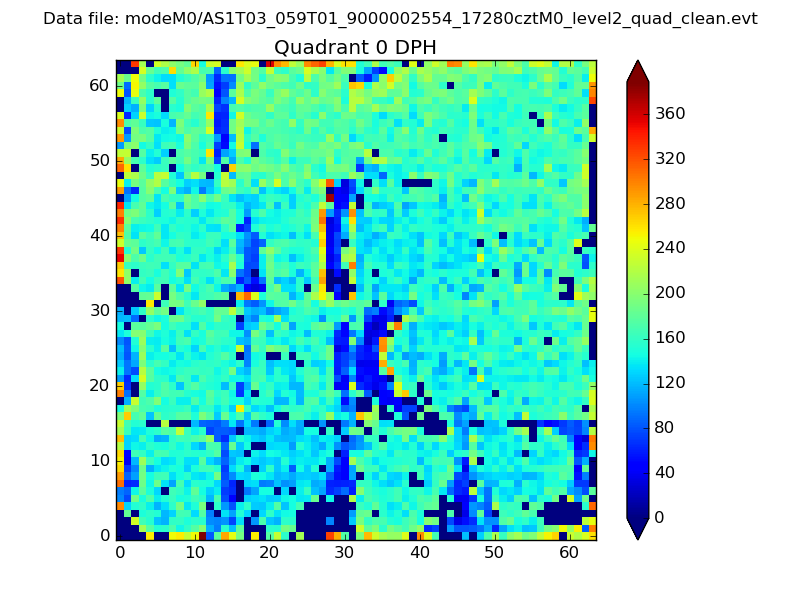 |
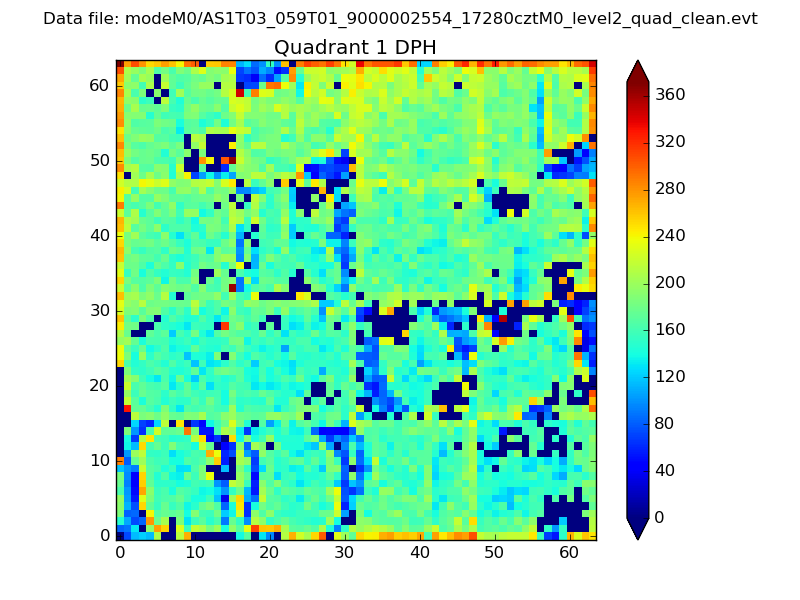 |
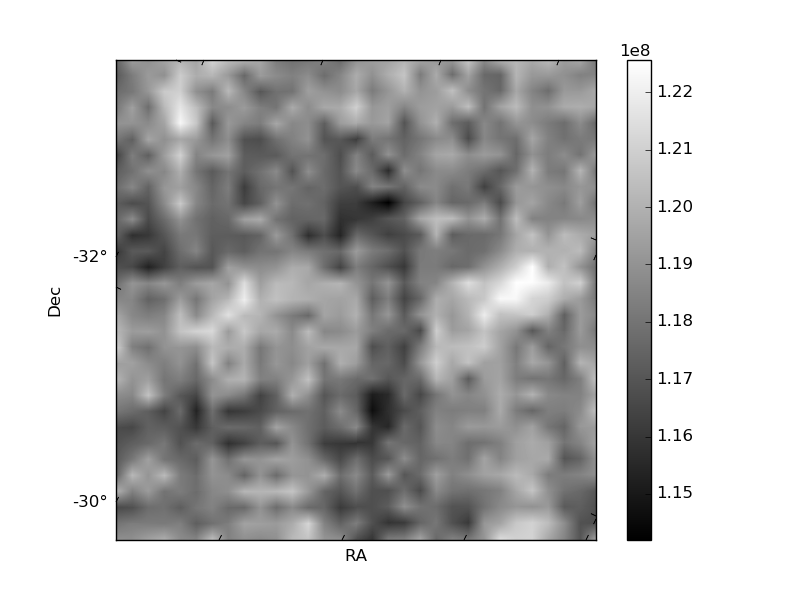
Quadrant B |
|---|---|---|---|
| Quadrant D | 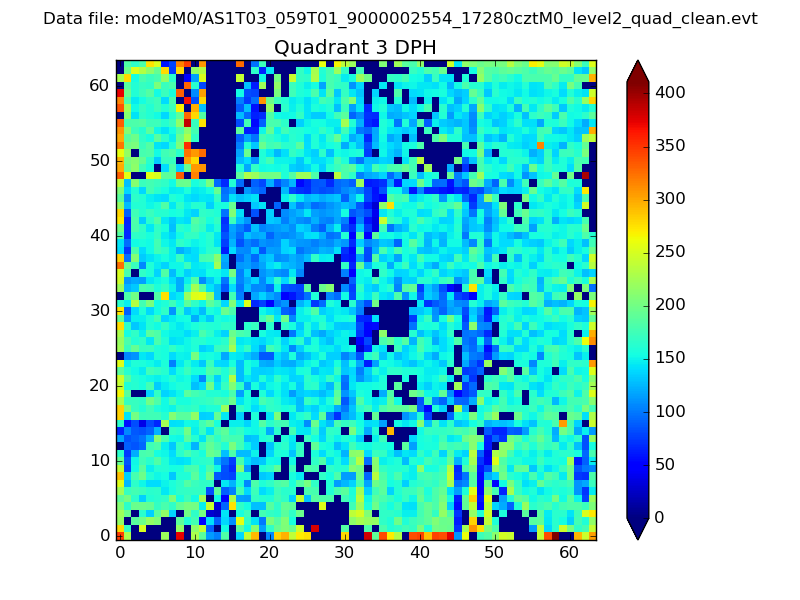 |
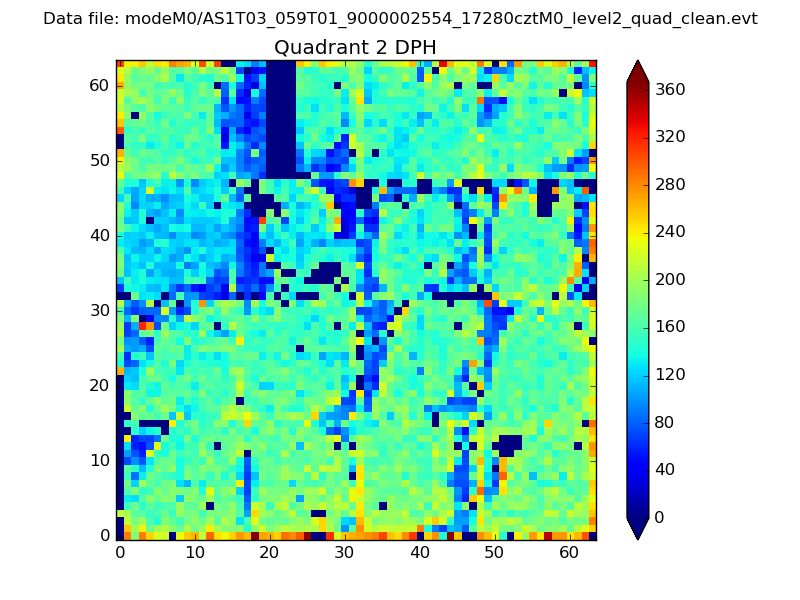 |
Quadrant C |
| Plot type | Count rate plots | Images |
|---|---|---|
| Comparison with Poisson distribution Blue bars denote a histogram of data divided into 1 sec bins. Red curve is a Poisson curve with rate = median count rate of data. |
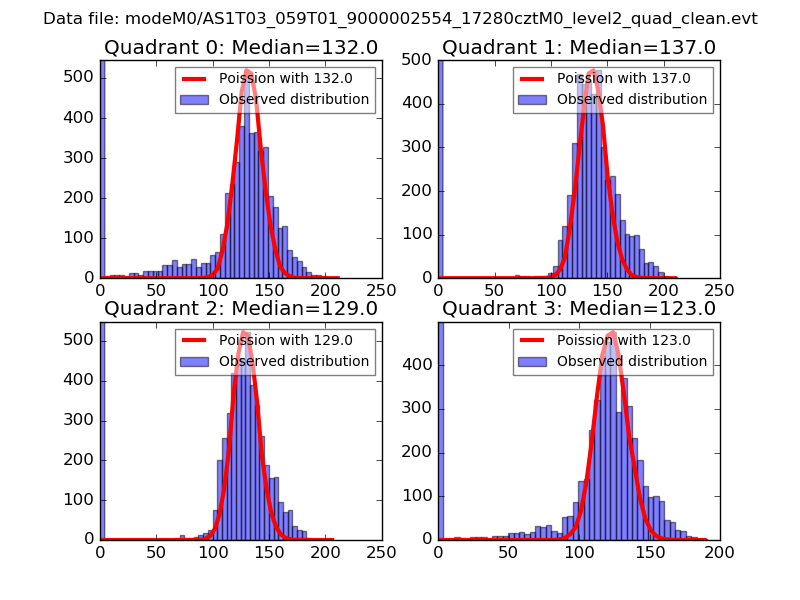 |
 |
| Quadrant-wise count rates Data is divided into 100 sec bins |
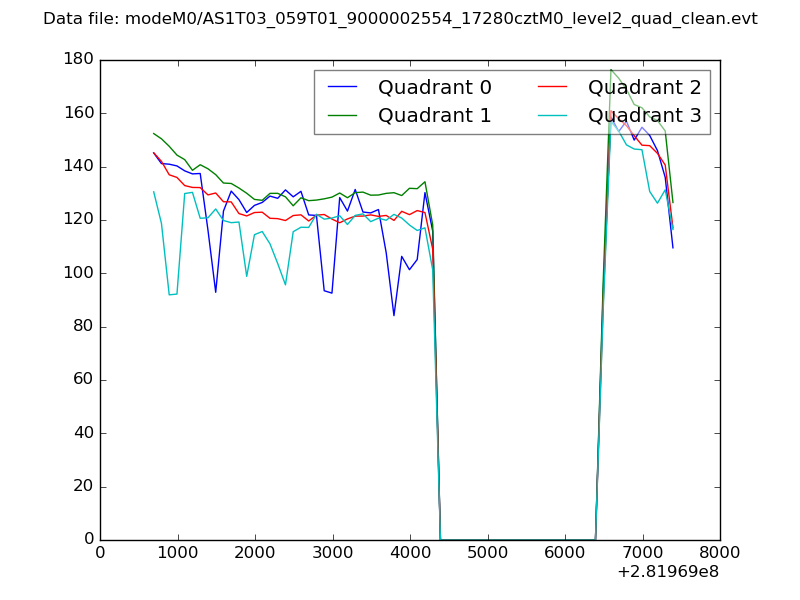 |
|
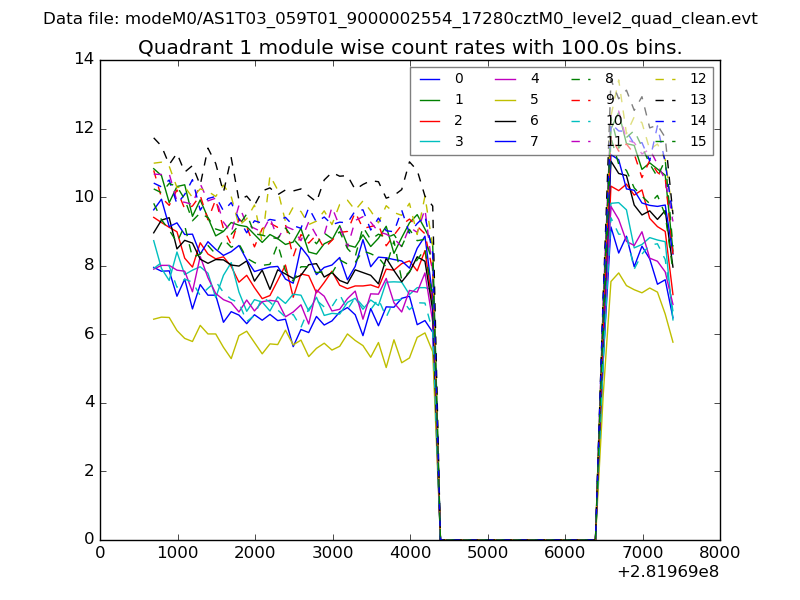
| Module-wise count rates for Quadrant A Data is divided into 100 sec bins |
 |
 |
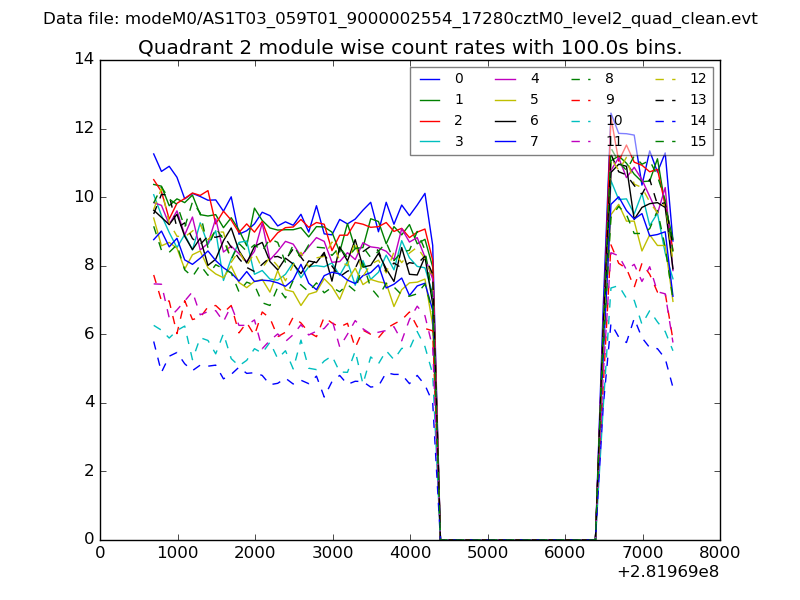
| Module-wise count rates for Quadrant B Data is divided into 100 sec bins |
 |
 |
| Module-wise count rates for Quadrant C Data is divided into 100 sec bins |
 |
 |
| Module-wise count rates for Quadrant D Data is divided into 100 sec bins |
 |
 |
| Parameter | Plot |
|---|---|
| CZT HV Monitor | 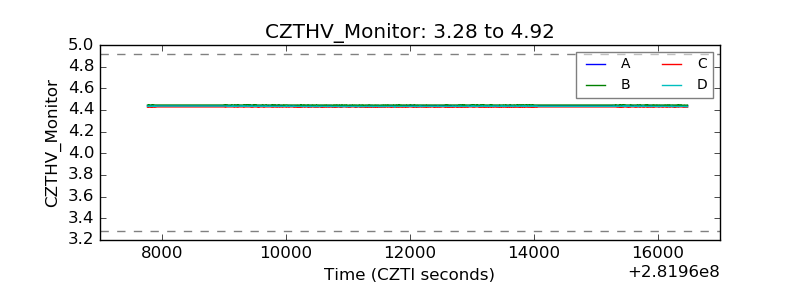 |
| D_VDD | 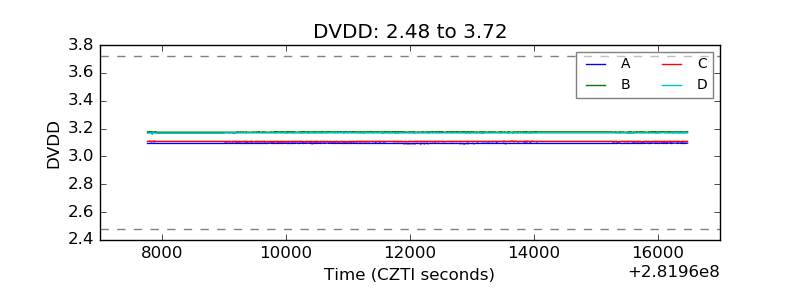 |
| Temperature 1 | 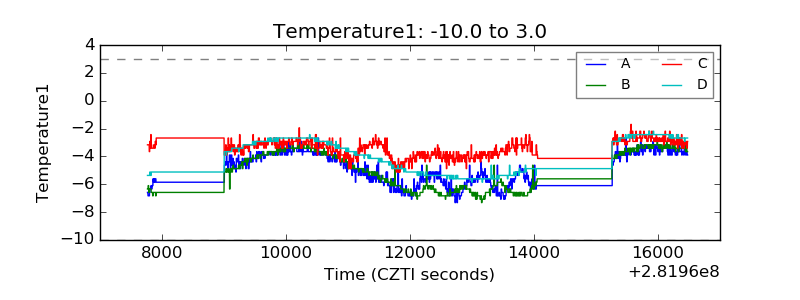 |
| Veto HV Monitor | 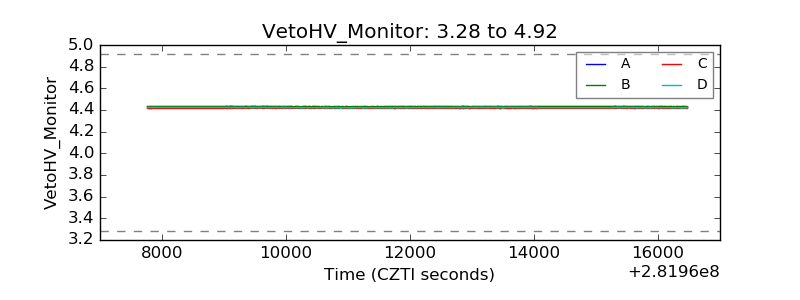 |
| Veto LLD | 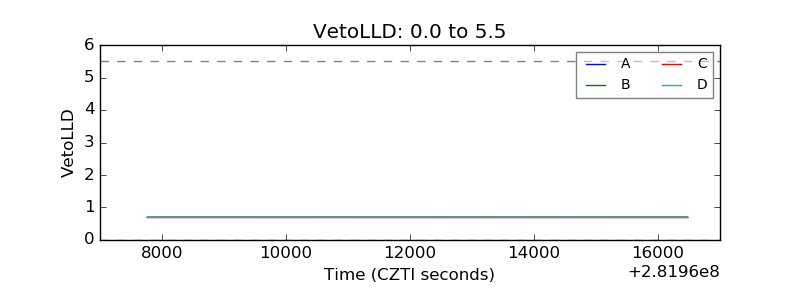 |
| Alpha Counter | 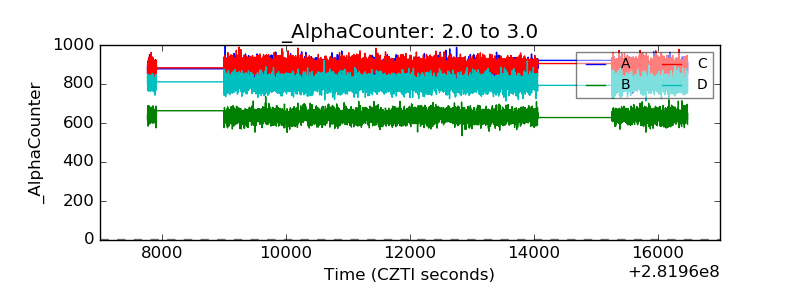 |
| _CPM_Rate | 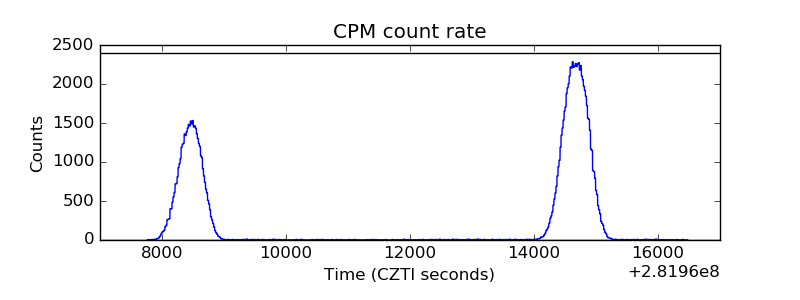 |
| CZT Counter | 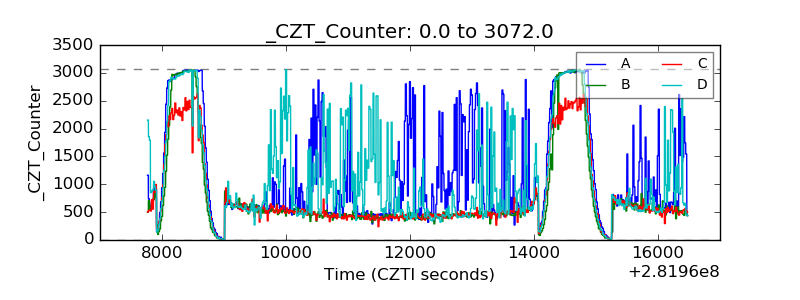 |
| +2.5 Volts monitor | 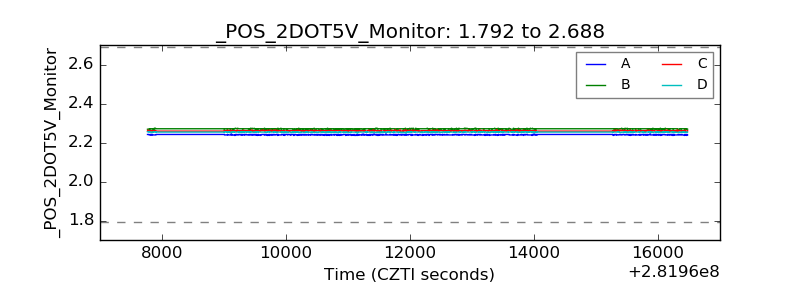 |
| +5 Volts monitor |  |
| _ROLL_ROT |  |
| _Roll_DEC | 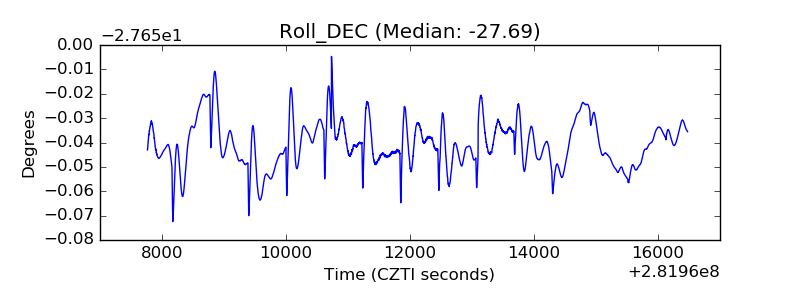 |
| _Roll_RA | 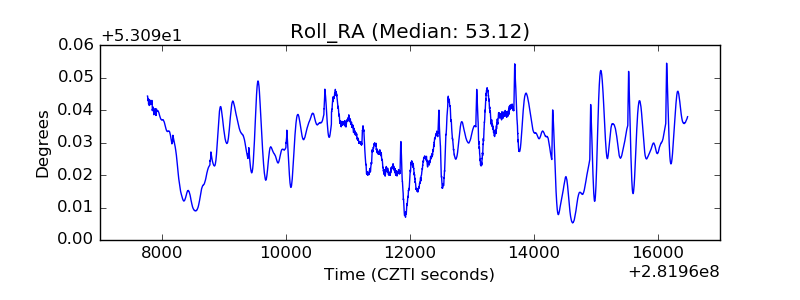 |
| Veto Counter | 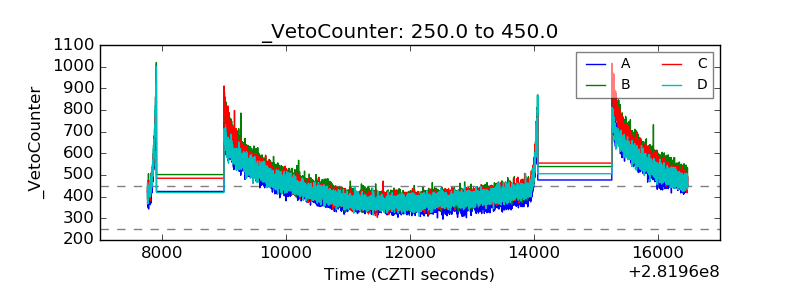 |