| Param | Original file | Final file |
|---|---|---|
| Filename | modeM0/AS1T03_059T01_9000002554_17281cztM0_level2.evt | modeM0/AS1T03_059T01_9000002554_17281cztM0_level2_quad_clean.evt |
| Size (bytes) | 802,716,480 | 108,417,600 |
| Size | 765.5 MB | 103.4 MB |
| Events in quadrant A | 7,649,021 | 714,482 |
| Events in quadrant B | 3,325,513 | 811,667 |
| Events in quadrant C | 3,296,585 | 747,552 |
| Events in quadrant D | 9,597,014 | 551,517 |
| Mode M9 | |||
|---|---|---|---|
| Quadrant | BADHDUFLAG | Total packets | Discarded packets |
| A | 0 | 13 | 0 |
| B | 0 | 13 | 0 |
| C | 0 | 13 | 0 |
| D | 0 | 13 | 0 |
| Mode SS | |||
|---|---|---|---|
| Quadrant | BADHDUFLAG | Total packets | Discarded packets |
| A | 0 | 132 | 0 |
| B | 0 | 132 | 0 |
| C | 0 | 132 | 0 |
| D | 0 | 132 | 0 |
| Mode M0 | |||
|---|---|---|---|
| Quadrant | BADHDUFLAG | Total packets | Discarded packets |
| A | 0 | 27290 | 1 |
| B | 0 | 14070 | 1 |
| C | 0 | 14001 | 1 |
| D | 0 | 32925 | 8 |
| Quadrant | Total seconds | Saturated seconds | Saturation percentage |
|---|---|---|---|
| A | 6557 | 1439 | 21.946012% |
| B | 6557 | 88 | 1.342077% |
| C | 6558 | 108 | 1.646844% |
| D | 6557 | 2120 | 32.331859% |
Noise dominated data is calculated using 1-second bins in cleaned event files. If a bin has >2000 counts, and if more than 50% of those come from <1% of pixels, then it is considered to be noise-dominated and hence unusable.
| Quadrant | # 1 sec bins | Bins with >0 counts | Bins with >2000 counts | High rate bins dominated by noise | Noise dominated (total time) | Noise dominated (detector-on time) | Marked lightcurve |
|---|---|---|---|---|---|---|---|
| A | 7812 | 6557 | 1124 | 1124 | 14.39% | 17.14% | 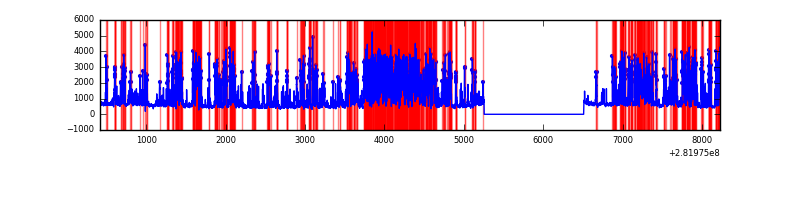 |
| B | 7812 | 6557 | 0 | 0 | 0.00% | 0.00% | 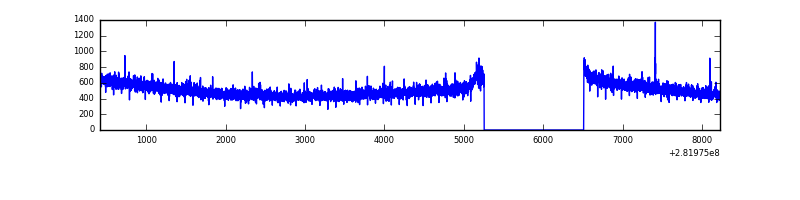 |
| C | 7813 | 6559 | 0 | 0 | 0.00% | 0.00% | 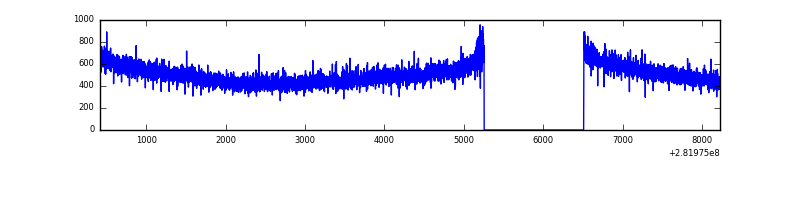 |
| D | 7811 | 6557 | 2100 | 2100 | 26.89% | 32.03% | 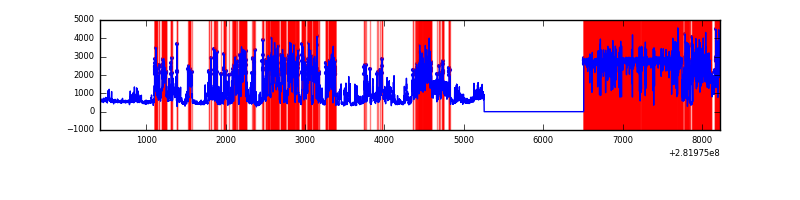 |
Top three noisy pixels from each quadrant. If the there are fewer than three noisy pixels in the level2.evt file, extra rows are filled as -1
| Pixel properties | Quadrant properties | ||||||
|---|---|---|---|---|---|---|---|
| Quadrant | DetID | PixID | Counts | Sigma | Mean | Median | Sigma |
| A | 14 | 235 | 4652984 | 29690.42 | 780 | 765 | 156.7 |
| A | 0 | 226 | 6896 | 39.12 | 780 | 765 | 156.7 |
| A | 12 | 194 | 5625 | 31.01 | 780 | 765 | 156.7 |
| B | 12 | 111 | 18605 | 111.19 | 849 | 831 | 159.9 |
| B | 11 | 111 | 16549 | 98.33 | 849 | 831 | 159.9 |
| B | 14 | 111 | 13978 | 82.24 | 849 | 831 | 159.9 |
| C | 14 | 238 | 125544 | 673.12 | 796 | 800 | 185.3 |
| C | 3 | 233 | 67251 | 358.57 | 796 | 800 | 185.3 |
| C | 13 | 61 | 5731 | 26.61 | 796 | 800 | 185.3 |
| D | 11 | 176 | 6982350 | 43211.43 | 668 | 649 | 161.6 |
| D | 2 | 234 | 22003 | 132.17 | 668 | 649 | 161.6 |
| D | 10 | 66 | 21595 | 129.64 | 668 | 649 | 161.6 |
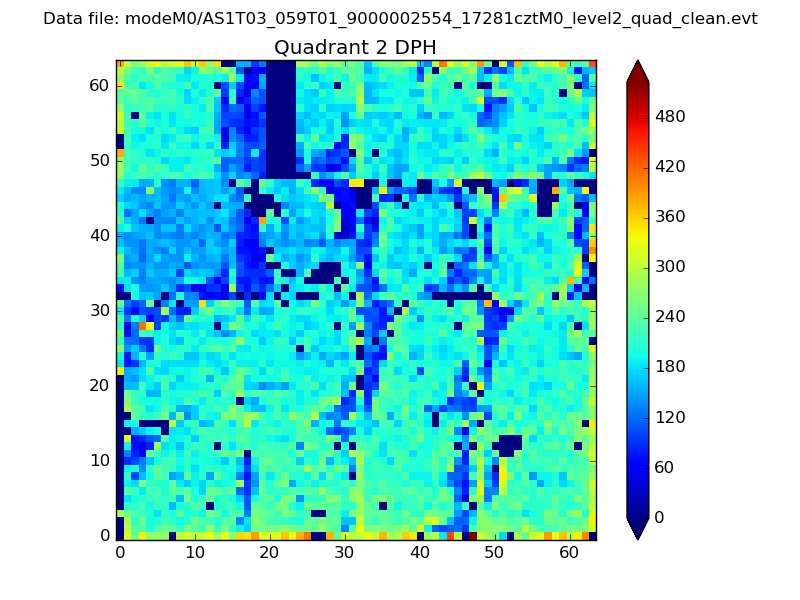
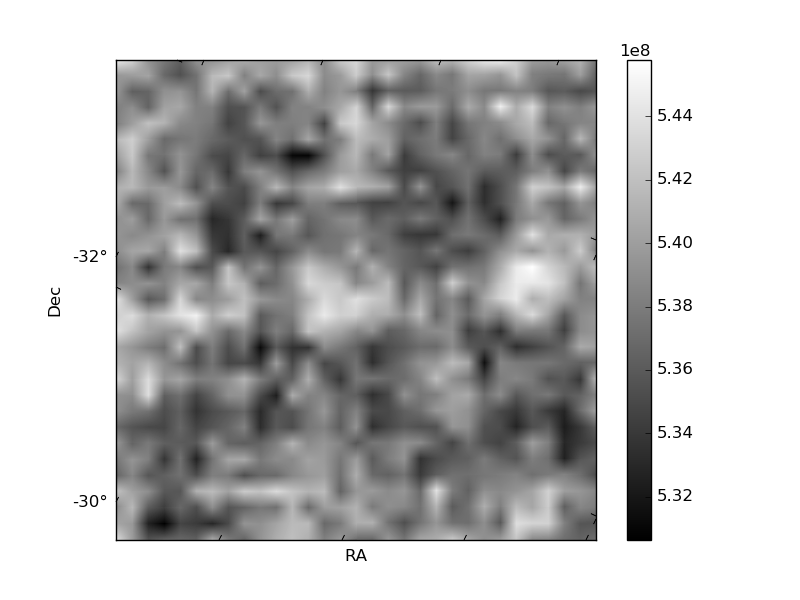
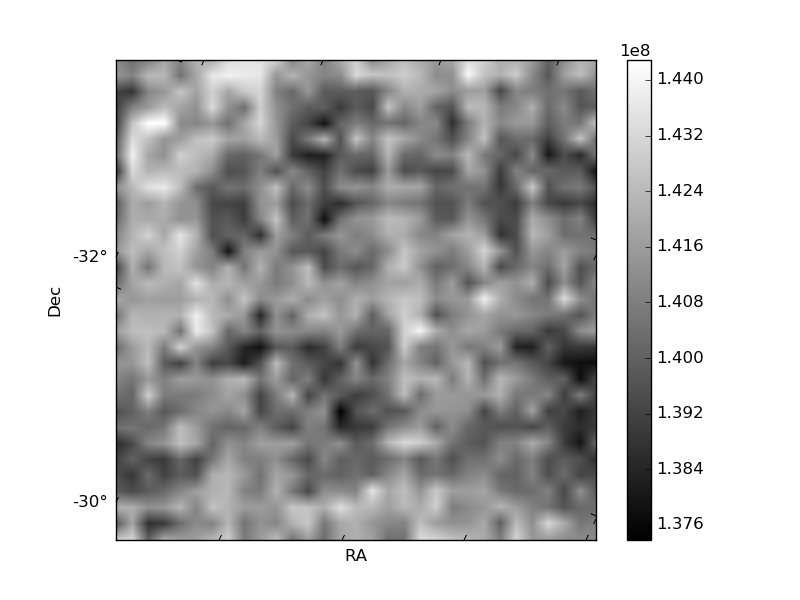
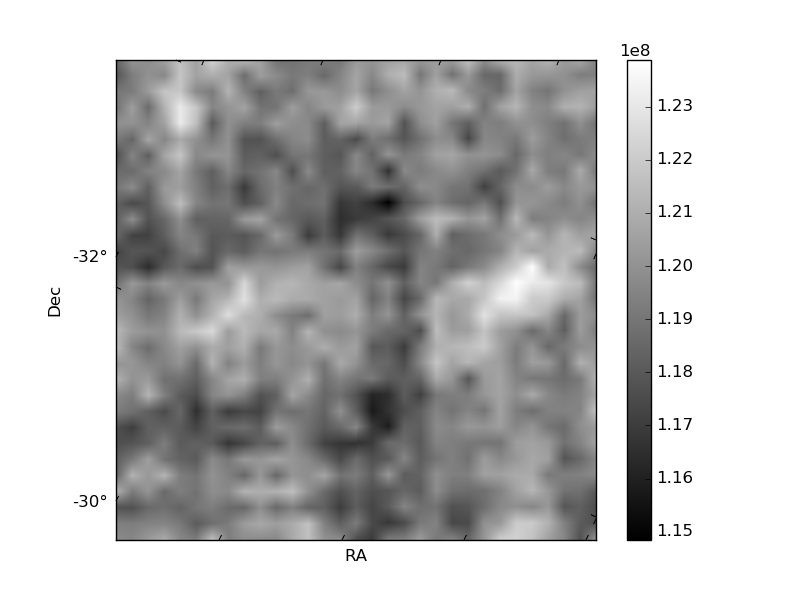
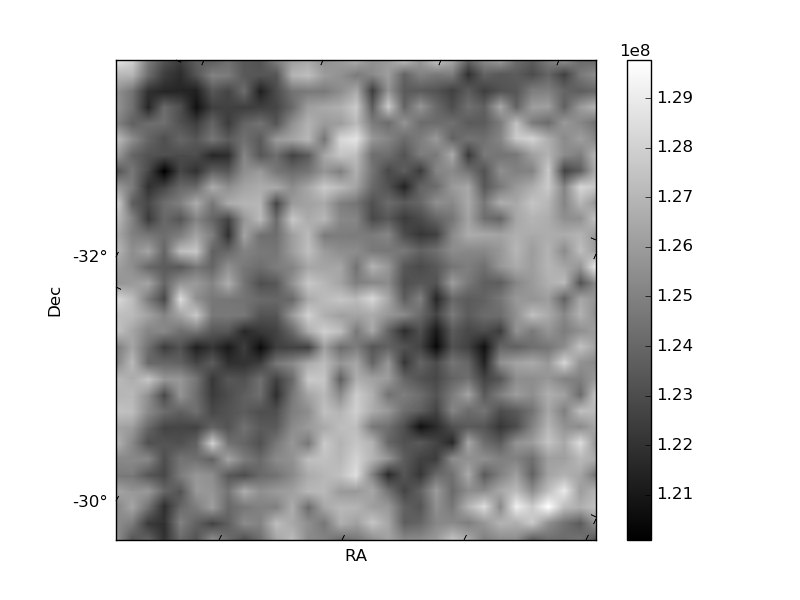
Histogram calculated using DETX and DETY for each event in the final _common_clean file
| Quadrant A | 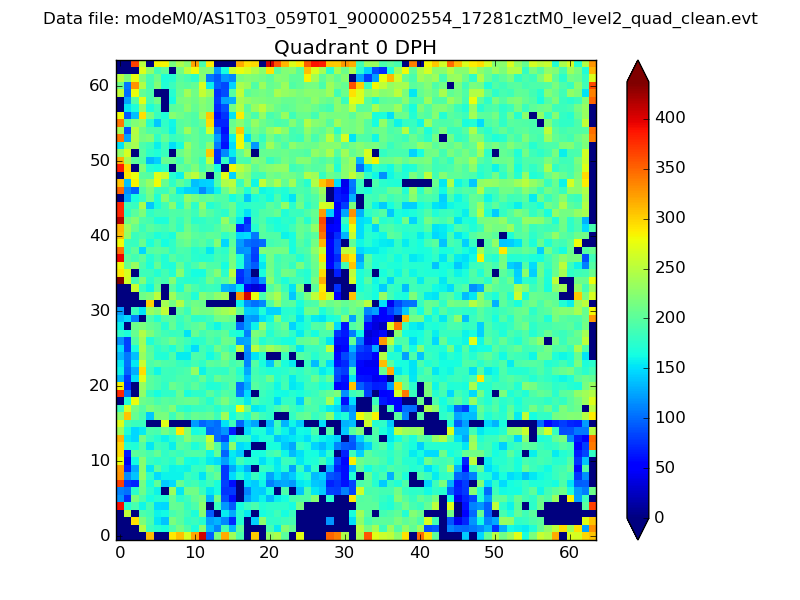 |
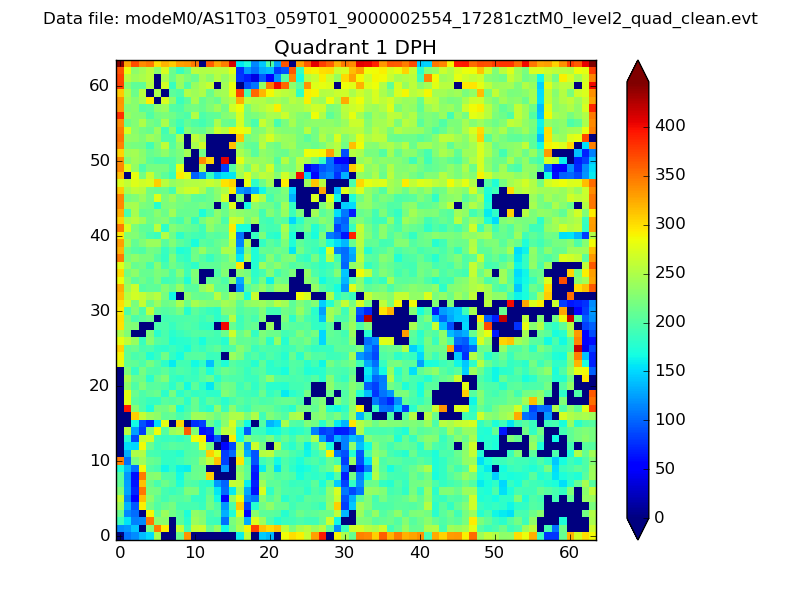 |
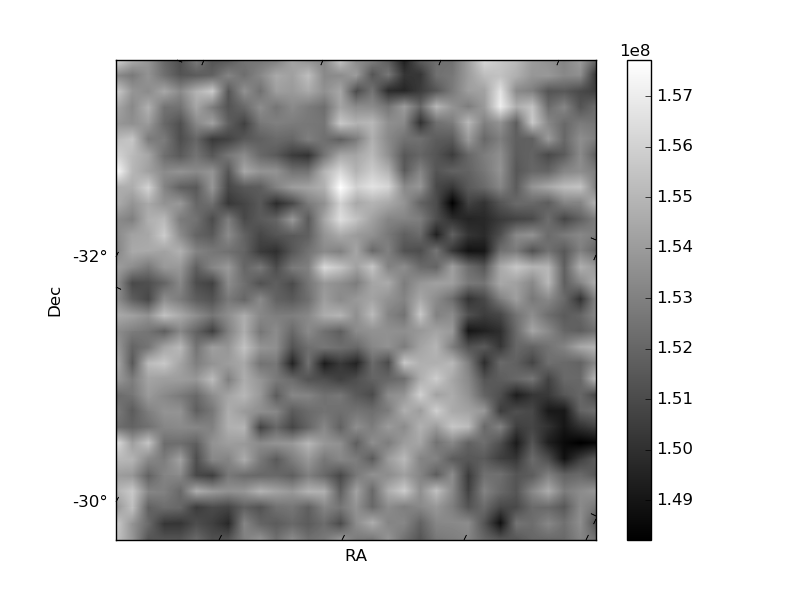
Quadrant B |
|---|---|---|---|
| Quadrant D | 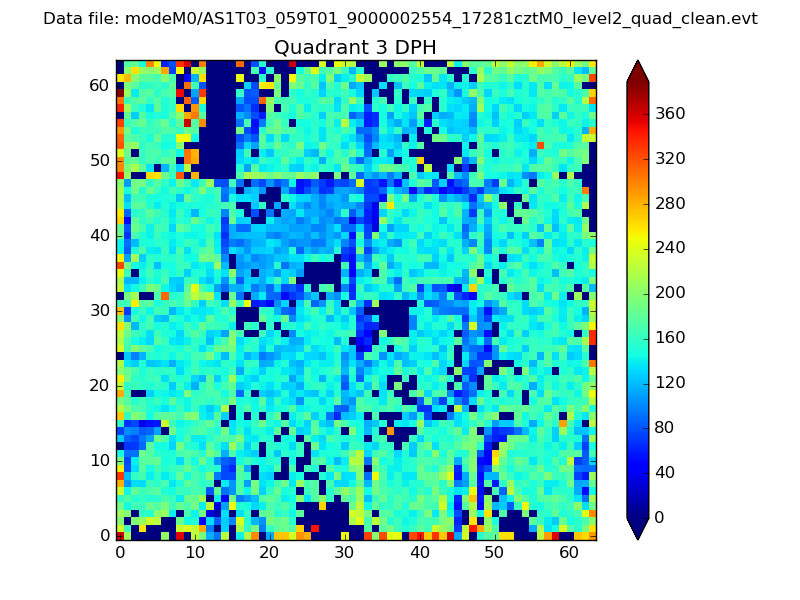 |
 |
Quadrant C |
| Plot type | Count rate plots | Images |
|---|---|---|
| Comparison with Poisson distribution Blue bars denote a histogram of data divided into 1 sec bins. Red curve is a Poisson curve with rate = median count rate of data. |
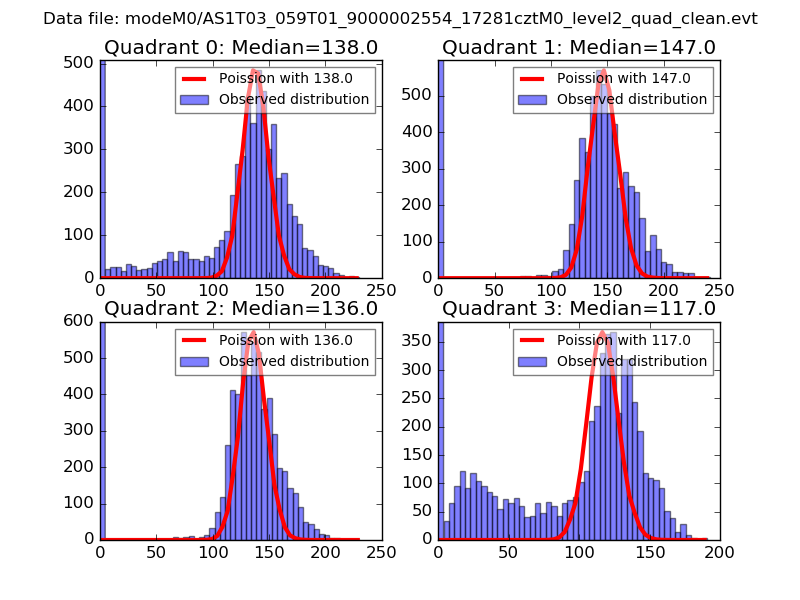 |
 |
| Quadrant-wise count rates Data is divided into 100 sec bins |
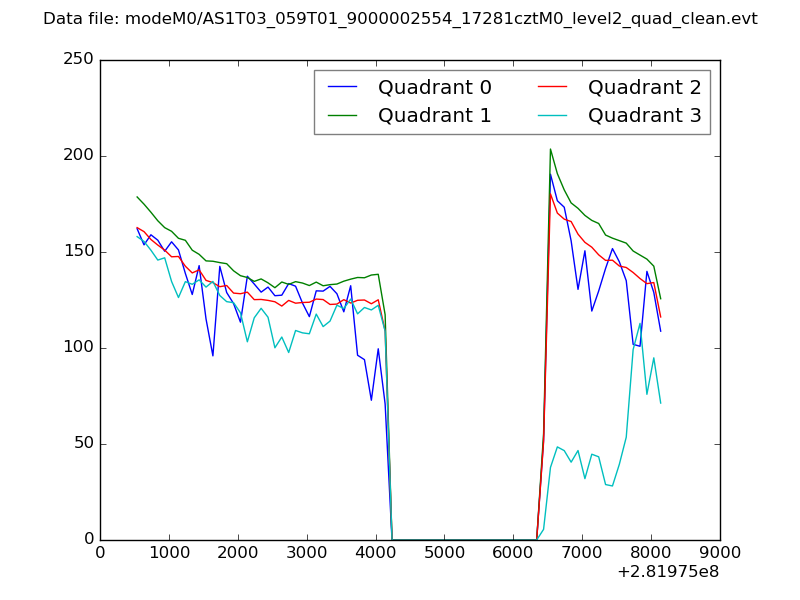 |
|
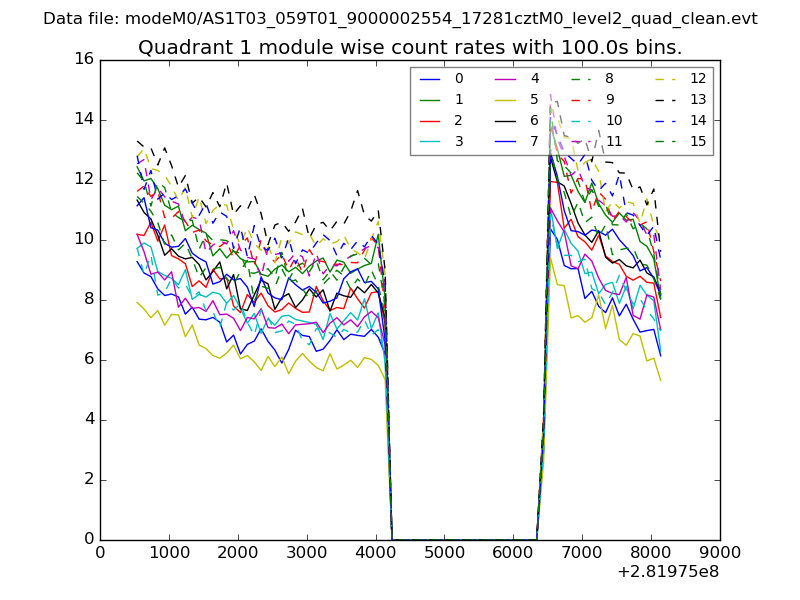
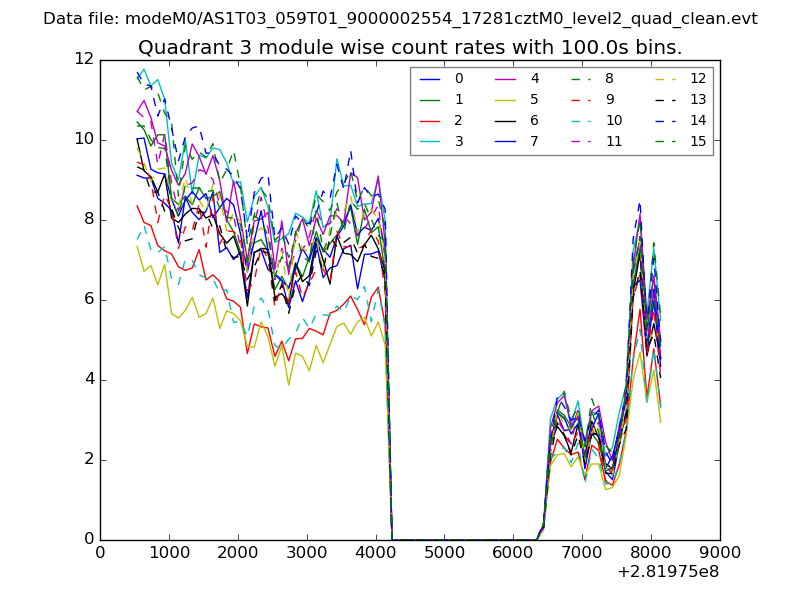
| Module-wise count rates for Quadrant A Data is divided into 100 sec bins |
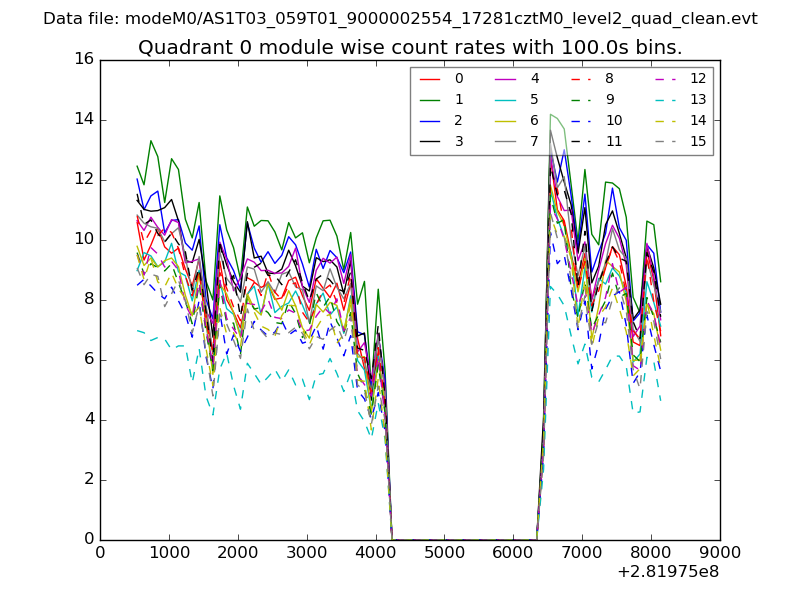 |
 |
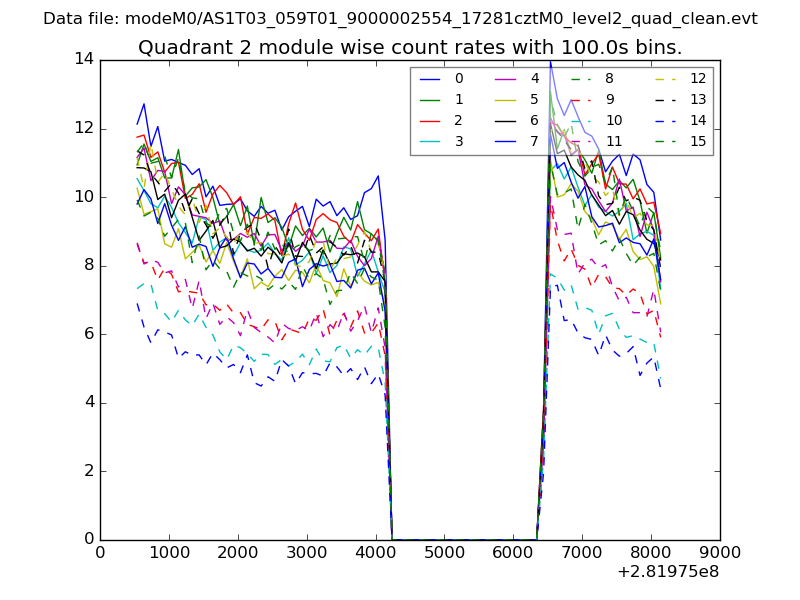
| Module-wise count rates for Quadrant B Data is divided into 100 sec bins |
 |
 |
| Module-wise count rates for Quadrant C Data is divided into 100 sec bins |
 |
 |
| Module-wise count rates for Quadrant D Data is divided into 100 sec bins |
 |
 |
| Parameter | Plot |
|---|---|
| CZT HV Monitor | 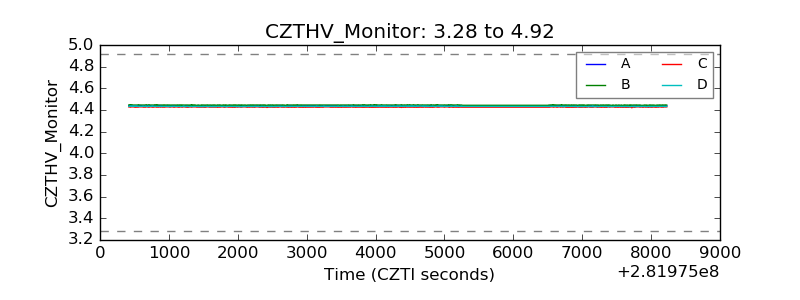 |
| D_VDD | 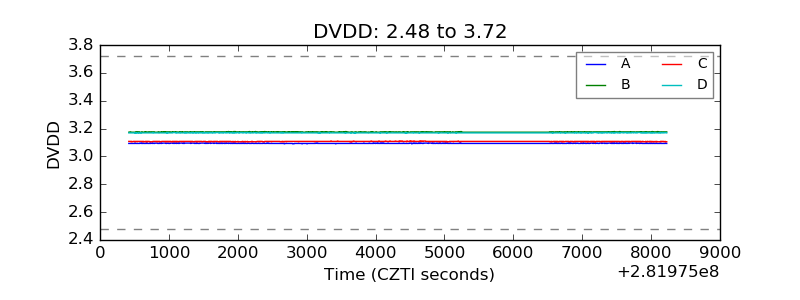 |
| Temperature 1 | 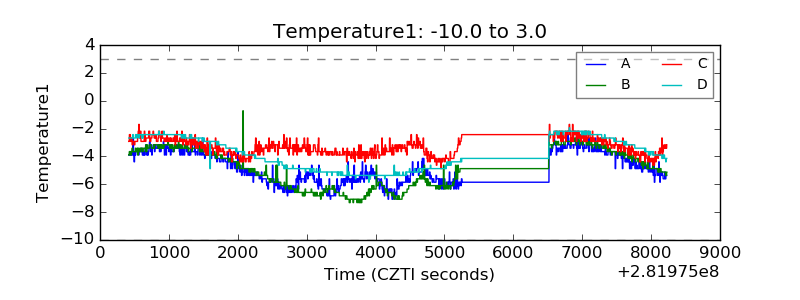 |
| Veto HV Monitor | 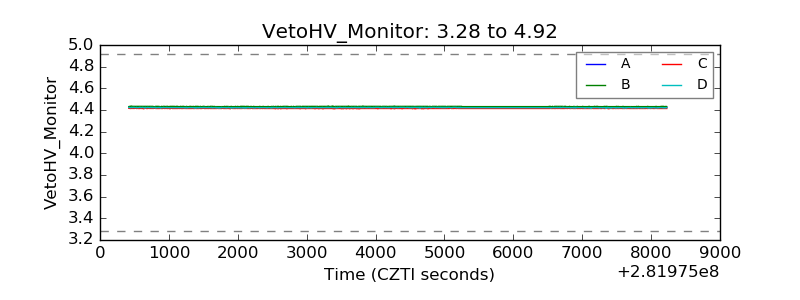 |
| Veto LLD | 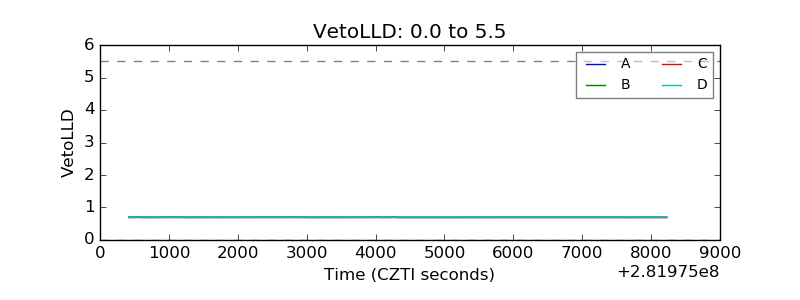 |
| Alpha Counter | 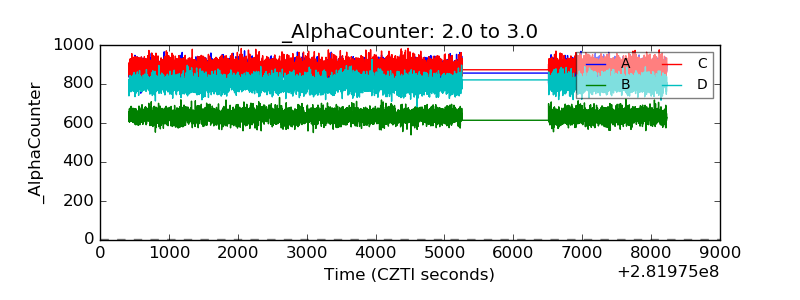 |
| _CPM_Rate | 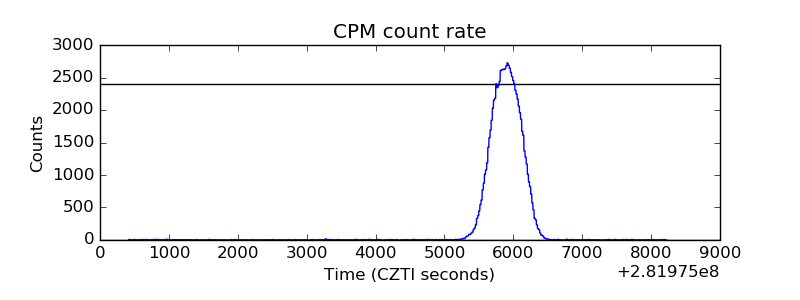 |
| CZT Counter | 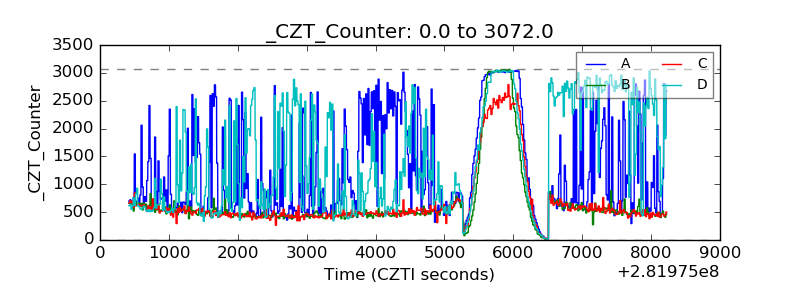 |
| +2.5 Volts monitor |  |
| +5 Volts monitor |  |
| _ROLL_ROT | 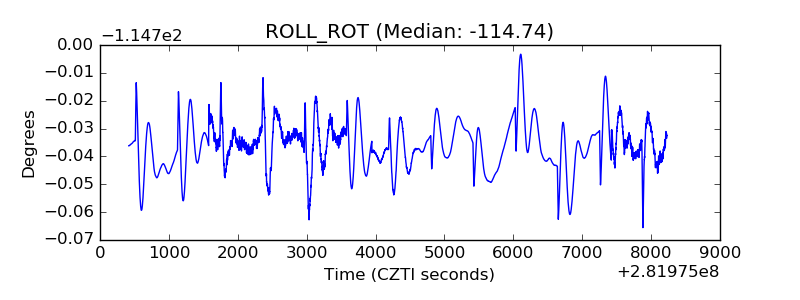 |
| _Roll_DEC | 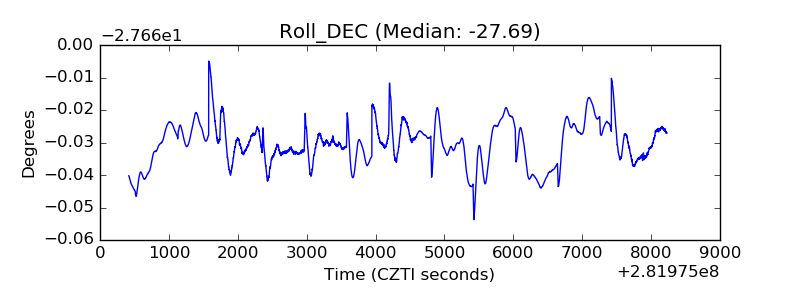 |
| _Roll_RA | 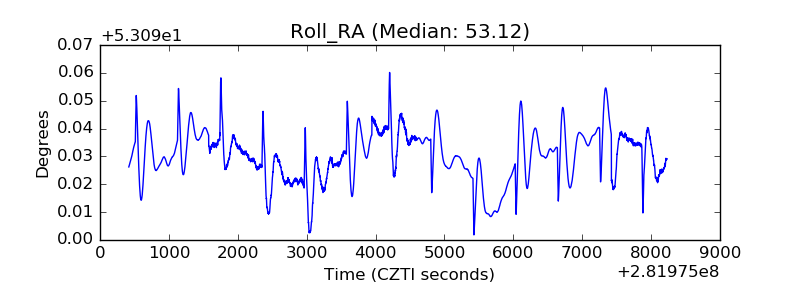 |
| Veto Counter | 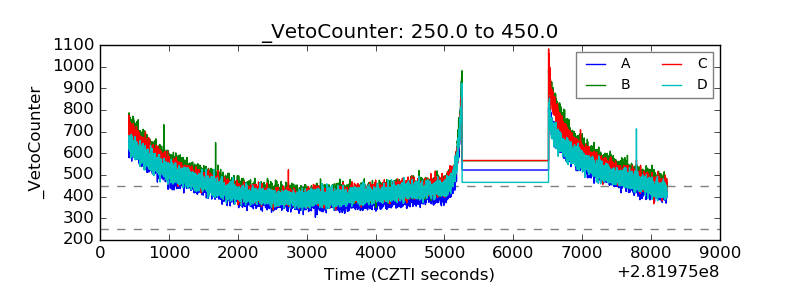 |