| Param | Original file | Final file |
|---|---|---|
| Filename | modeM0/AS1T03_059T01_9000002554_17283cztM0_level2.evt | modeM0/AS1T03_059T01_9000002554_17283cztM0_level2_quad_clean.evt |
| Size (bytes) | 531,198,720 | 100,710,720 |
| Size | 506.6 MB | 96.0 MB |
| Events in quadrant A | 3,945,337 | 668,957 |
| Events in quadrant B | 3,263,510 | 695,360 |
| Events in quadrant C | 3,234,181 | 642,191 |
| Events in quadrant D | 5,199,798 | 586,330 |
| Mode M9 | |||
|---|---|---|---|
| Quadrant | BADHDUFLAG | Total packets | Discarded packets |
| A | 0 | 13 | 0 |
| B | 0 | 14 | 0 |
| C | 0 | 14 | 0 |
| D | 0 | 14 | 0 |
| Mode SS | |||
|---|---|---|---|
| Quadrant | BADHDUFLAG | Total packets | Discarded packets |
| A | 0 | 132 | 0 |
| B | 0 | 132 | 0 |
| C | 0 | 132 | 0 |
| D | 0 | 132 | 0 |
| Mode M0 | |||
|---|---|---|---|
| Quadrant | BADHDUFLAG | Total packets | Discarded packets |
| A | 0 | 16033 | 2 |
| B | 0 | 13825 | 2 |
| C | 0 | 13807 | 2 |
| D | 0 | 20023 | 6 |
| Quadrant | Total seconds | Saturated seconds | Saturation percentage |
|---|---|---|---|
| A | 6555 | 247 | 3.768116% |
| B | 6555 | 87 | 1.327231% |
| C | 6555 | 85 | 1.296720% |
| D | 6554 | 703 | 10.726274% |
Noise dominated data is calculated using 1-second bins in cleaned event files. If a bin has >2000 counts, and if more than 50% of those come from <1% of pixels, then it is considered to be noise-dominated and hence unusable.
| Quadrant | # 1 sec bins | Bins with >0 counts | Bins with >2000 counts | High rate bins dominated by noise | Noise dominated (total time) | Noise dominated (detector-on time) | Marked lightcurve |
|---|---|---|---|---|---|---|---|
| A | 7830 | 6556 | 147 | 147 | 1.88% | 2.24% | 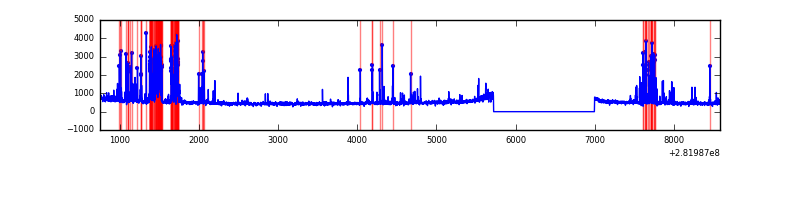 |
| B | 7830 | 6556 | 1 | 1 | 0.01% | 0.02% | 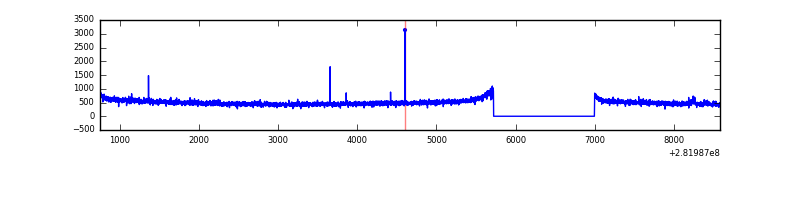 |
| C | 7830 | 6556 | 1 | 1 | 0.01% | 0.02% | 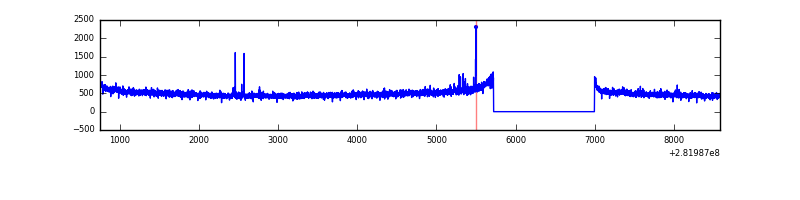 |
| D | 7829 | 6554 | 616 | 616 | 7.87% | 9.40% | 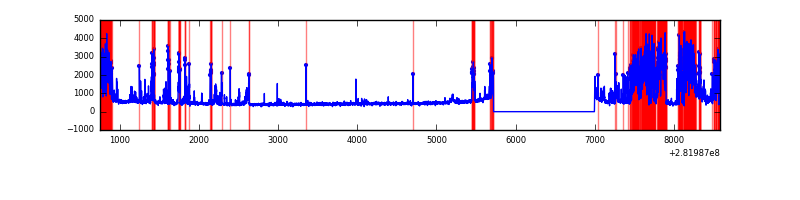 |
Top three noisy pixels from each quadrant. If the there are fewer than three noisy pixels in the level2.evt file, extra rows are filled as -1
| Pixel properties | Quadrant properties | ||||||
|---|---|---|---|---|---|---|---|
| Quadrant | DetID | PixID | Counts | Sigma | Mean | Median | Sigma |
| A | 14 | 235 | 801001 | 4854.99 | 818 | 802 | 164.8 |
| A | 0 | 226 | 7306 | 39.46 | 818 | 802 | 164.8 |
| A | 3 | 137 | 5922 | 31.06 | 818 | 802 | 164.8 |
| B | 12 | 111 | 18425 | 112.24 | 830 | 812 | 156.9 |
| B | 11 | 111 | 15872 | 95.97 | 830 | 812 | 156.9 |
| B | 14 | 111 | 14027 | 84.22 | 830 | 812 | 156.9 |
| C | 14 | 238 | 121230 | 661.48 | 781 | 788 | 182.1 |
| C | 3 | 233 | 44573 | 240.47 | 781 | 788 | 182.1 |
| C | 5 | 112 | 25363 | 134.97 | 781 | 788 | 182.1 |
| D | 11 | 176 | 1941672 | 10676.61 | 752 | 732 | 181.8 |
| D | 10 | 66 | 162107 | 887.68 | 752 | 732 | 181.8 |
| D | 10 | 70 | 157162 | 860.48 | 752 | 732 | 181.8 |
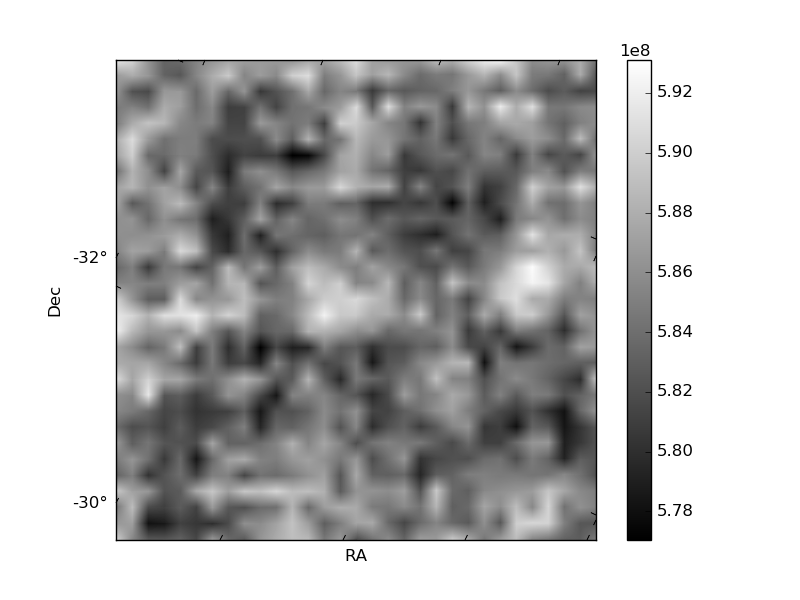
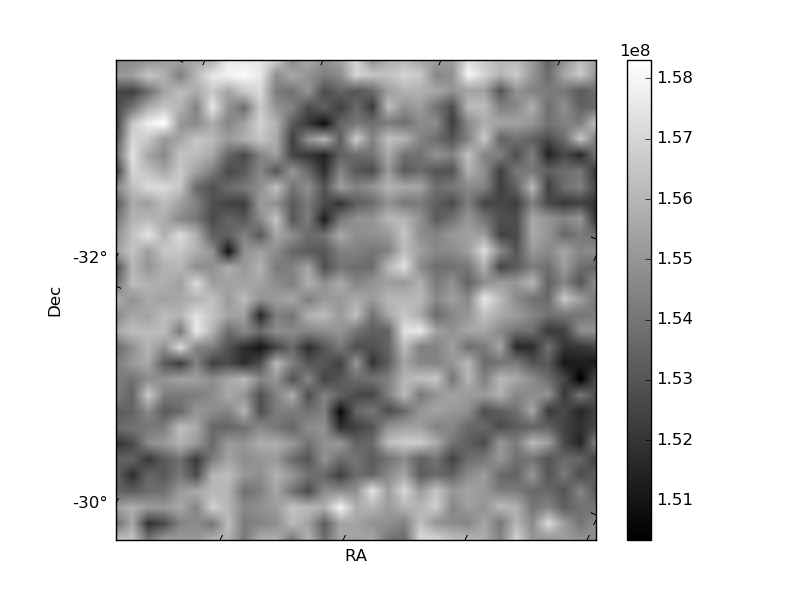
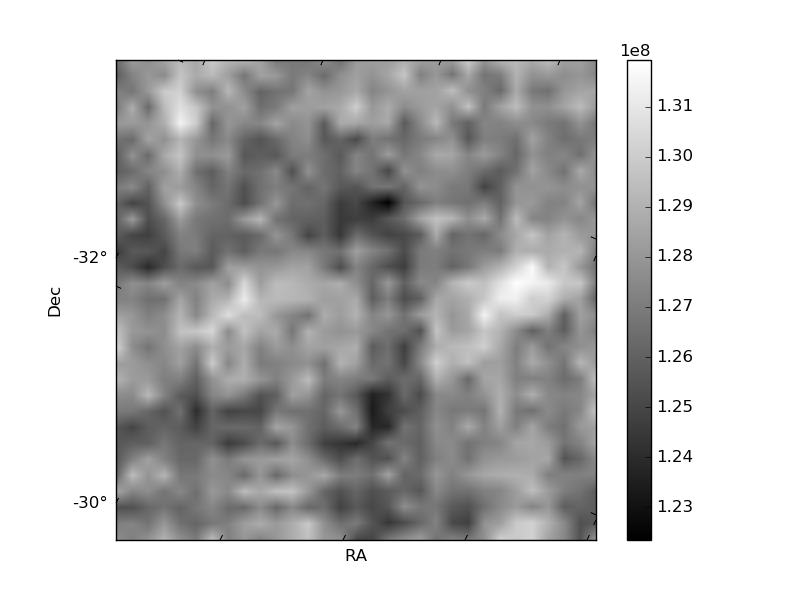
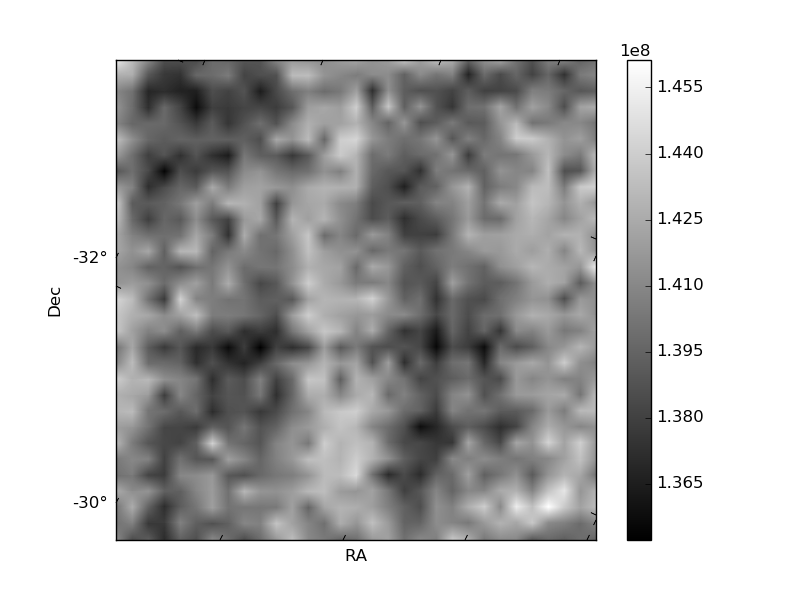
Histogram calculated using DETX and DETY for each event in the final _common_clean file
| Quadrant A | 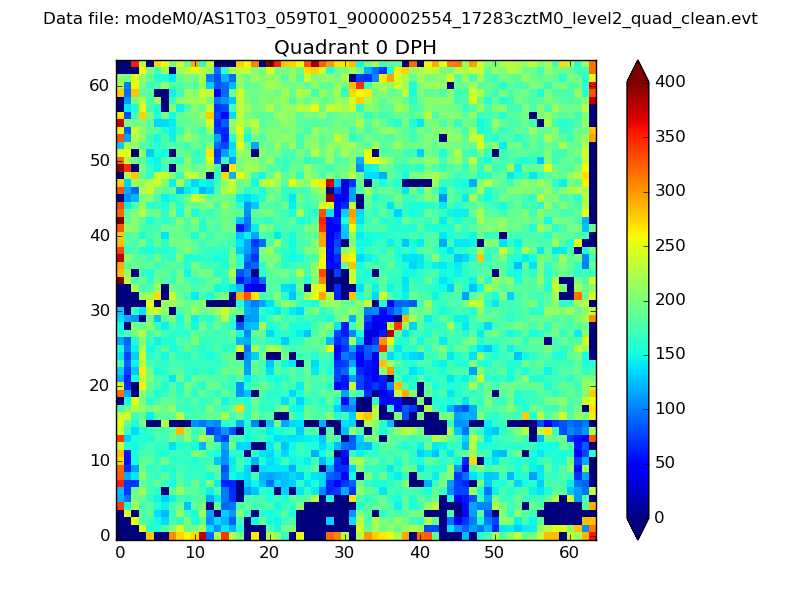 |
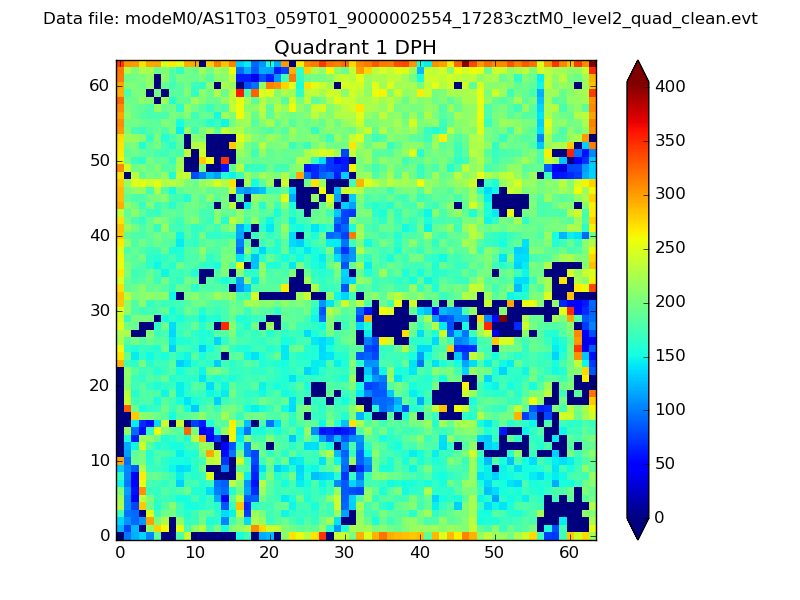 |
Quadrant B |
|---|---|---|---|
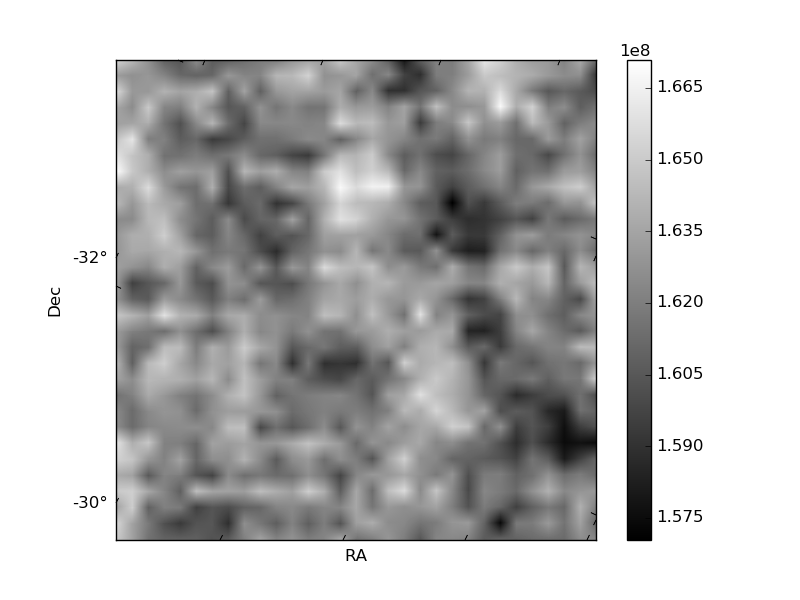
| Quadrant D | 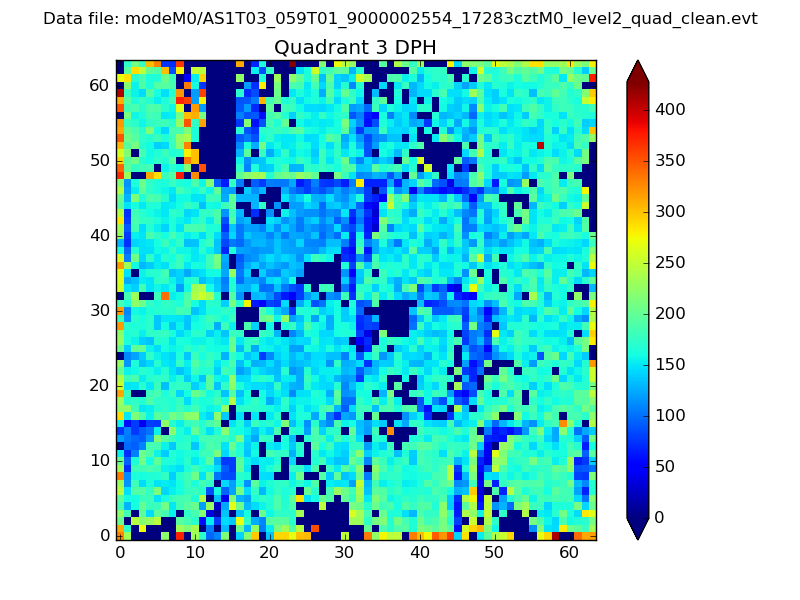 |
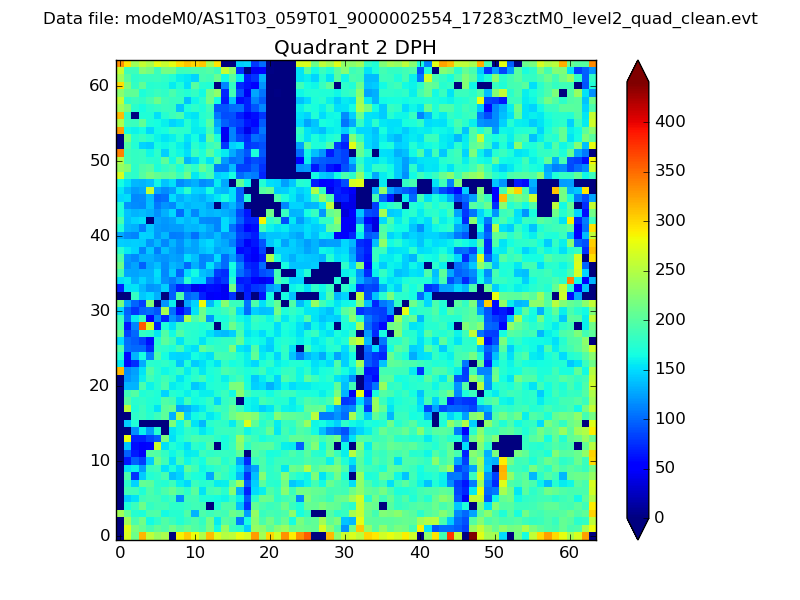 |
Quadrant C |
| Plot type | Count rate plots | Images |
|---|---|---|
| Comparison with Poisson distribution Blue bars denote a histogram of data divided into 1 sec bins. Red curve is a Poisson curve with rate = median count rate of data. |
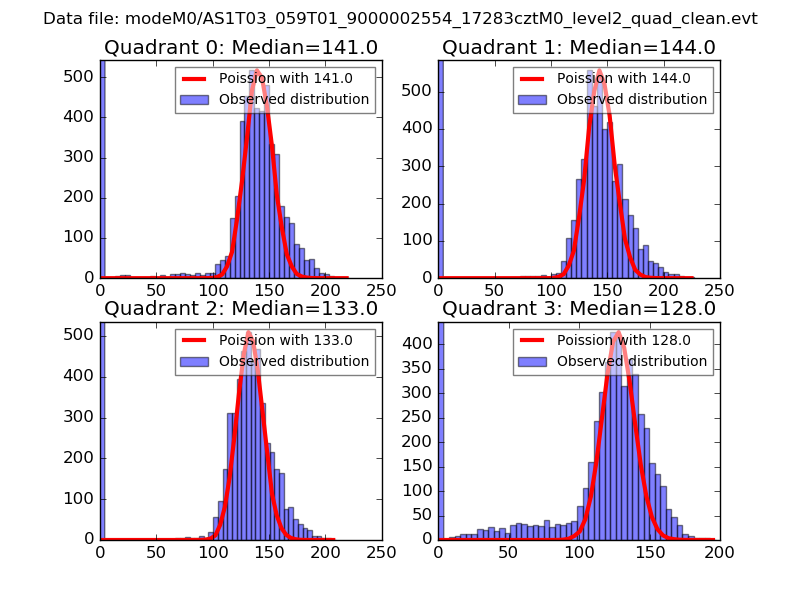 |
 |
| Quadrant-wise count rates Data is divided into 100 sec bins |
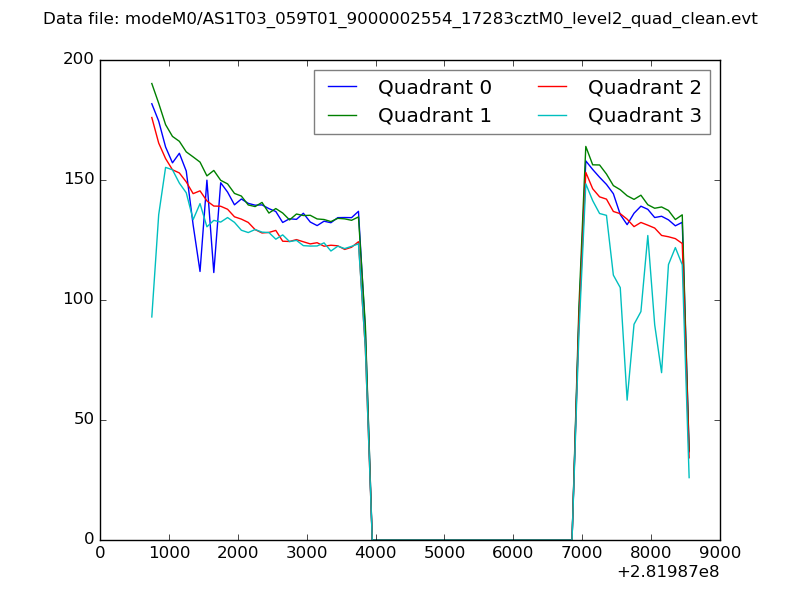 |
|
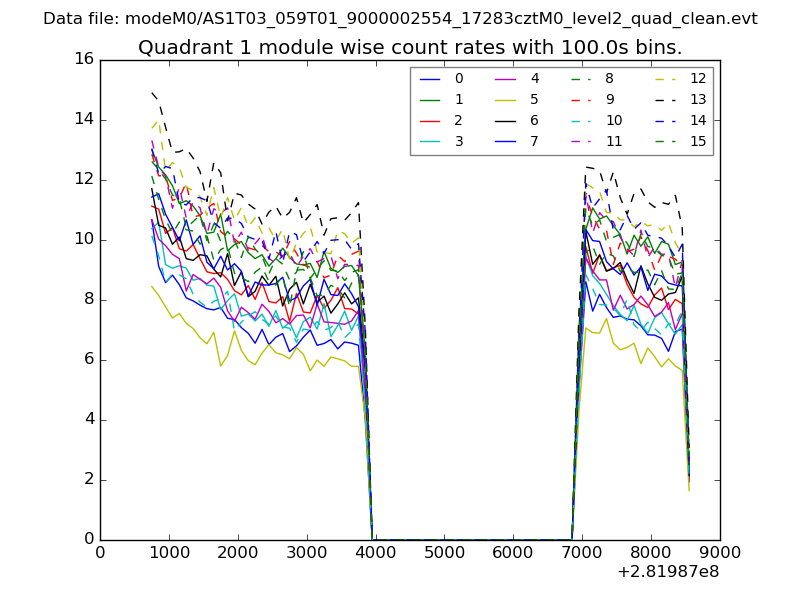
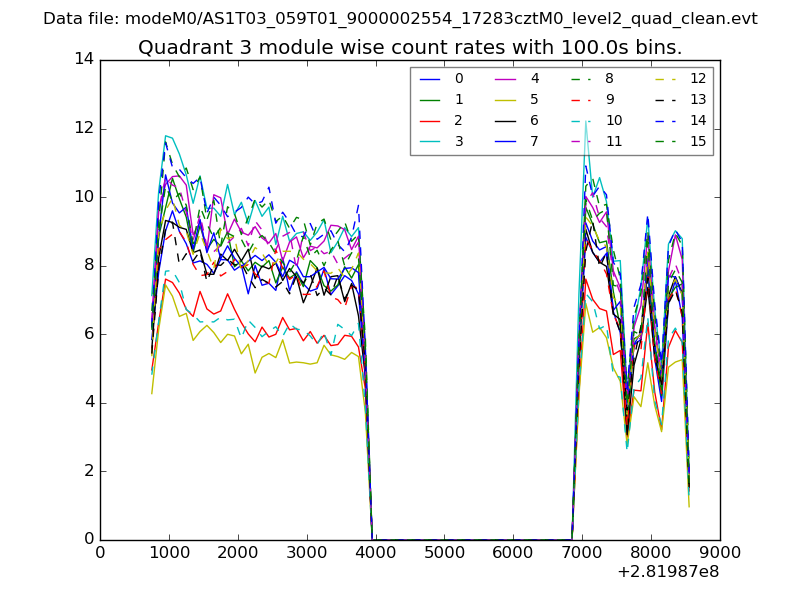
| Module-wise count rates for Quadrant A Data is divided into 100 sec bins |
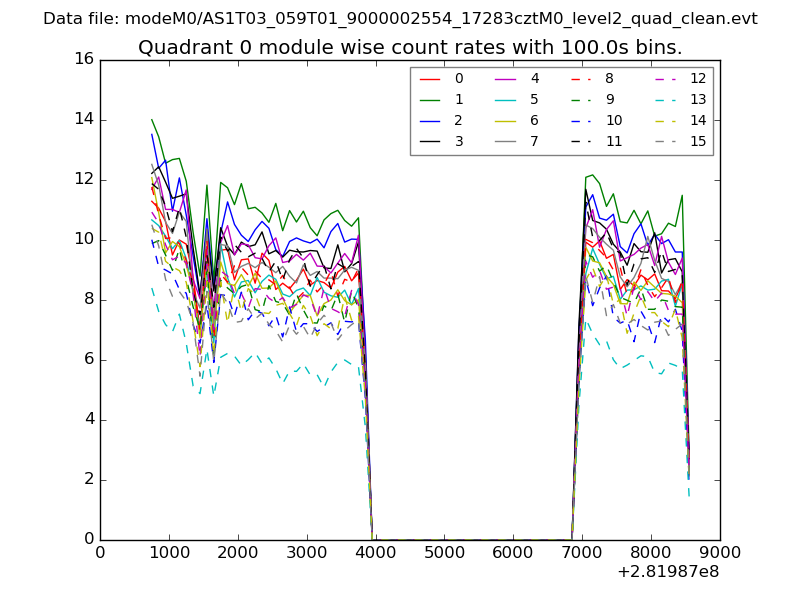 |
 |
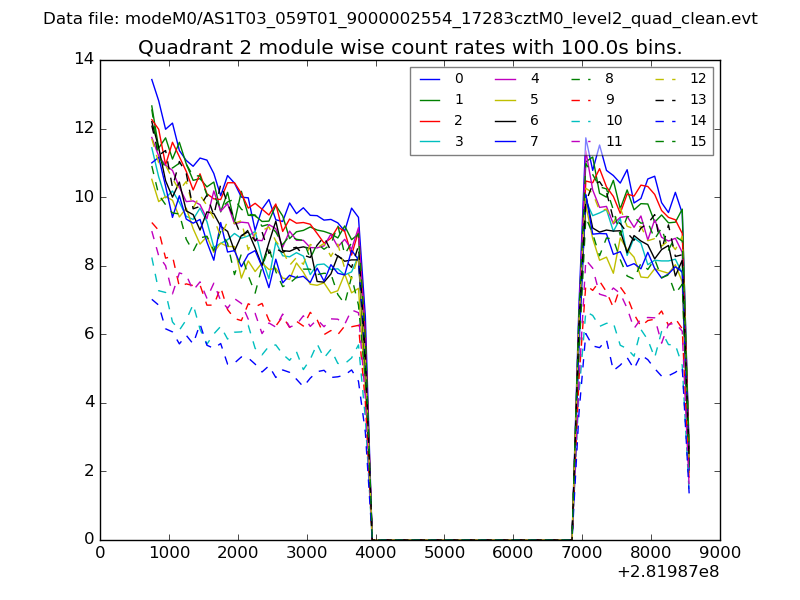
| Module-wise count rates for Quadrant B Data is divided into 100 sec bins |
 |
 |
| Module-wise count rates for Quadrant C Data is divided into 100 sec bins |
 |
 |
| Module-wise count rates for Quadrant D Data is divided into 100 sec bins |
 |
 |
| Parameter | Plot |
|---|---|
| CZT HV Monitor | 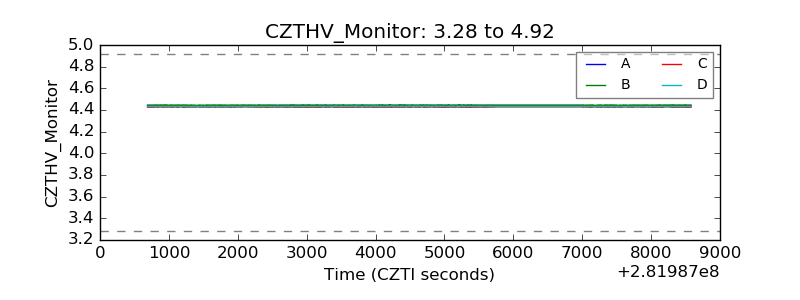 |
| D_VDD | 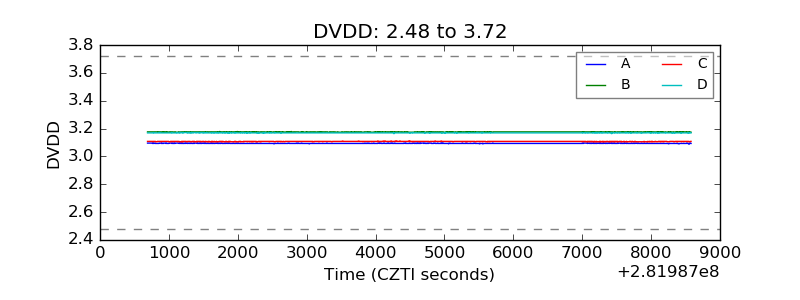 |
| Temperature 1 | 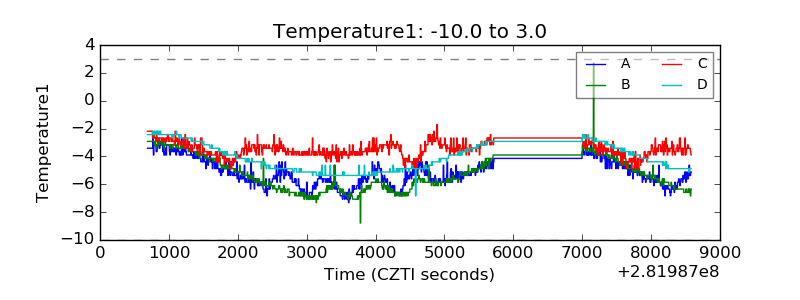 |
| Veto HV Monitor | 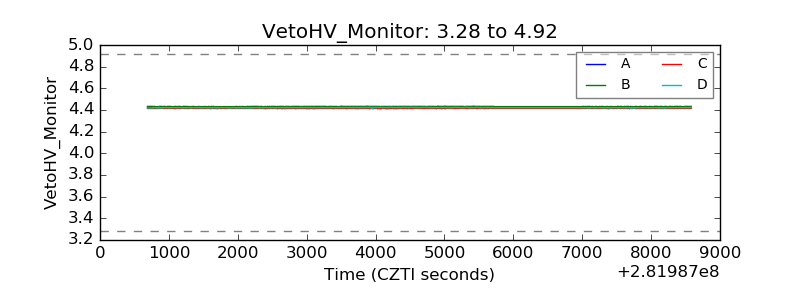 |
| Veto LLD | 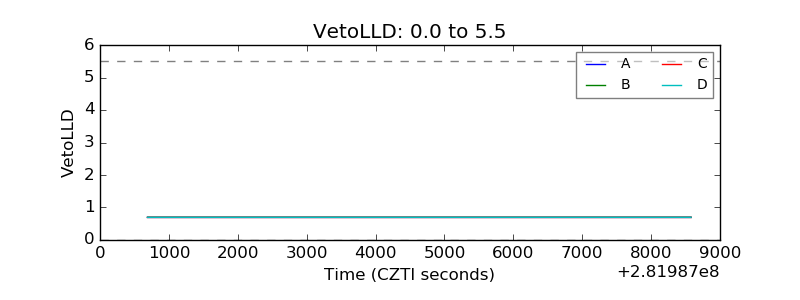 |
| Alpha Counter | 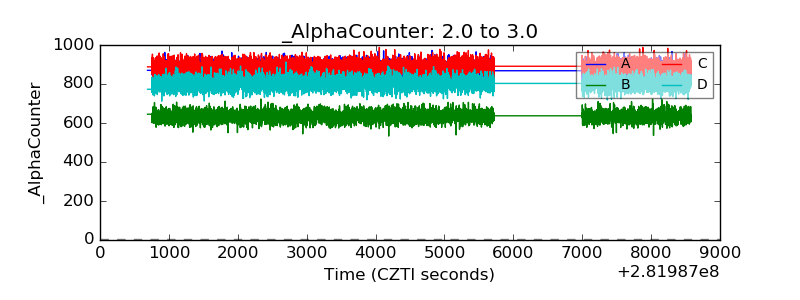 |
| _CPM_Rate | 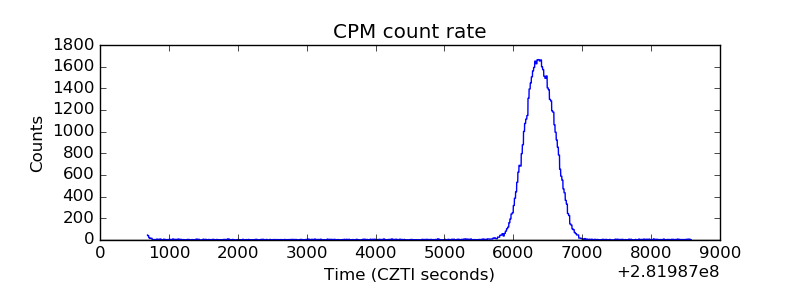 |
| CZT Counter | 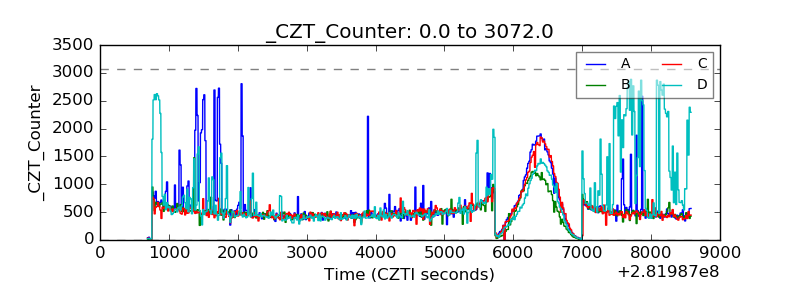 |
| +2.5 Volts monitor |  |
| +5 Volts monitor |  |
| _ROLL_ROT | 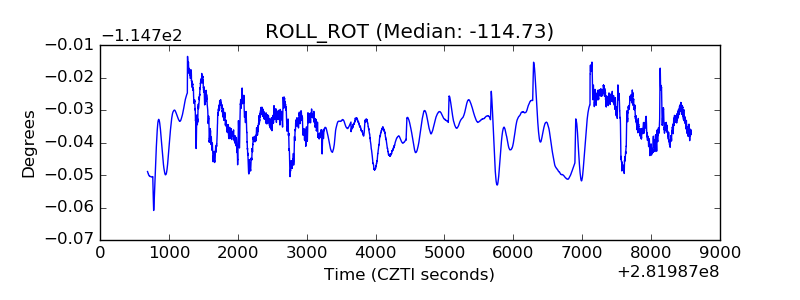 |
| _Roll_DEC | 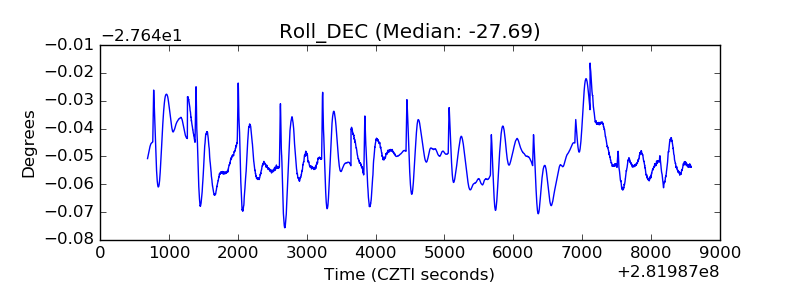 |
| _Roll_RA | 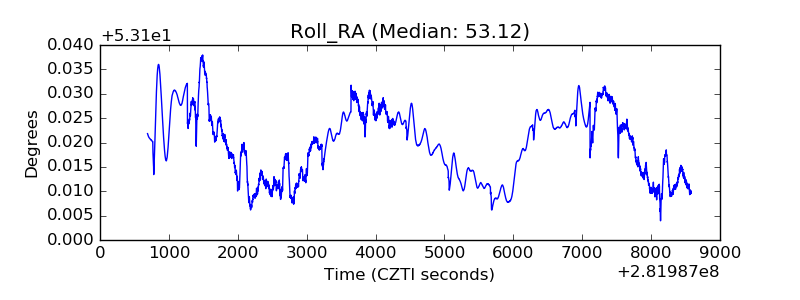 |
| Veto Counter | 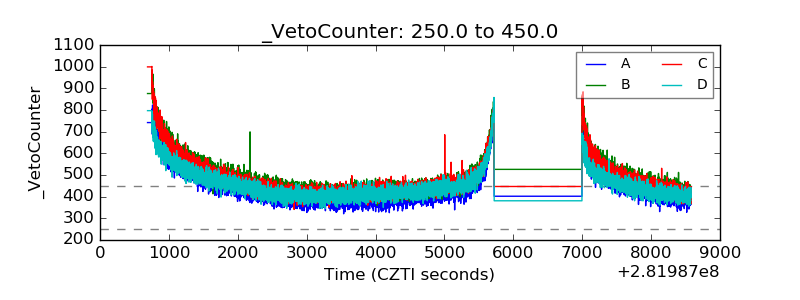 |