| Param | Original file | Final file |
|---|---|---|
| Filename | modeM0/AS1T03_059T01_9000002554_17284cztM0_level2.evt | modeM0/AS1T03_059T01_9000002554_17284cztM0_level2_quad_clean.evt |
| Size (bytes) | 637,084,800 | 89,222,400 |
| Size | 607.6 MB | 85.1 MB |
| Events in quadrant A | 3,475,521 | 587,849 |
| Events in quadrant B | 3,140,926 | 601,214 |
| Events in quadrant C | 3,201,159 | 558,069 |
| Events in quadrant D | 9,035,364 | 500,319 |
| Mode M9 | |||
|---|---|---|---|
| Quadrant | BADHDUFLAG | Total packets | Discarded packets |
| A | 0 | 16 | 0 |
| B | 0 | 17 | 0 |
| C | 0 | 17 | 0 |
| D | 0 | 17 | 0 |
| Mode SS | |||
|---|---|---|---|
| Quadrant | BADHDUFLAG | Total packets | Discarded packets |
| A | 0 | 132 | 0 |
| B | 0 | 132 | 0 |
| C | 0 | 132 | 0 |
| D | 0 | 132 | 0 |
| Mode M0 | |||
|---|---|---|---|
| Quadrant | BADHDUFLAG | Total packets | Discarded packets |
| A | 0 | 14604 | 3 |
| B | 0 | 13561 | 3 |
| C | 0 | 13779 | 3 |
| D | 0 | 31365 | 7 |
| Quadrant | Total seconds | Saturated seconds | Saturation percentage |
|---|---|---|---|
| A | 6514 | 100 | 1.535155% |
| B | 6514 | 48 | 0.736874% |
| C | 6514 | 56 | 0.859687% |
| D | 6513 | 2113 | 32.442807% |
Noise dominated data is calculated using 1-second bins in cleaned event files. If a bin has >2000 counts, and if more than 50% of those come from <1% of pixels, then it is considered to be noise-dominated and hence unusable.
| Quadrant | # 1 sec bins | Bins with >0 counts | Bins with >2000 counts | High rate bins dominated by noise | Noise dominated (total time) | Noise dominated (detector-on time) | Marked lightcurve |
|---|---|---|---|---|---|---|---|
| A | 7639 | 6516 | 67 | 67 | 0.88% | 1.03% | 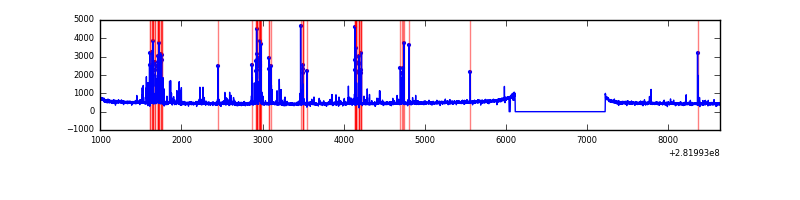 |
| B | 7639 | 6516 | 2 | 2 | 0.03% | 0.03% | 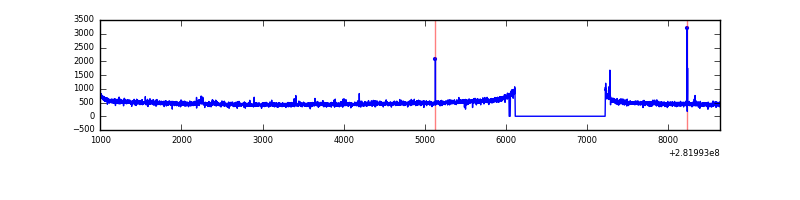 |
| C | 7639 | 6516 | 2 | 2 | 0.03% | 0.03% | 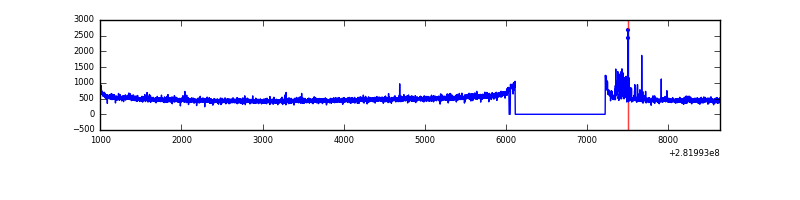 |
| D | 7638 | 6515 | 1896 | 1896 | 24.82% | 29.10% | 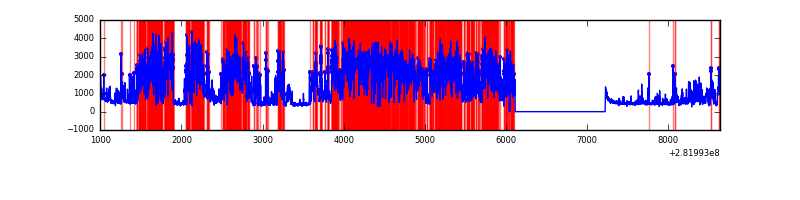 |
Top three noisy pixels from each quadrant. If the there are fewer than three noisy pixels in the level2.evt file, extra rows are filled as -1
| Pixel properties | Quadrant properties | ||||||
|---|---|---|---|---|---|---|---|
| Quadrant | DetID | PixID | Counts | Sigma | Mean | Median | Sigma |
| A | 14 | 235 | 414968 | 2600.55 | 791 | 777 | 159.3 |
| A | 0 | 23 | 9588 | 55.32 | 791 | 777 | 159.3 |
| A | 4 | 2 | 8347 | 47.53 | 791 | 777 | 159.3 |
| B | 12 | 111 | 18368 | 115.07 | 798 | 780 | 152.8 |
| B | 11 | 111 | 15633 | 97.18 | 798 | 780 | 152.8 |
| B | 0 | 230 | 14536 | 90.0 | 798 | 780 | 152.8 |
| C | 14 | 238 | 115651 | 649.39 | 754 | 762 | 176.9 |
| C | 5 | 112 | 77313 | 432.69 | 754 | 762 | 176.9 |
| C | 3 | 233 | 69027 | 385.85 | 754 | 762 | 176.9 |
| D | 11 | 176 | 5877101 | 35968.5 | 664 | 646 | 163.4 |
| D | 13 | 232 | 250821 | 1531.27 | 664 | 646 | 163.4 |
| D | 10 | 70 | 172684 | 1053.01 | 664 | 646 | 163.4 |
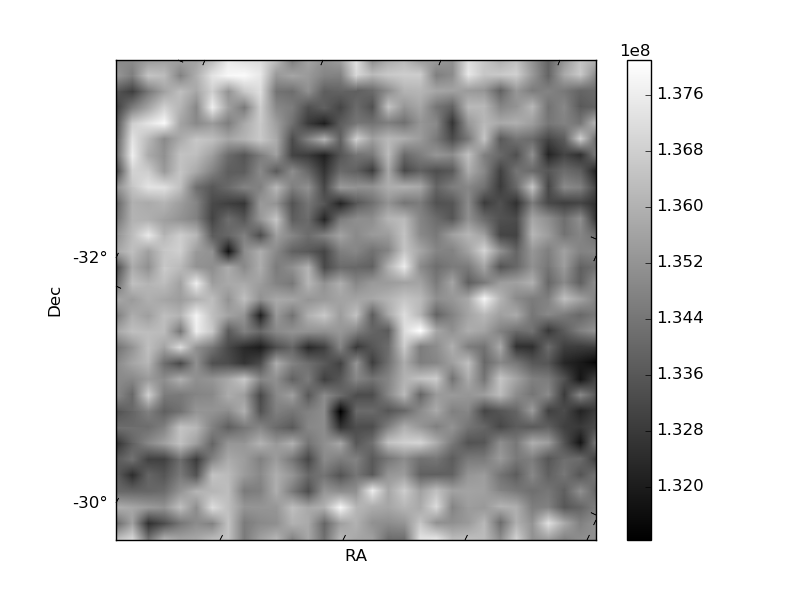
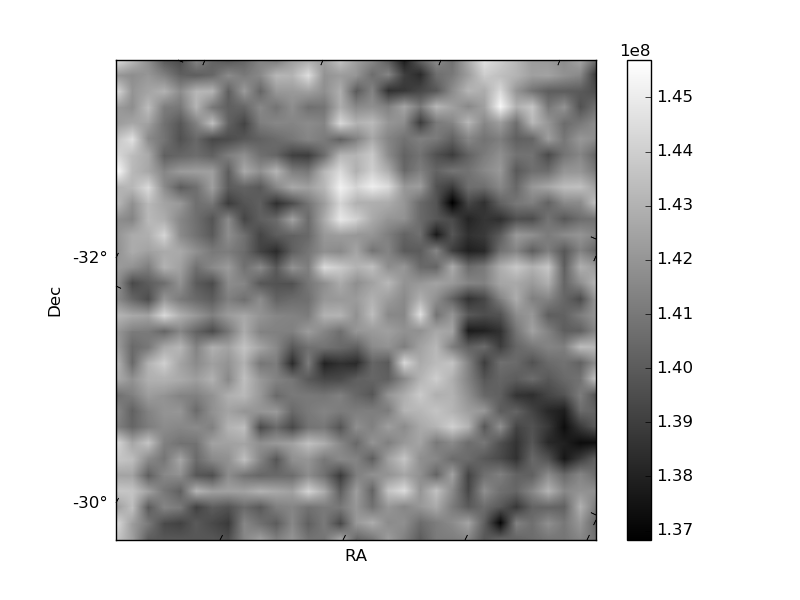
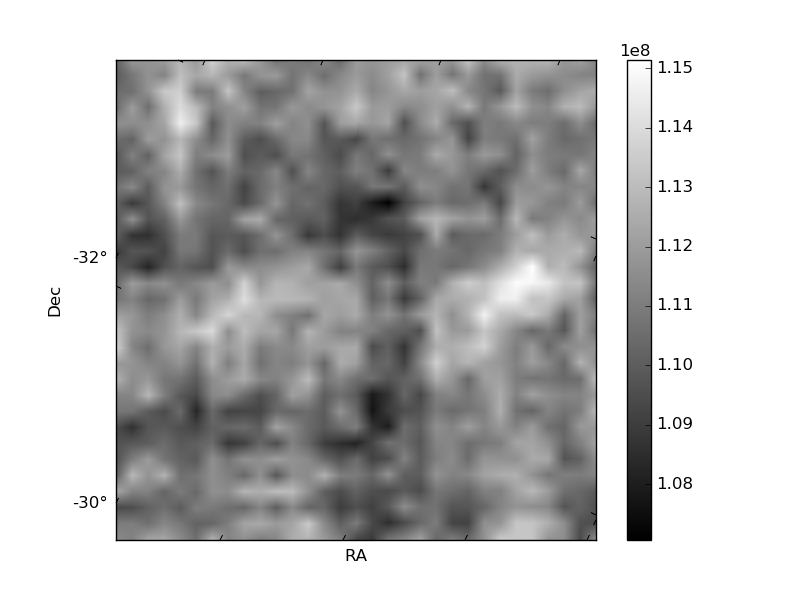
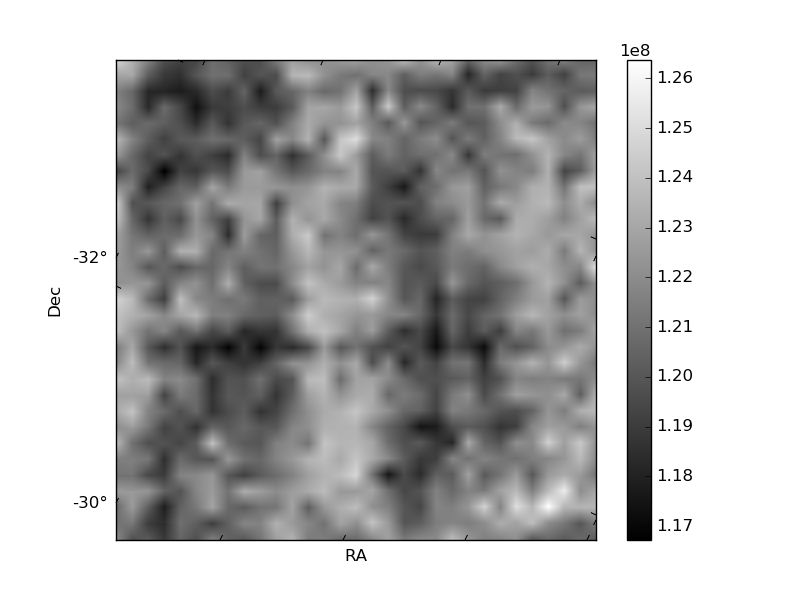
Histogram calculated using DETX and DETY for each event in the final _common_clean file
| Quadrant A |  |
 |
Quadrant B |
|---|---|---|---|
| Quadrant D | 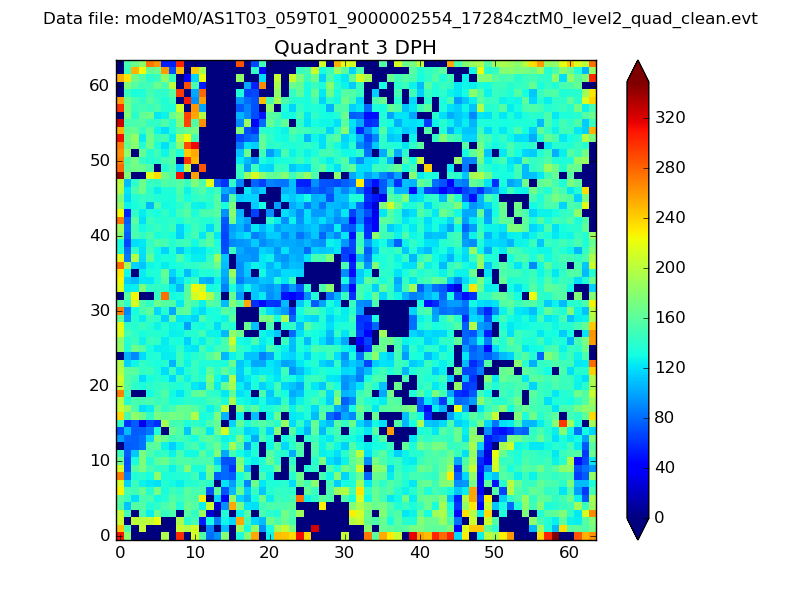 |
 |
Quadrant C |
| Plot type | Count rate plots | Images |
|---|---|---|
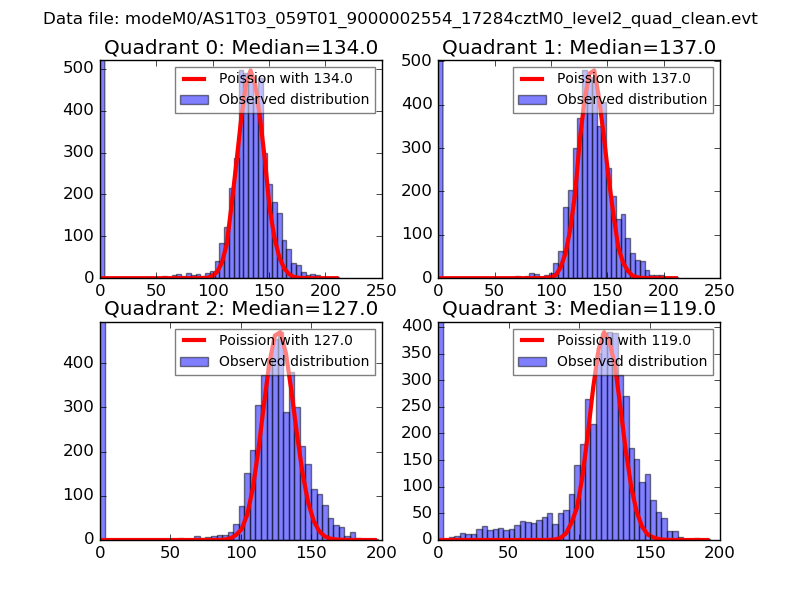
| Comparison with Poisson distribution Blue bars denote a histogram of data divided into 1 sec bins. Red curve is a Poisson curve with rate = median count rate of data. |
 |
 |
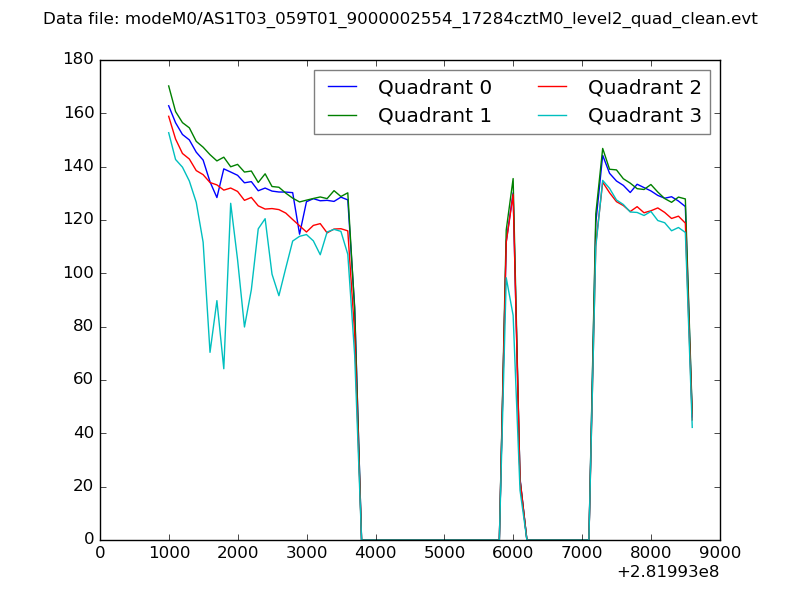
| Quadrant-wise count rates Data is divided into 100 sec bins |
 |
|
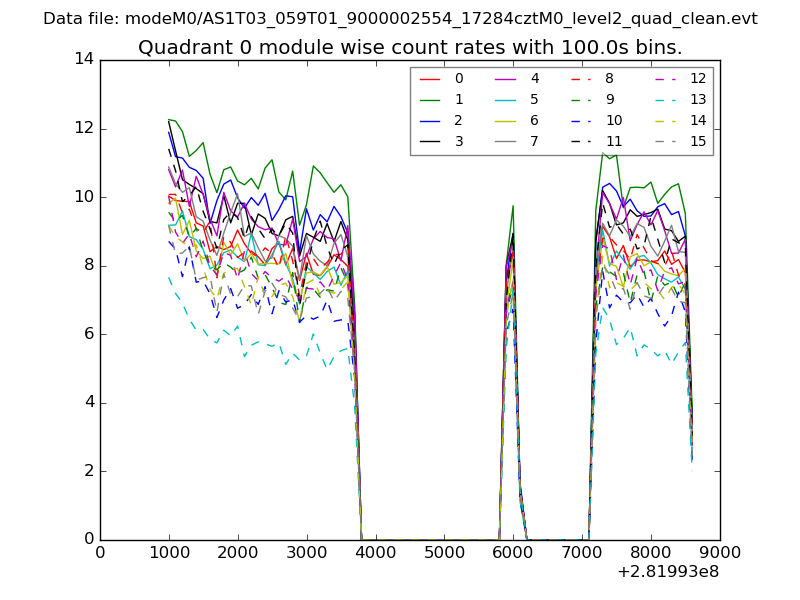
| Module-wise count rates for Quadrant A Data is divided into 100 sec bins |
 |
 |
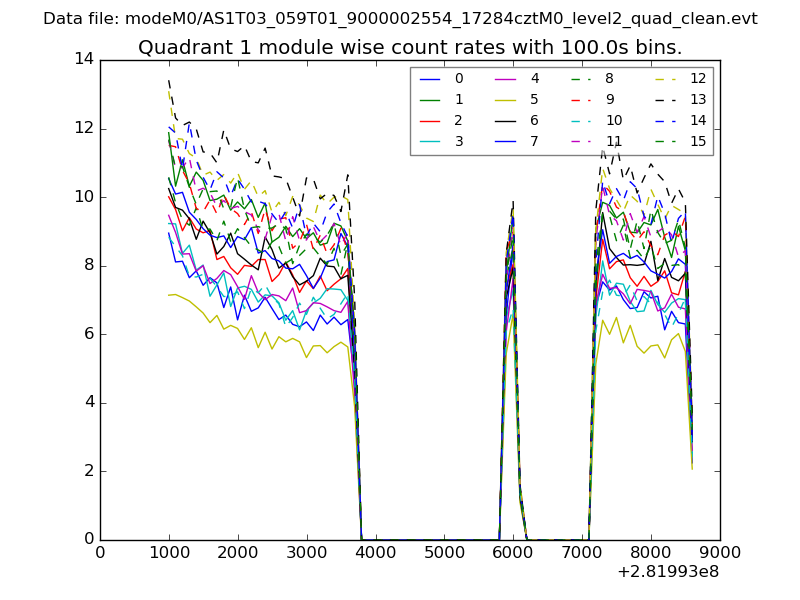
| Module-wise count rates for Quadrant B Data is divided into 100 sec bins |
 |
 |
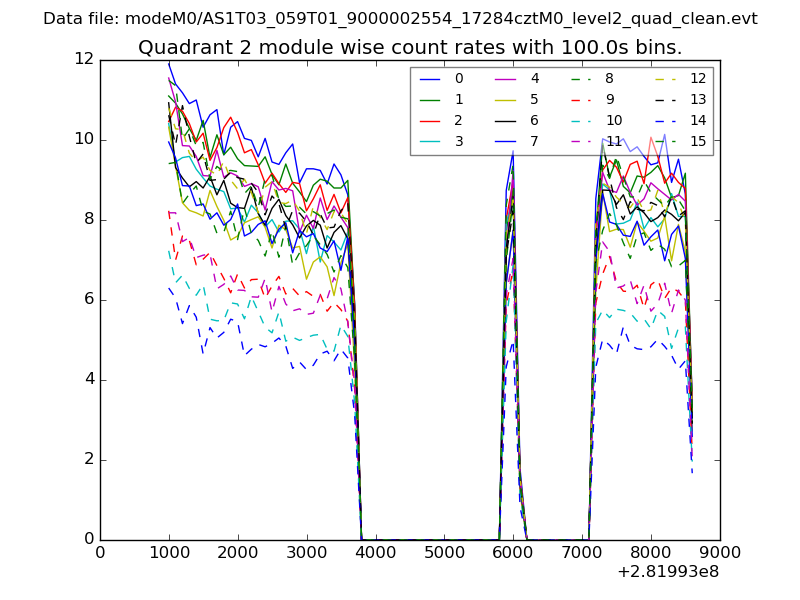
| Module-wise count rates for Quadrant C Data is divided into 100 sec bins |
 |
 |
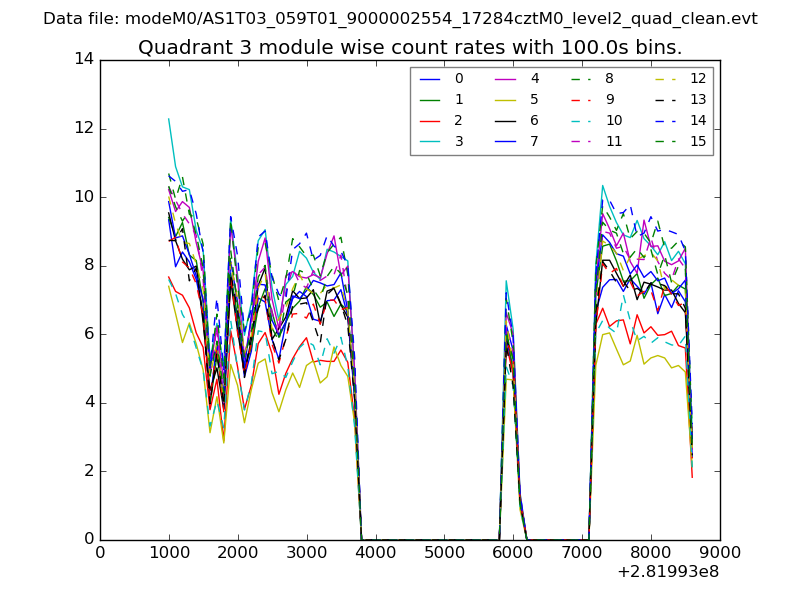
| Module-wise count rates for Quadrant D Data is divided into 100 sec bins |
 |
 |
| Parameter | Plot |
|---|---|
| CZT HV Monitor | 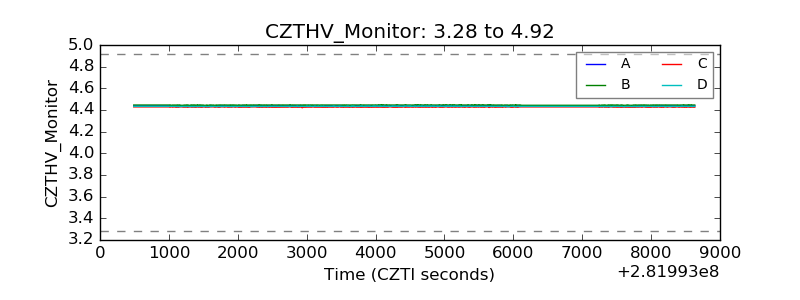 |
| D_VDD | 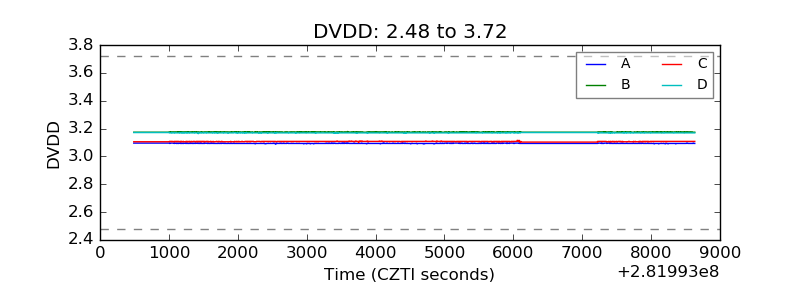 |
| Temperature 1 | 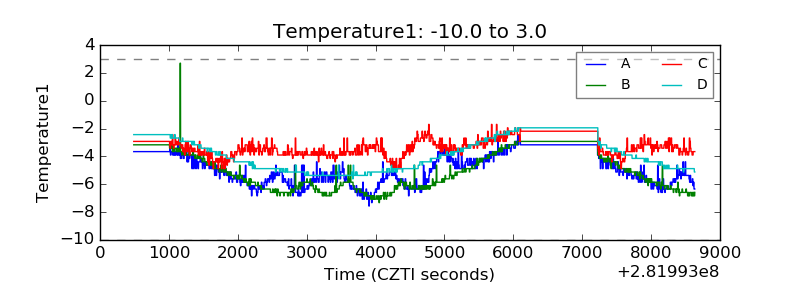 |
| Veto HV Monitor | 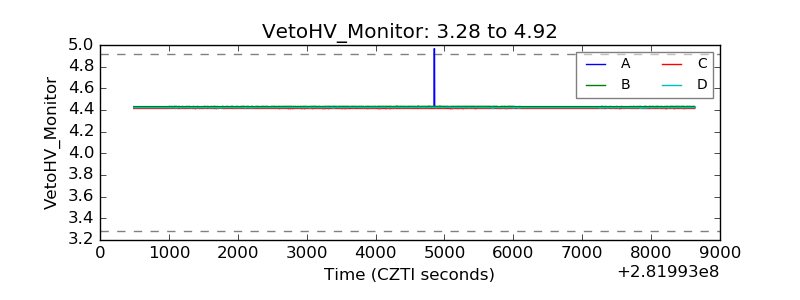 |
| Veto LLD |  |
| Alpha Counter | 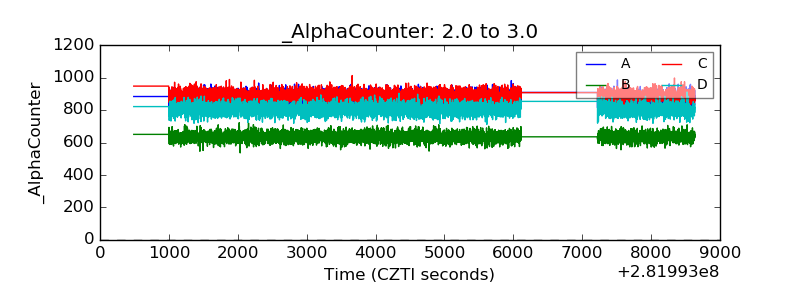 |
| _CPM_Rate | 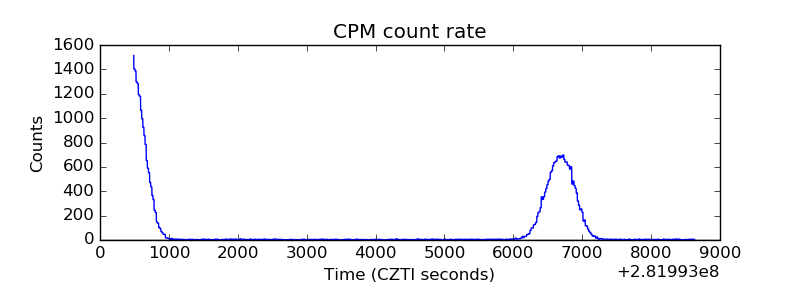 |
| CZT Counter | 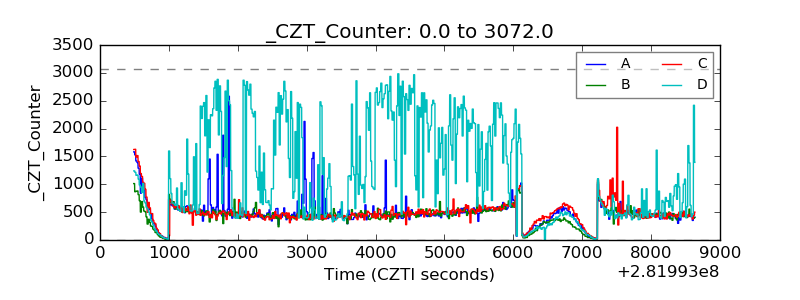 |
| +2.5 Volts monitor |  |
| +5 Volts monitor | 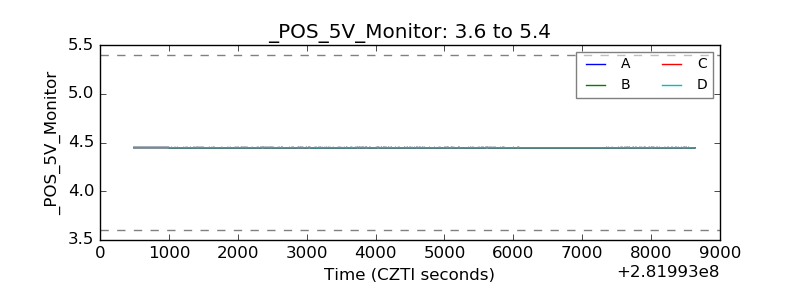 |
| _ROLL_ROT | 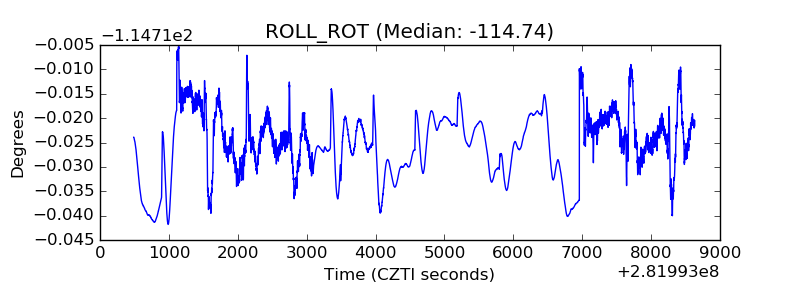 |
| _Roll_DEC | 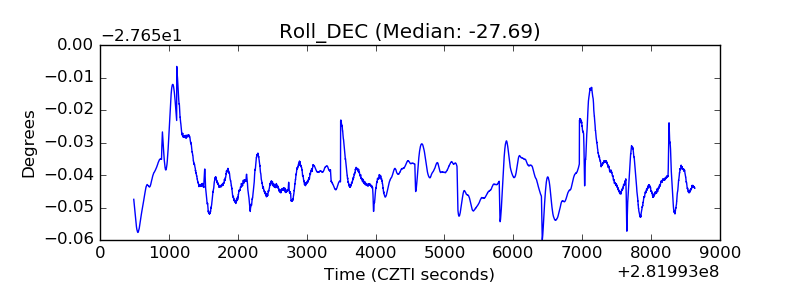 |
| _Roll_RA | 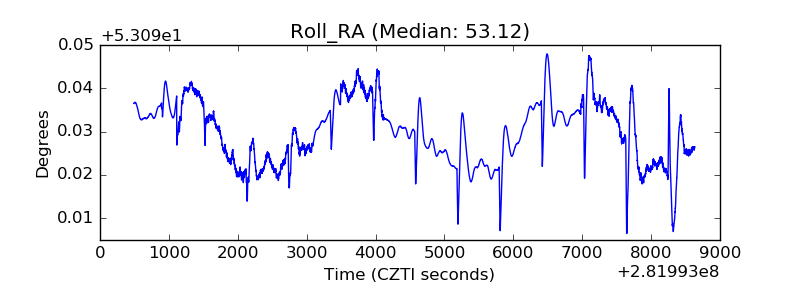 |
| Veto Counter | 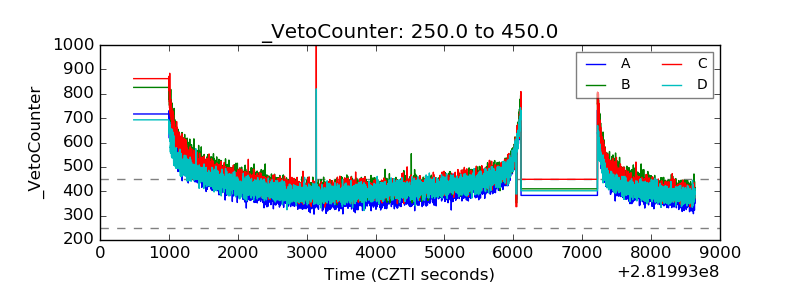 |