| Param | Original file | Final file |
|---|---|---|
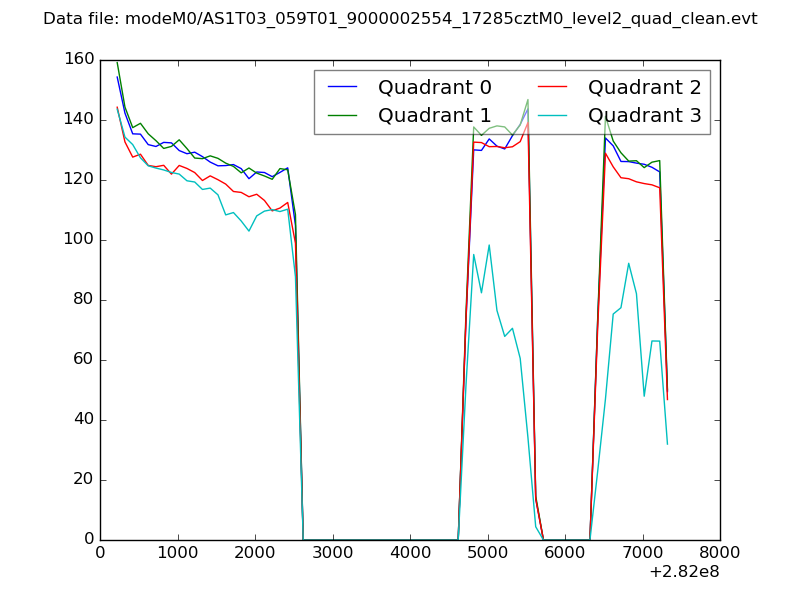
| Filename | modeM0/AS1T03_059T01_9000002554_17285cztM0_level2.evt | modeM0/AS1T03_059T01_9000002554_17285cztM0_level2_quad_clean.evt |
| Size (bytes) | 611,928,000 | 80,596,800 |
| Size | 583.6 MB | 76.9 MB |
| Events in quadrant A | 3,006,995 | 537,077 |
| Events in quadrant B | 2,971,274 | 545,229 |
| Events in quadrant C | 3,033,113 | 512,178 |
| Events in quadrant D | 9,093,392 | 405,495 |
| Mode M9 | |||
|---|---|---|---|
| Quadrant | BADHDUFLAG | Total packets | Discarded packets |
| A | 0 | 12 | 0 |
| B | 0 | 13 | 0 |
| C | 0 | 13 | 0 |
| D | 0 | 13 | 0 |
| Mode SS | |||
|---|---|---|---|
| Quadrant | BADHDUFLAG | Total packets | Discarded packets |
| A | 0 | 128 | 0 |
| B | 0 | 128 | 0 |
| C | 0 | 128 | 0 |
| D | 0 | 128 | 0 |
| Mode M0 | |||
|---|---|---|---|
| Quadrant | BADHDUFLAG | Total packets | Discarded packets |
| A | 0 | 13316 | 2 |
| B | 0 | 12948 | 2 |
| C | 0 | 13140 | 2 |
| D | 0 | 31371 | 2 |
| Quadrant | Total seconds | Saturated seconds | Saturation percentage |
|---|---|---|---|
| A | 6302 | 21 | 0.333228% |
| B | 6302 | 28 | 0.444303% |
| C | 6302 | 43 | 0.682323% |
| D | 6302 | 2325 | 36.893050% |
Noise dominated data is calculated using 1-second bins in cleaned event files. If a bin has >2000 counts, and if more than 50% of those come from <1% of pixels, then it is considered to be noise-dominated and hence unusable.
| Quadrant | # 1 sec bins | Bins with >0 counts | Bins with >2000 counts | High rate bins dominated by noise | Noise dominated (total time) | Noise dominated (detector-on time) | Marked lightcurve |
|---|---|---|---|---|---|---|---|
| A | 7142 | 6303 | 7 | 7 | 0.10% | 0.11% | 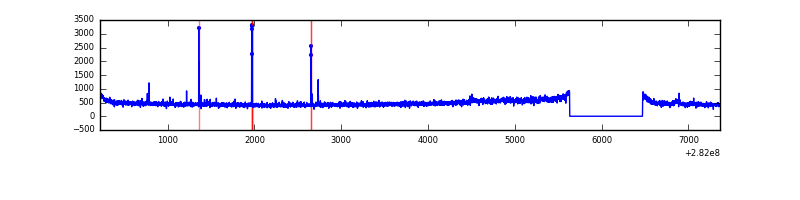 |
| B | 7142 | 6303 | 1 | 1 | 0.01% | 0.02% | 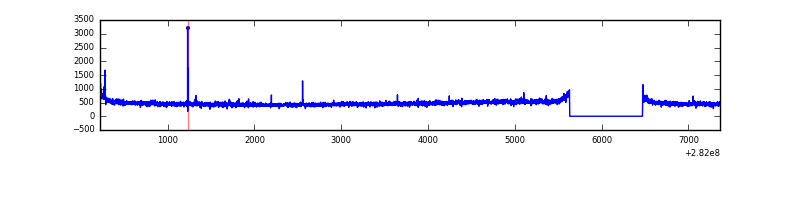 |
| C | 7142 | 6303 | 2 | 2 | 0.03% | 0.03% |  |
| D | 7142 | 6302 | 2100 | 2100 | 29.40% | 33.32% | 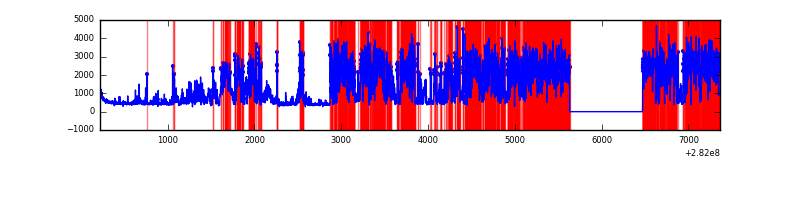 |
Top three noisy pixels from each quadrant. If the there are fewer than three noisy pixels in the level2.evt file, extra rows are filled as -1
| Pixel properties | Quadrant properties | ||||||
|---|---|---|---|---|---|---|---|
| Quadrant | DetID | PixID | Counts | Sigma | Mean | Median | Sigma |
| A | 0 | 23 | 80294 | 520.71 | 750 | 736 | 152.8 |
| A | 4 | 2 | 37953 | 243.59 | 750 | 736 | 152.8 |
| A | 0 | 226 | 11271 | 68.95 | 750 | 736 | 152.8 |
| B | 12 | 111 | 17541 | 115.16 | 753 | 736 | 145.9 |
| B | 11 | 111 | 15220 | 99.25 | 753 | 736 | 145.9 |
| B | 14 | 111 | 13191 | 85.35 | 753 | 736 | 145.9 |
| C | 14 | 238 | 110633 | 651.92 | 717 | 722 | 168.6 |
| C | 5 | 112 | 76833 | 451.44 | 717 | 722 | 168.6 |
| C | 3 | 233 | 51923 | 303.69 | 717 | 722 | 168.6 |
| D | 11 | 176 | 6426475 | 43988.02 | 602 | 585 | 146.1 |
| D | 13 | 232 | 174897 | 1193.24 | 602 | 585 | 146.1 |
| D | 10 | 70 | 95137 | 647.25 | 602 | 585 | 146.1 |
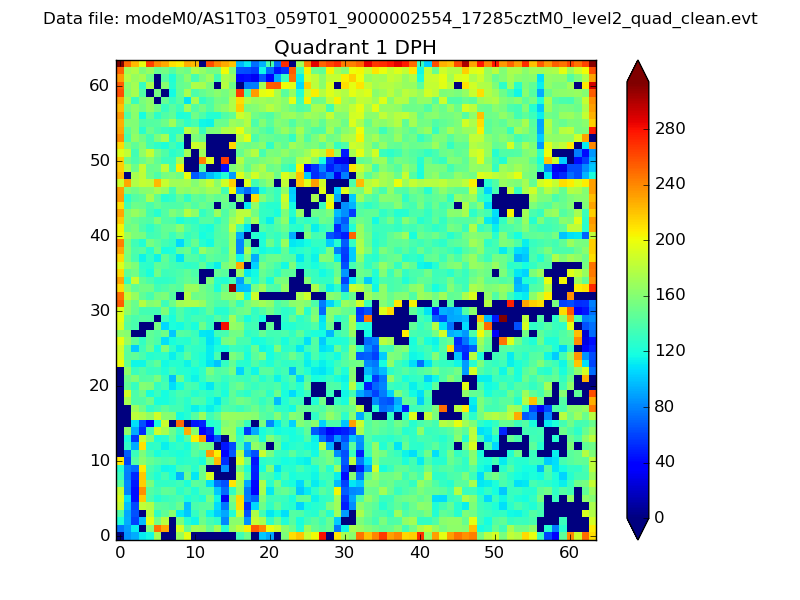
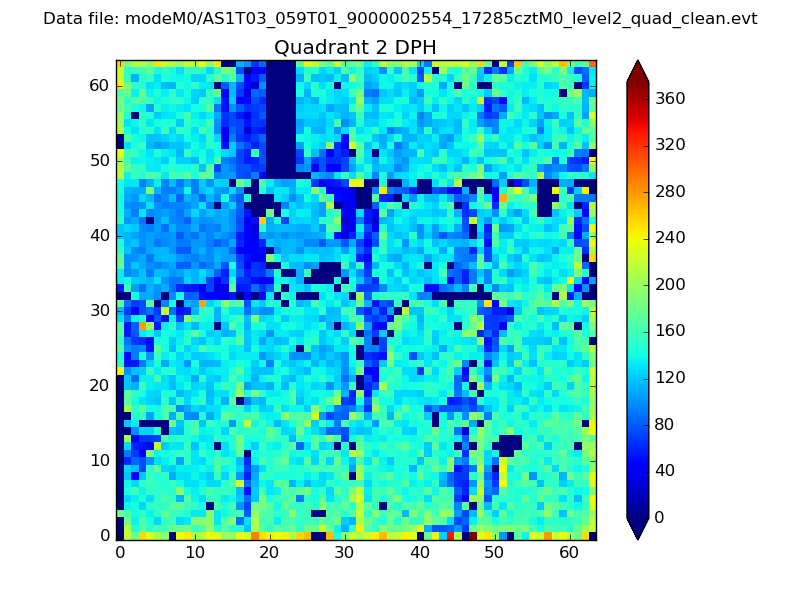
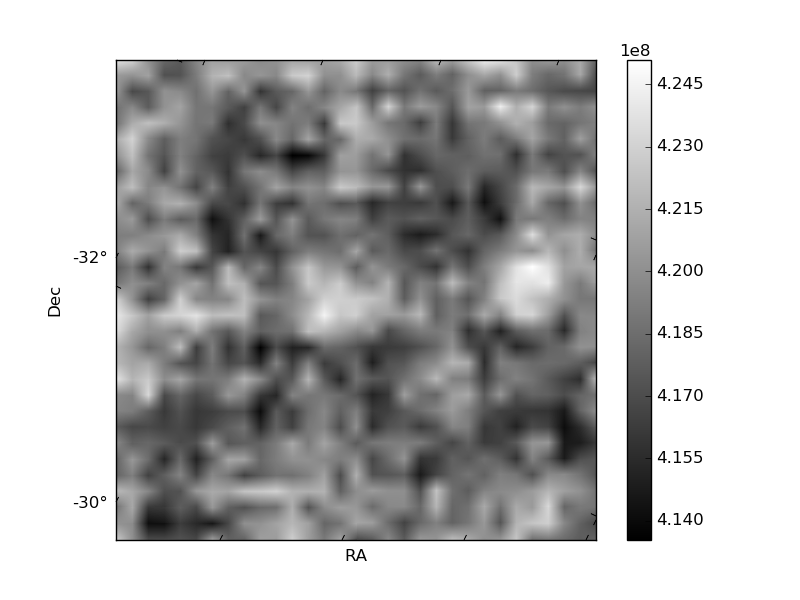
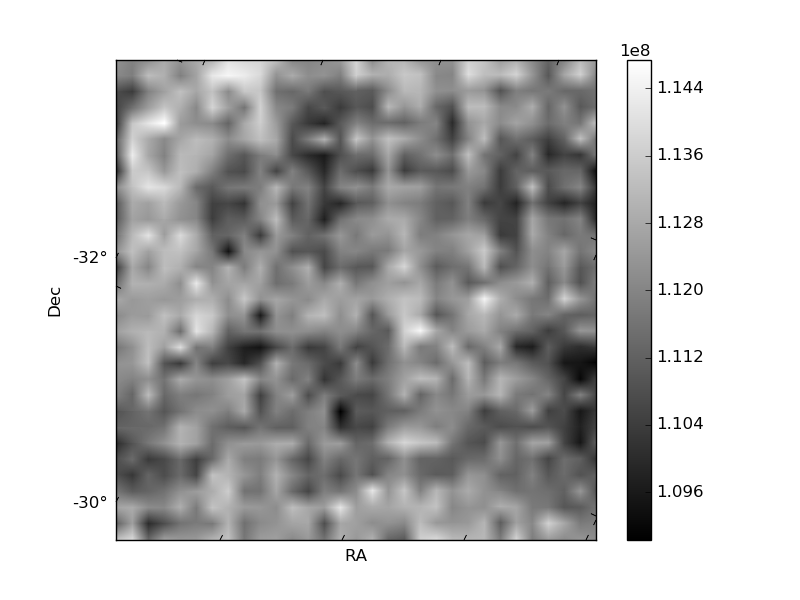
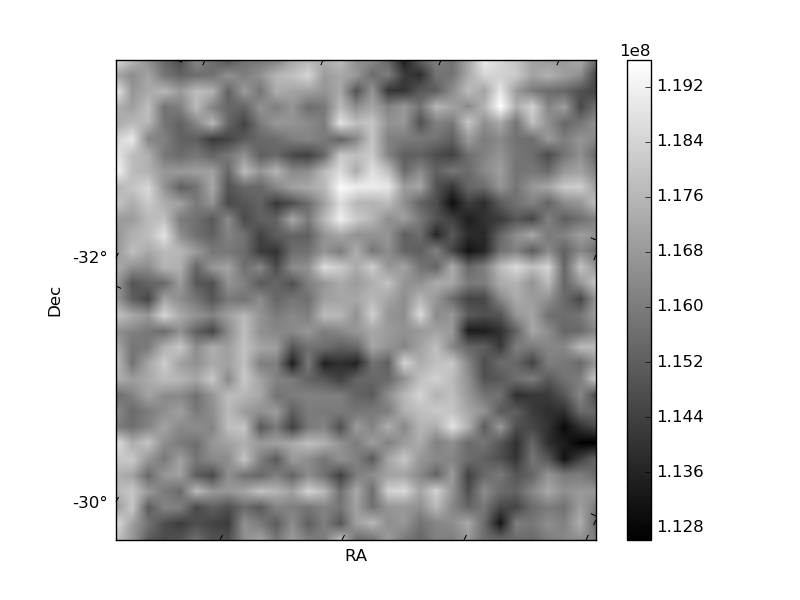
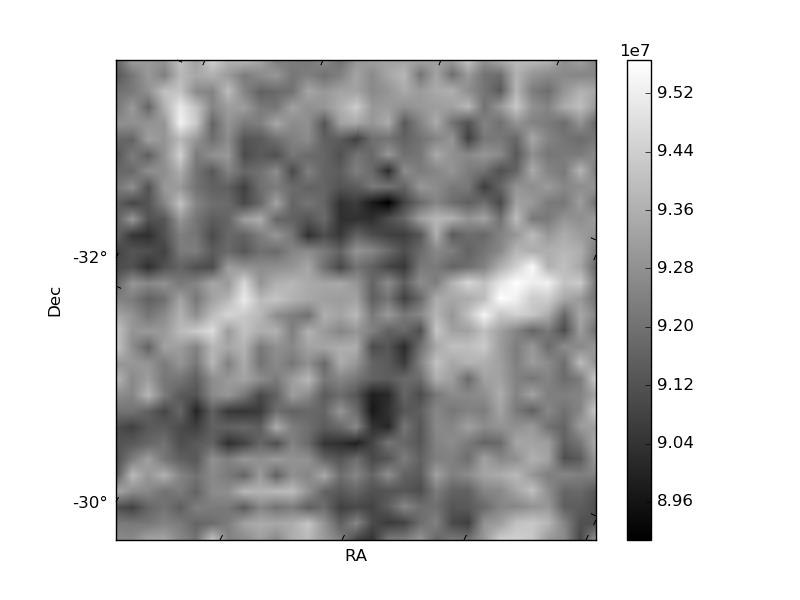
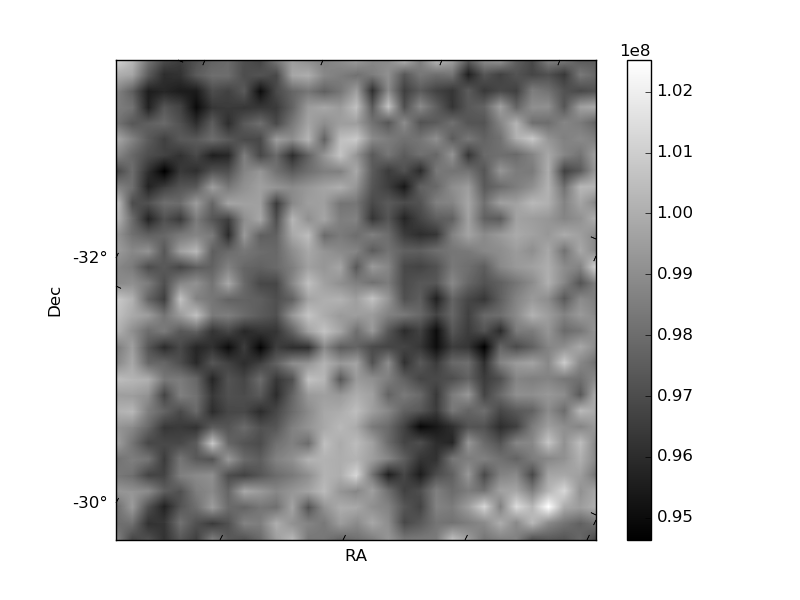
Histogram calculated using DETX and DETY for each event in the final _common_clean file
| Quadrant A | 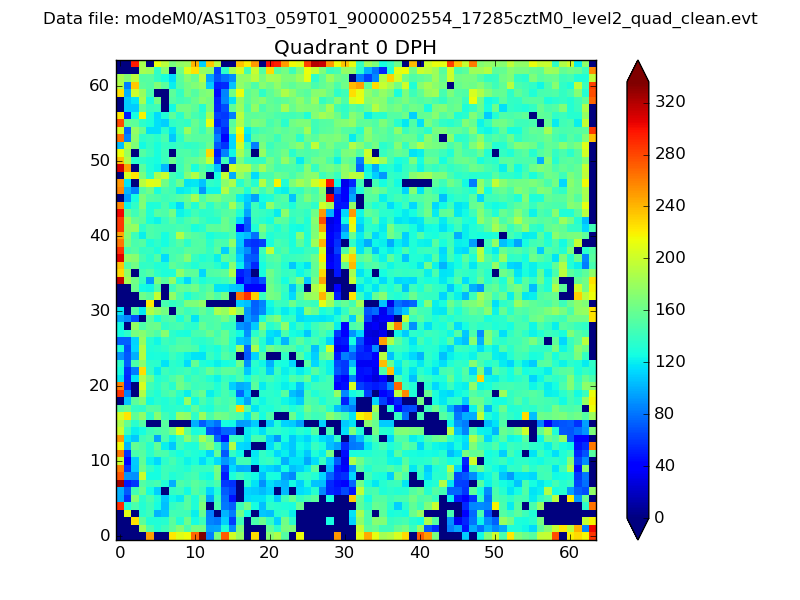 |
 |
Quadrant B |
|---|---|---|---|
| Quadrant D | 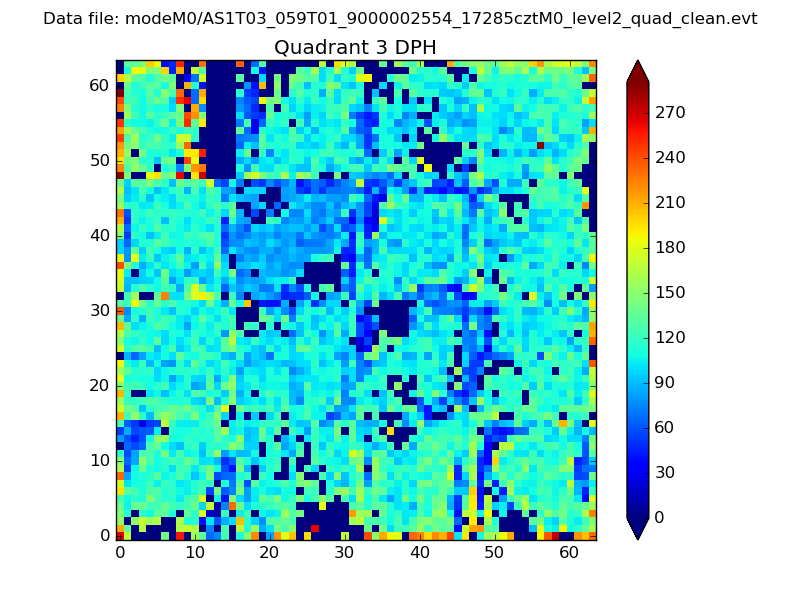 |
 |
Quadrant C |
| Plot type | Count rate plots | Images |
|---|---|---|
| Comparison with Poisson distribution Blue bars denote a histogram of data divided into 1 sec bins. Red curve is a Poisson curve with rate = median count rate of data. |
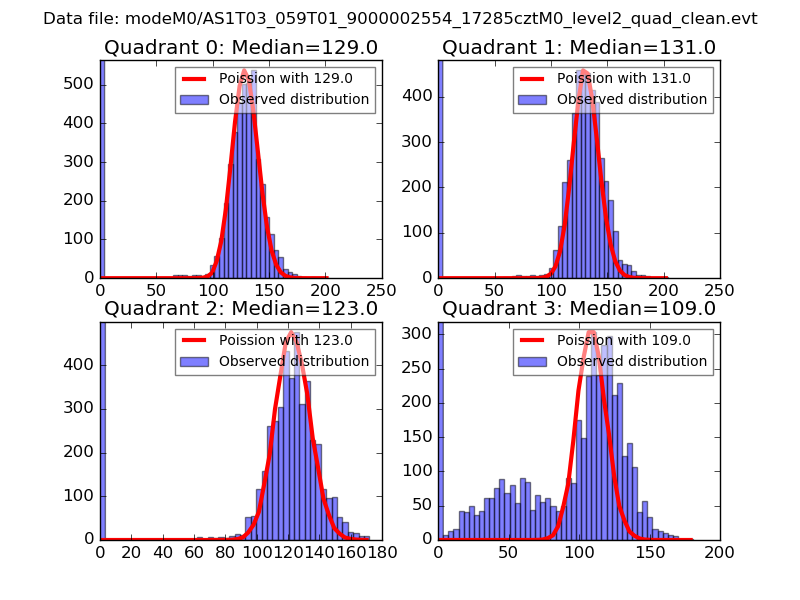 |
 |
| Quadrant-wise count rates Data is divided into 100 sec bins |
 |
|
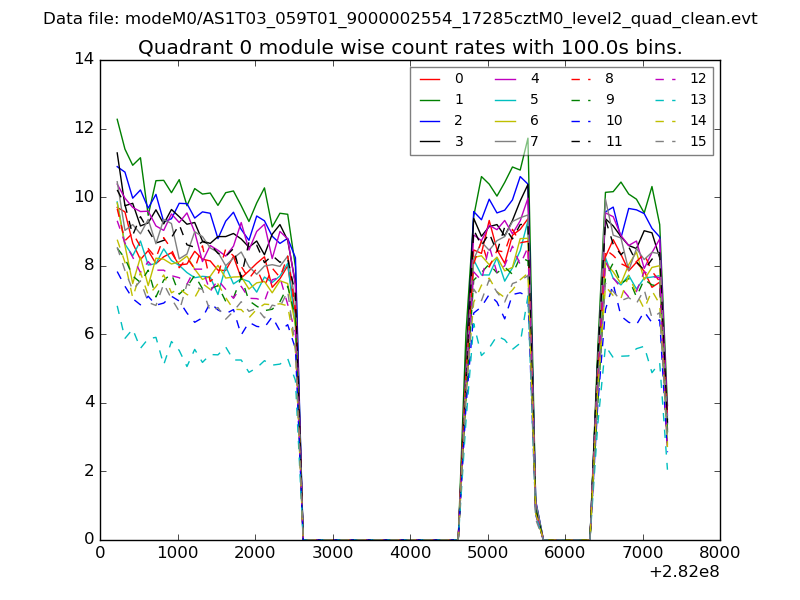
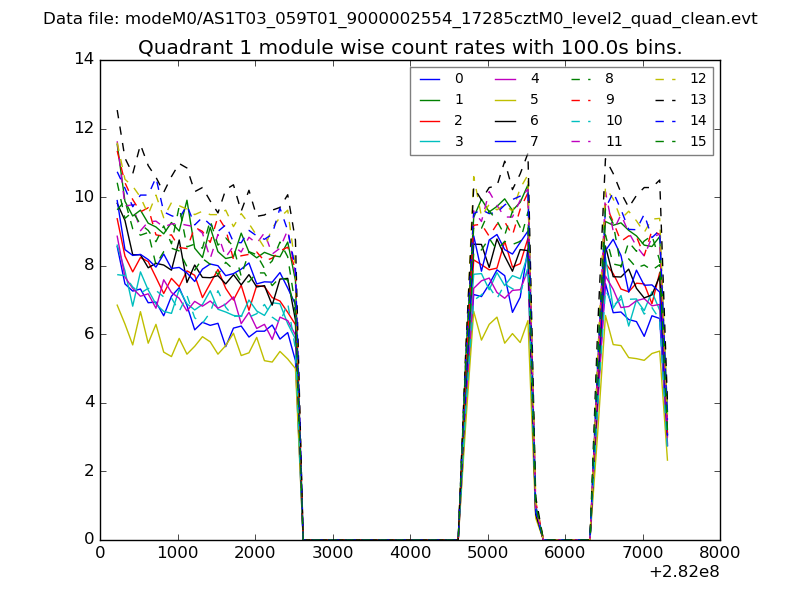
| Module-wise count rates for Quadrant A Data is divided into 100 sec bins |
 |
 |
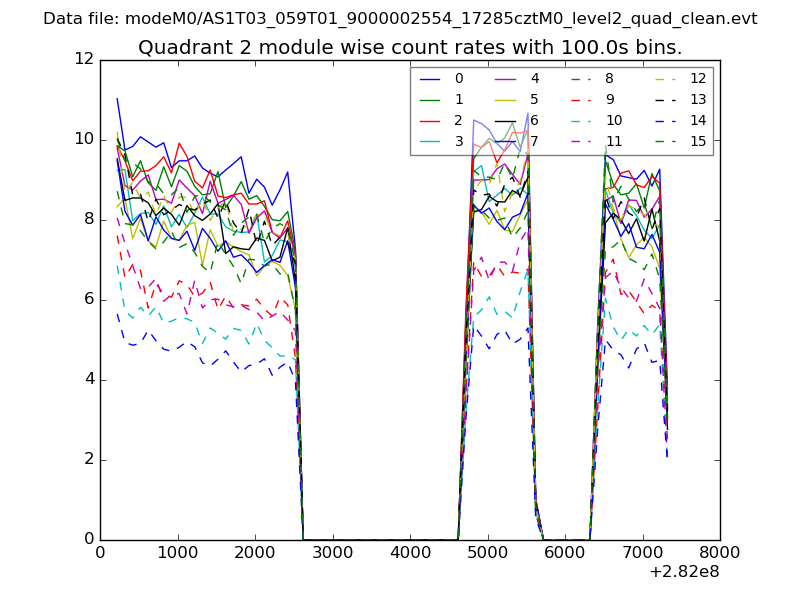
| Module-wise count rates for Quadrant B Data is divided into 100 sec bins |
 |
 |
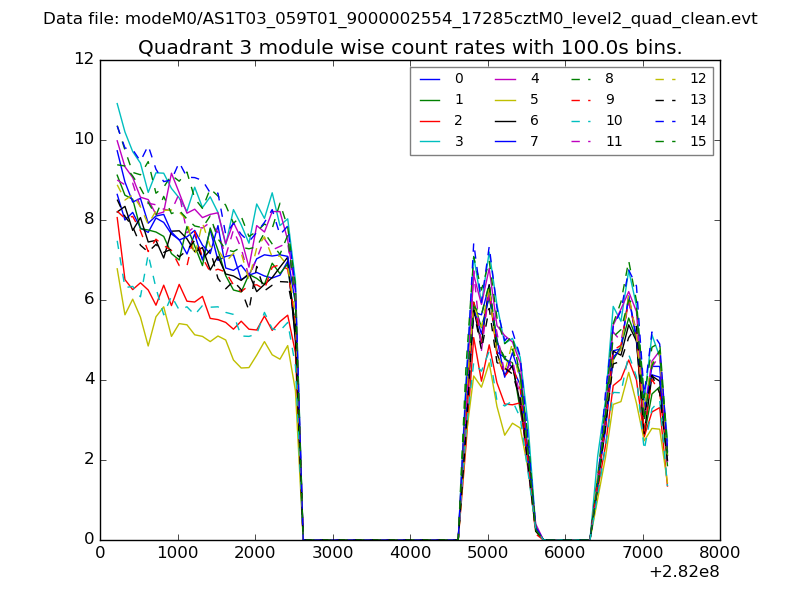
| Module-wise count rates for Quadrant C Data is divided into 100 sec bins |
 |
 |
| Module-wise count rates for Quadrant D Data is divided into 100 sec bins |
 |
 |
| Parameter | Plot |
|---|---|
| CZT HV Monitor | 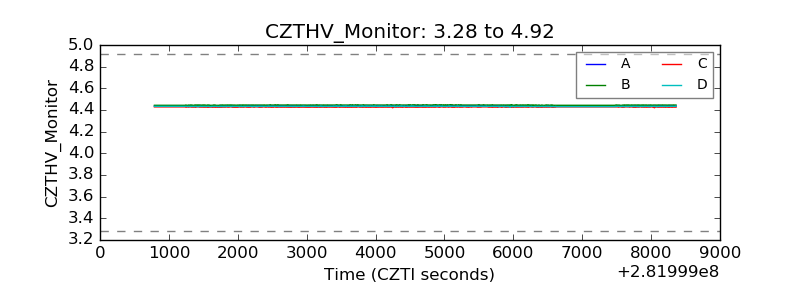 |
| D_VDD | 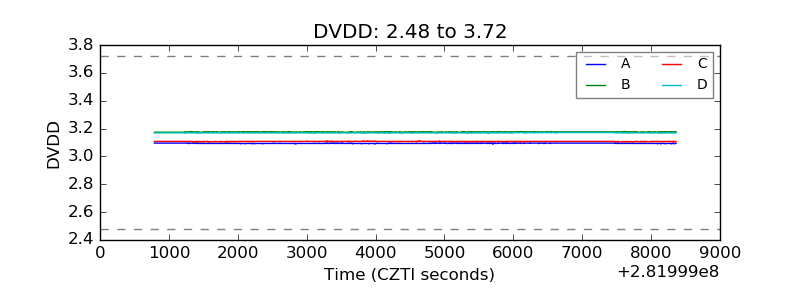 |
| Temperature 1 | 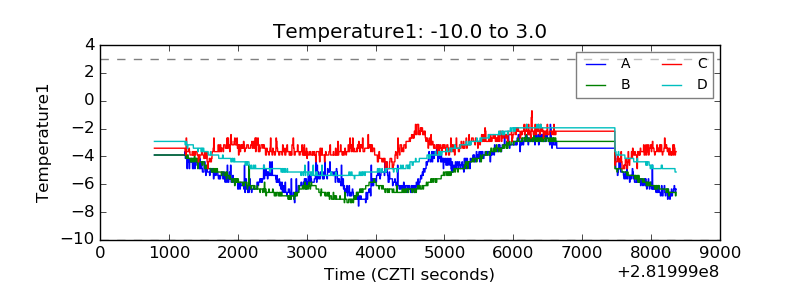 |
| Veto HV Monitor | 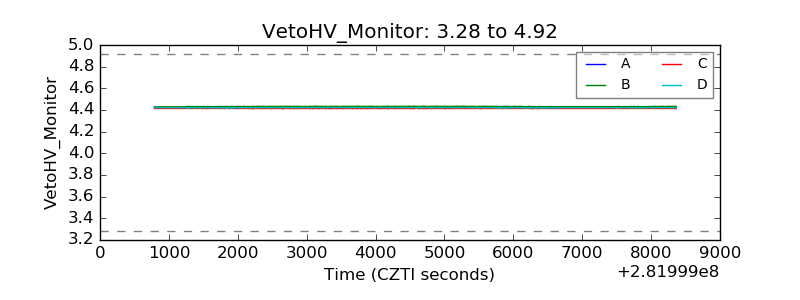 |
| Veto LLD | 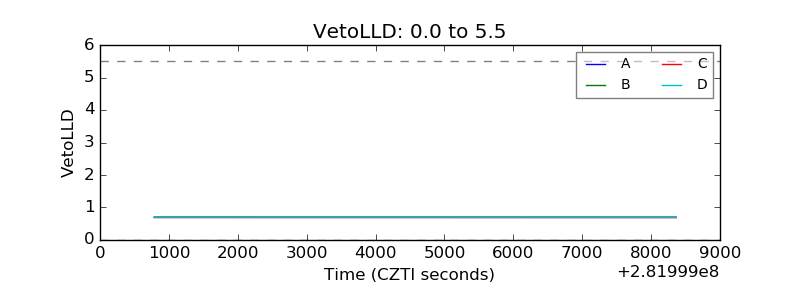 |
| Alpha Counter | 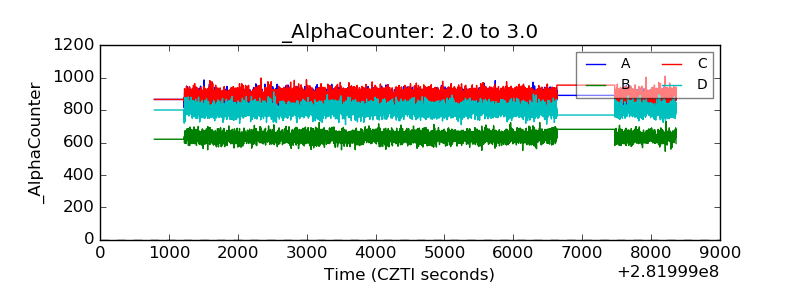 |
| _CPM_Rate | 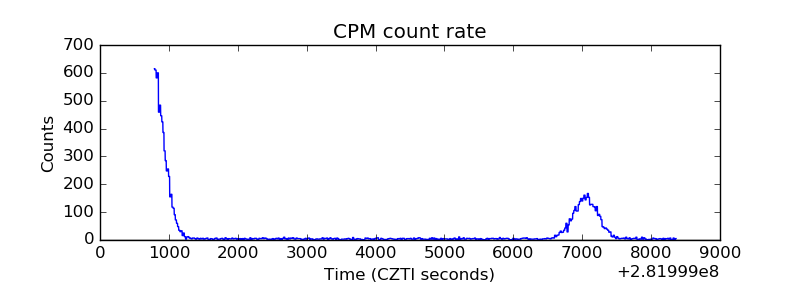 |
| CZT Counter | 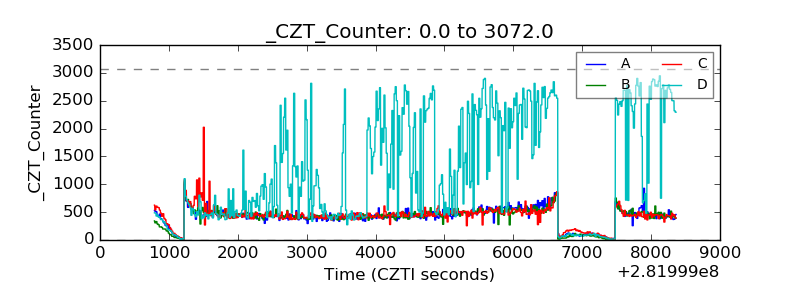 |
| +2.5 Volts monitor |  |
| +5 Volts monitor |  |
| _ROLL_ROT | 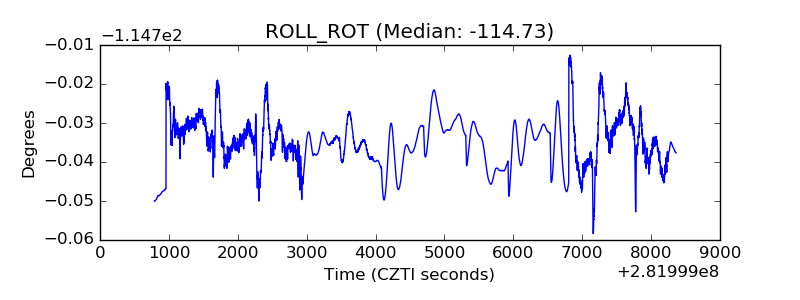 |
| _Roll_DEC | 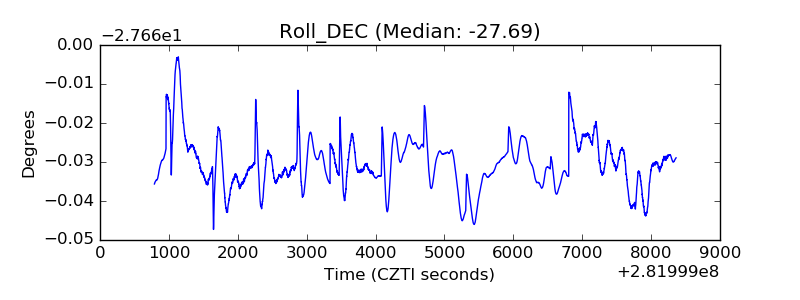 |
| _Roll_RA | 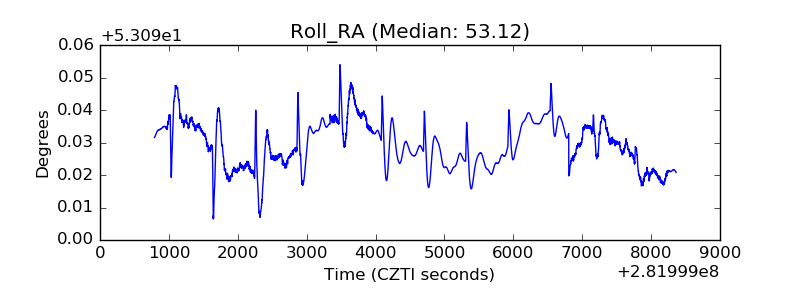 |
| Veto Counter | 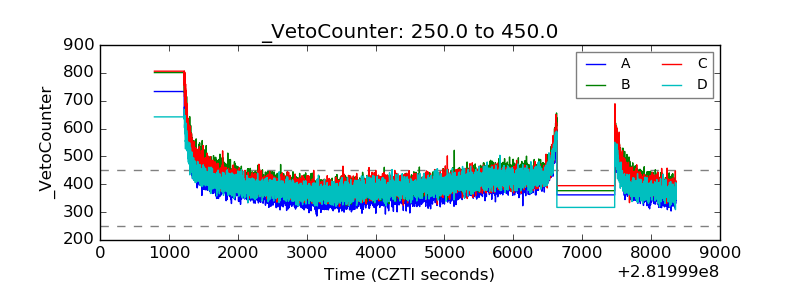 |