| Param | Original file | Final file |
|---|---|---|
| Filename | modeM0/AS1T03_059T01_9000002554_17286cztM0_level2.evt | modeM0/AS1T03_059T01_9000002554_17286cztM0_level2_quad_clean.evt |
| Size (bytes) | 92,056,320 | 13,325,760 |
| Size | 87.8 MB | 12.7 MB |
| Events in quadrant A | 344,818 | 96,676 |
| Events in quadrant B | 348,754 | 98,042 |
| Events in quadrant C | 341,453 | 91,795 |
| Events in quadrant D | 1,697,567 | 55,249 |
| Mode SS | |||
|---|---|---|---|
| Quadrant | BADHDUFLAG | Total packets | Discarded packets |
| A | 0 | 14 | 0 |
| B | 0 | 14 | 0 |
| C | 0 | 14 | 0 |
| D | 0 | 14 | 0 |
| Mode M0 | |||
|---|---|---|---|
| Quadrant | BADHDUFLAG | Total packets | Discarded packets |
| A | 0 | 1547 | 0 |
| B | 0 | 1542 | 0 |
| C | 0 | 1543 | 0 |
| D | 0 | 5569 | 0 |
| Quadrant | Total seconds | Saturated seconds | Saturation percentage |
|---|---|---|---|
| A | 769 | 0 | 0.000000% |
| B | 770 | 0 | 0.000000% |
| C | 770 | 0 | 0.000000% |
| D | 770 | 546 | 70.909091% |
Noise dominated data is calculated using 1-second bins in cleaned event files. If a bin has >2000 counts, and if more than 50% of those come from <1% of pixels, then it is considered to be noise-dominated and hence unusable.
| Quadrant | # 1 sec bins | Bins with >0 counts | Bins with >2000 counts | High rate bins dominated by noise | Noise dominated (total time) | Noise dominated (detector-on time) | Marked lightcurve |
|---|---|---|---|---|---|---|---|
| A | 769 | 769 | 0 | 0 | 0.00% | 0.00% | 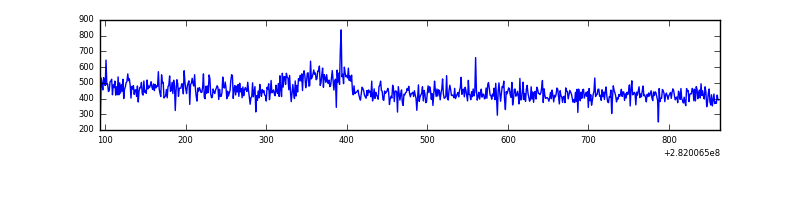 |
| B | 770 | 770 | 0 | 0 | 0.00% | 0.00% | 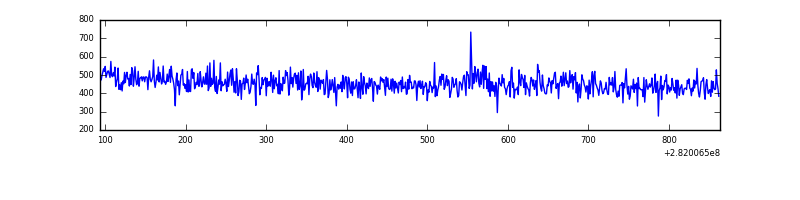 |
| C | 770 | 770 | 0 | 0 | 0.00% | 0.00% | 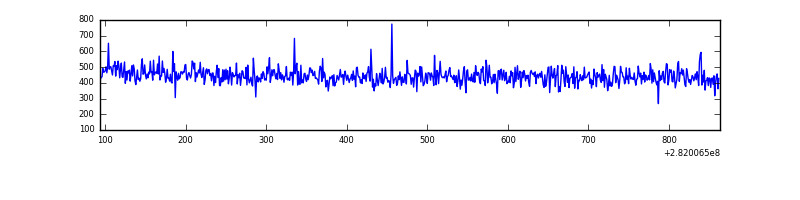 |
| D | 770 | 770 | 510 | 510 | 66.23% | 66.23% | 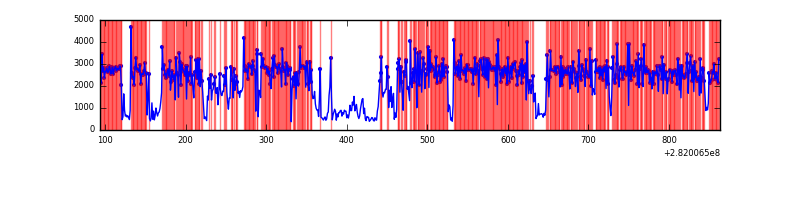 |
Top three noisy pixels from each quadrant. If the there are fewer than three noisy pixels in the level2.evt file, extra rows are filled as -1
| Pixel properties | Quadrant properties | ||||||
|---|---|---|---|---|---|---|---|
| Quadrant | DetID | PixID | Counts | Sigma | Mean | Median | Sigma |
| A | 0 | 23 | 6729 | 330.65 | 87 | 86 | 20.1 |
| A | 0 | 226 | 1170 | 53.96 | 87 | 86 | 20.1 |
| A | 4 | 2 | 796 | 35.34 | 87 | 86 | 20.1 |
| B | 0 | 230 | 2946 | 146.24 | 88 | 86 | 19.6 |
| B | 12 | 111 | 2080 | 101.96 | 88 | 86 | 19.6 |
| B | 11 | 111 | 1809 | 88.1 | 88 | 86 | 19.6 |
| C | 14 | 238 | 13089 | 611.13 | 83 | 83 | 21.3 |
| C | 3 | 233 | 4376 | 201.72 | 83 | 83 | 21.3 |
| C | 13 | 61 | 557 | 22.27 | 83 | 83 | 21.3 |
| D | 11 | 176 | 1466906 | 93094.89 | 57 | 55 | 15.8 |
| D | 13 | 189 | 2900 | 180.56 | 57 | 55 | 15.8 |
| D | 2 | 152 | 2576 | 160.0 | 57 | 55 | 15.8 |
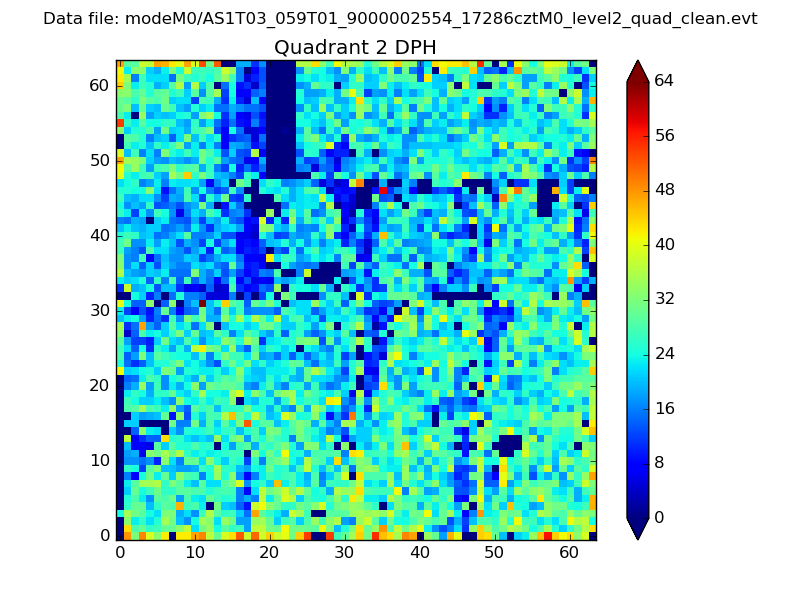
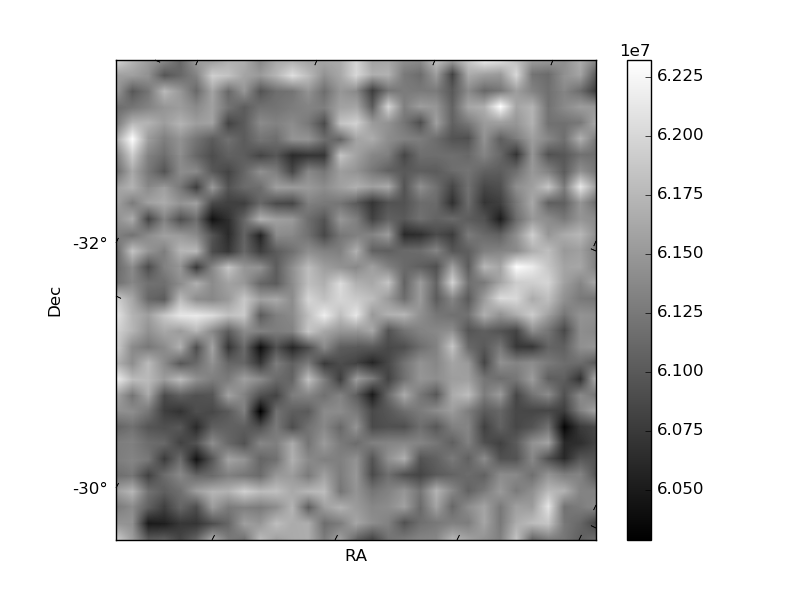
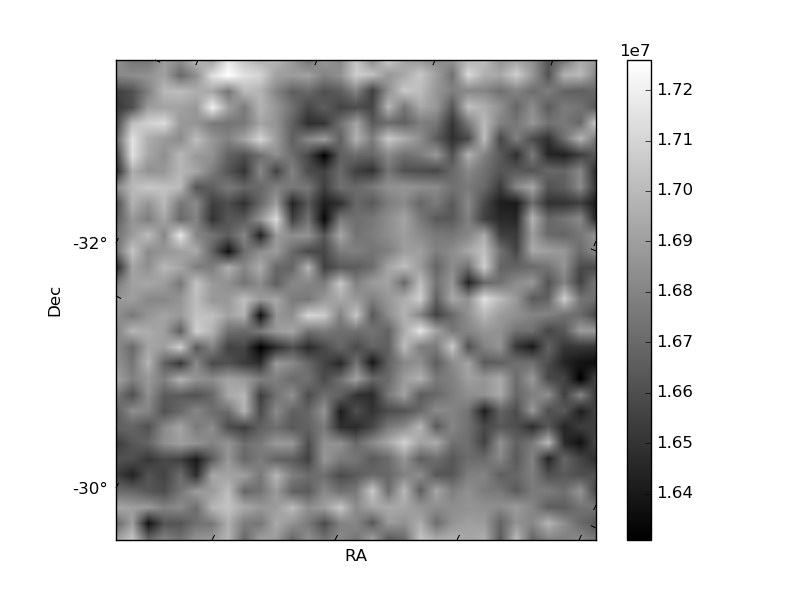
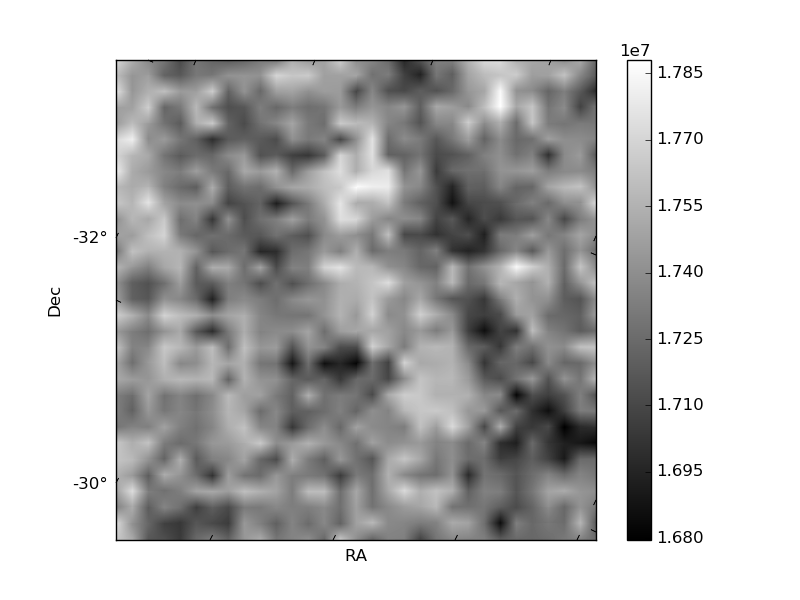
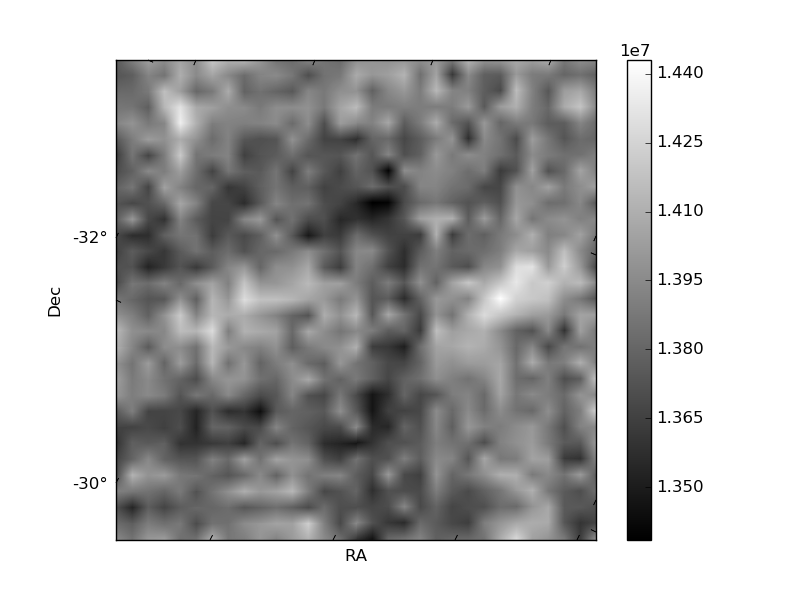
Histogram calculated using DETX and DETY for each event in the final _common_clean file
| Quadrant A | 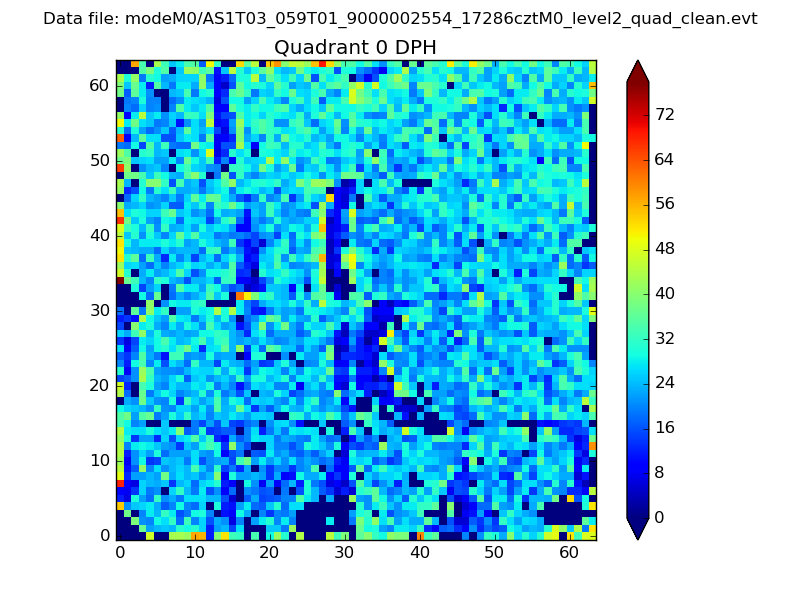 |
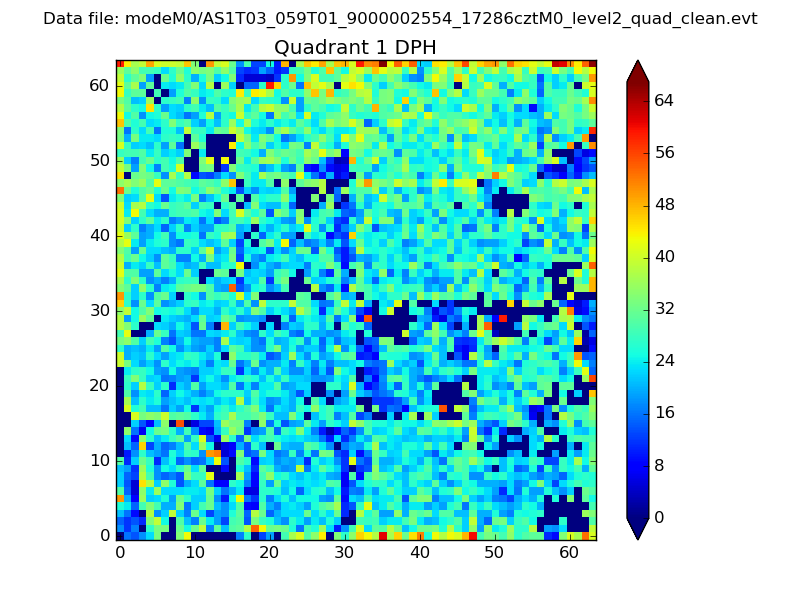 |
Quadrant B |
|---|---|---|---|
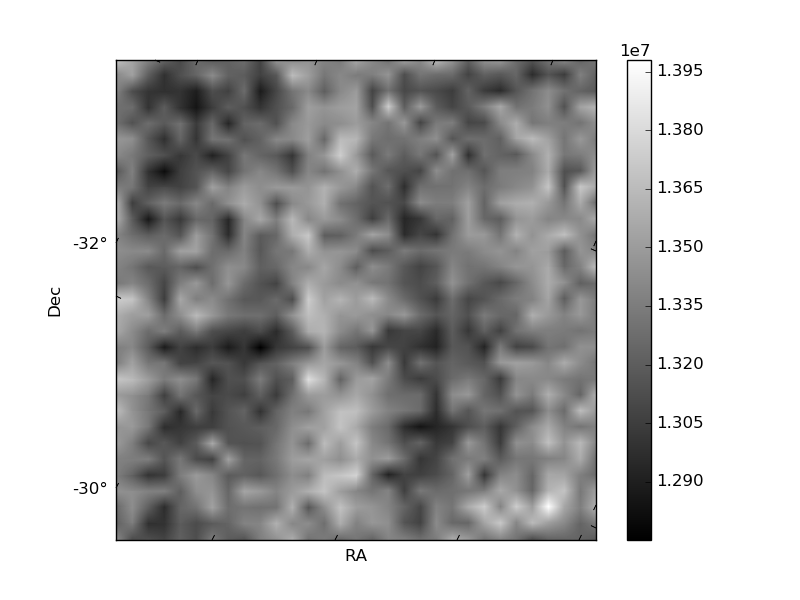
| Quadrant D | 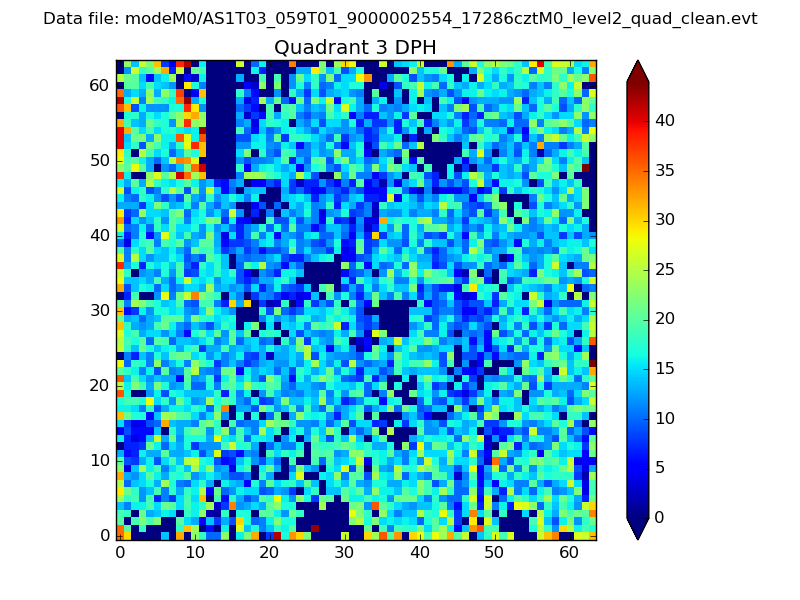 |
 |
Quadrant C |
| Plot type | Count rate plots | Images |
|---|---|---|
| Comparison with Poisson distribution Blue bars denote a histogram of data divided into 1 sec bins. Red curve is a Poisson curve with rate = median count rate of data. |
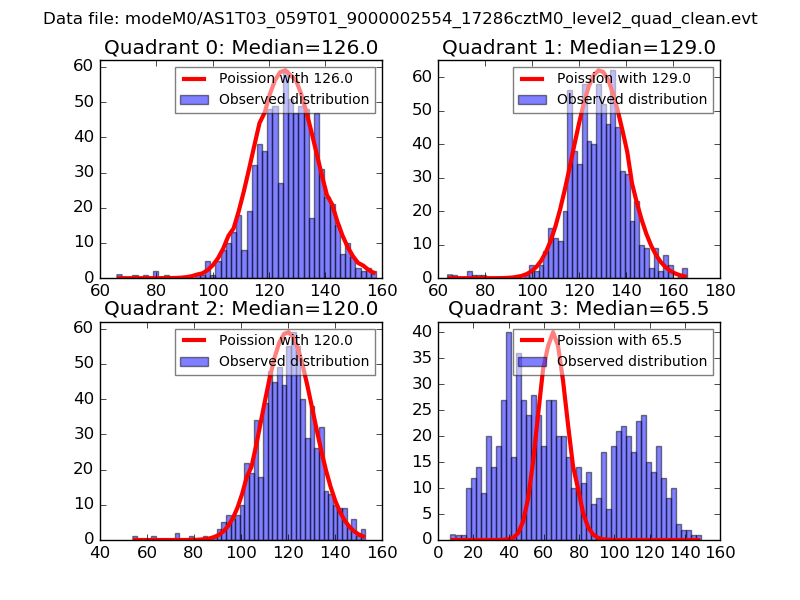 |
 |
| Quadrant-wise count rates Data is divided into 100 sec bins |
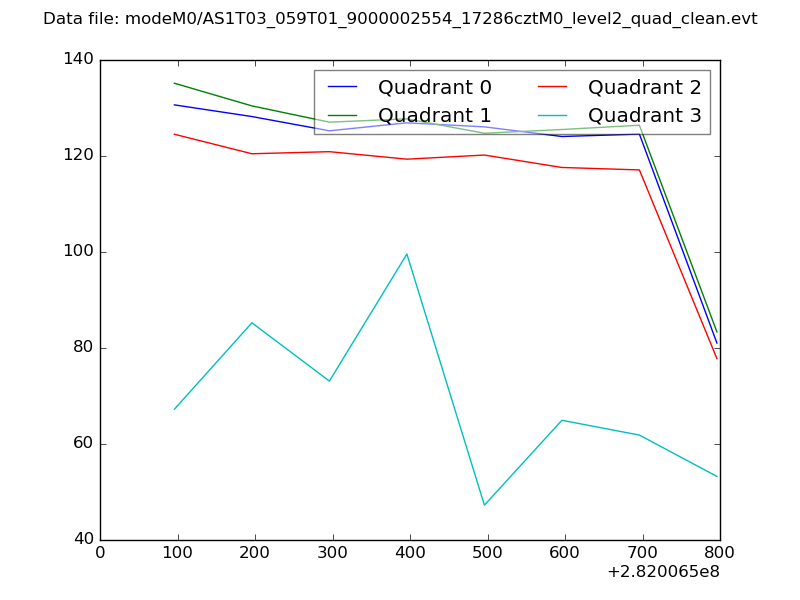 |
|
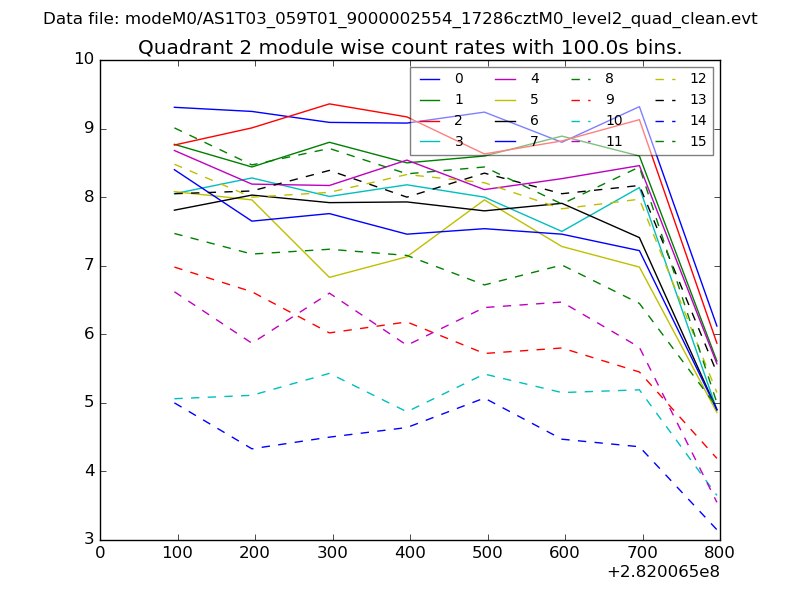
| Module-wise count rates for Quadrant A Data is divided into 100 sec bins |
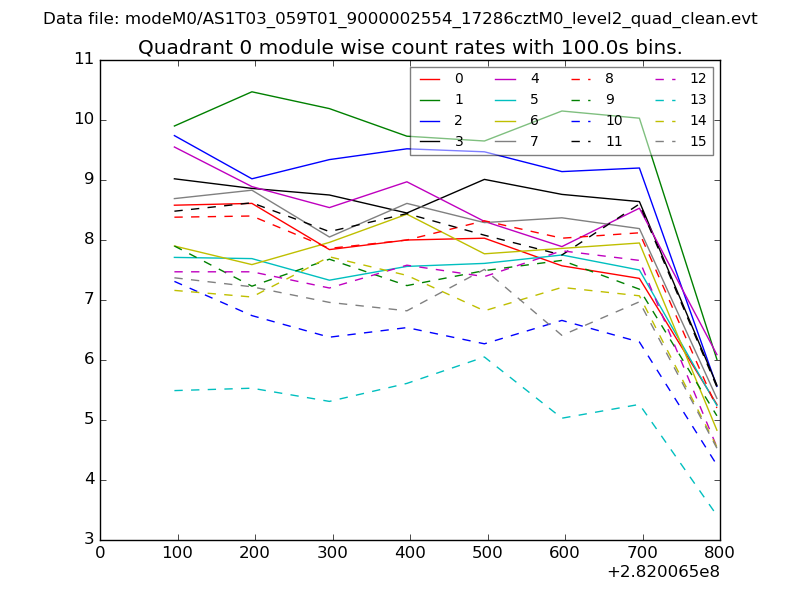 |
 |
| Module-wise count rates for Quadrant B Data is divided into 100 sec bins |
 |
 |
| Module-wise count rates for Quadrant C Data is divided into 100 sec bins |
 |
 |
| Module-wise count rates for Quadrant D Data is divided into 100 sec bins |
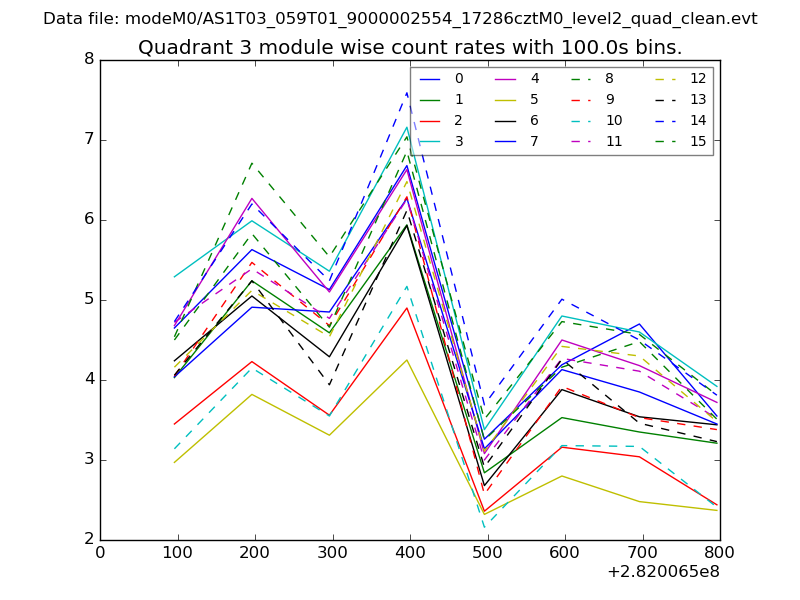 |
 |
| Parameter | Plot |
|---|---|
| CZT HV Monitor |  |
| D_VDD | 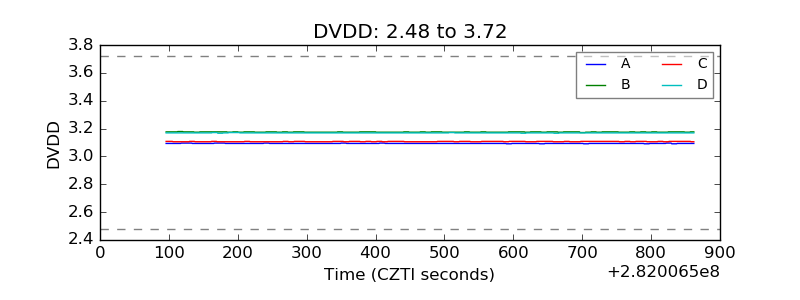 |
| Temperature 1 | 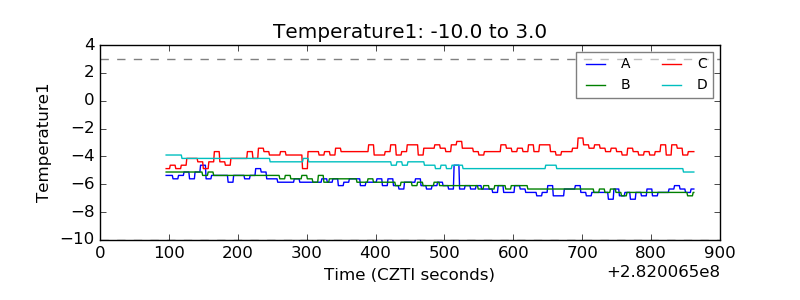 |
| Veto HV Monitor | 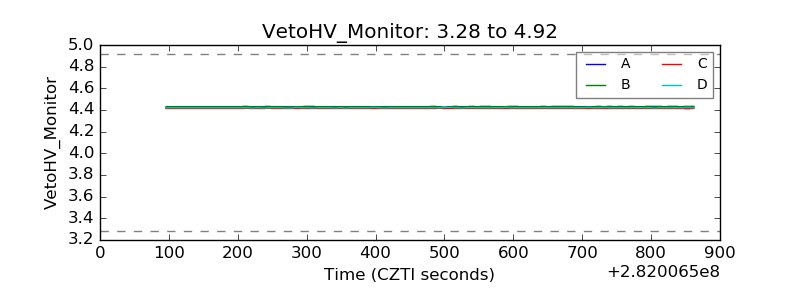 |
| Veto LLD |  |
| Alpha Counter | 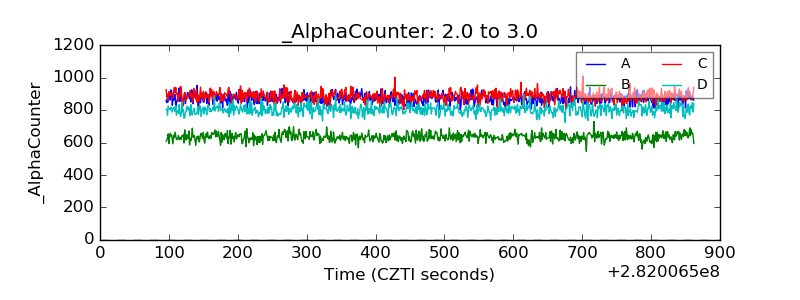 |
| _CPM_Rate | 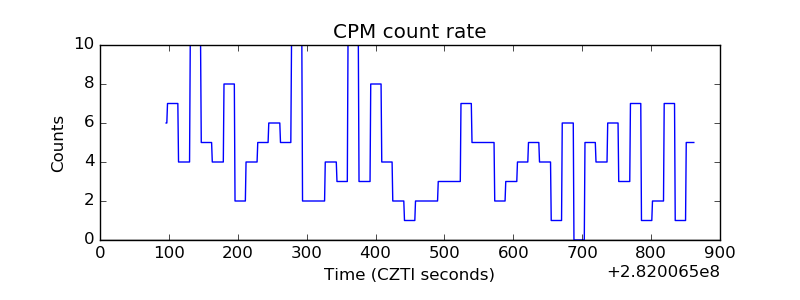 |
| CZT Counter | 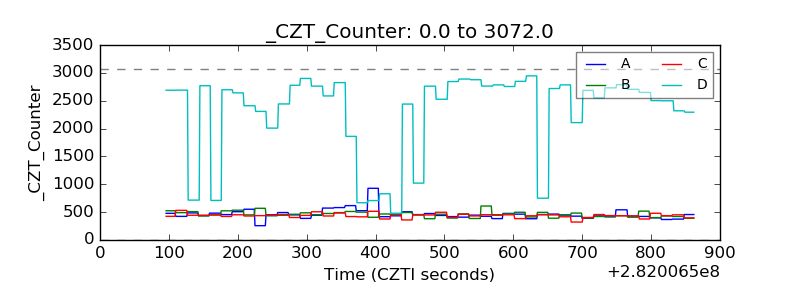 |
| +2.5 Volts monitor |  |
| +5 Volts monitor |  |
| _ROLL_ROT |  |
| _Roll_DEC | 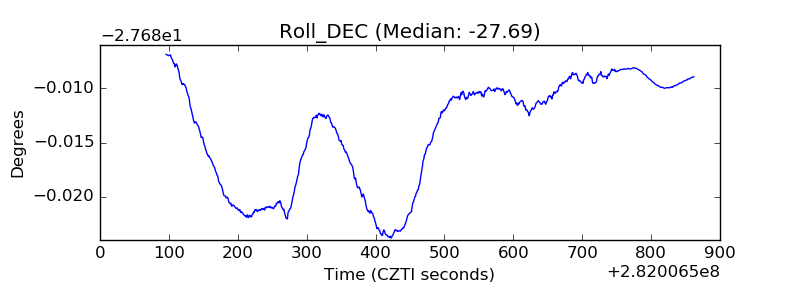 |
| _Roll_RA | 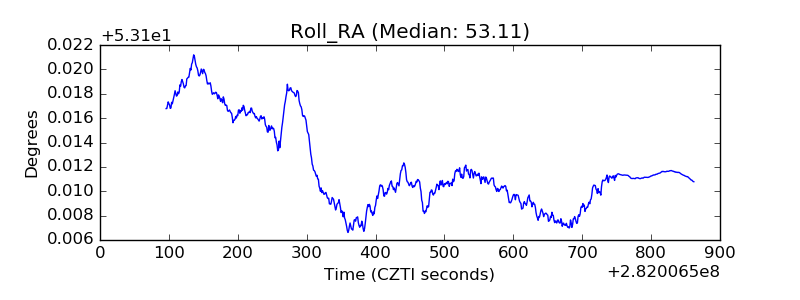 |
| Veto Counter |  |