| Param | Original file | Final file |
|---|---|---|
| Filename | modeM0/AS1A05_010T02_9000002556cztM0_level2.fits | modeM0/AS1A05_010T02_9000002556cztM0_level2_quad_clean.evt |
| Size (bytes) | 1,744,153,920 | 1,735,853,760 |
| Size | 1.6 GB | 1.6 GB |
| Events in quadrant A | 10,724,606 | 10,661,682 |
| Events in quadrant B | 10,348,894 | 10,578,015 |
| Events in quadrant C | 10,315,710 | 9,885,572 |
| Events in quadrant D | 8,833,676 | 8,852,802 |
| Mode M0 | |||
|---|---|---|---|
| Quadrant | BADHDUFLAG | Total packets | Discarded packets |
| A | 0 | 384183 | 0 |
| B | 0 | 380364 | 0 |
| C | 0 | 379075 | 0 |
| D | 0 | 500565 | 0 |
| Mode M9 | |||
|---|---|---|---|
| Quadrant | BADHDUFLAG | Total packets | Discarded packets |
| A | 0 | 271 | 0 |
| B | 0 | 271 | 0 |
| C | 0 | 271 | 0 |
| D | 0 | 271 | 0 |
| Mode SS | |||
|---|---|---|---|
| Quadrant | BADHDUFLAG | Total packets | Discarded packets |
| A | 0 | 3736 | 0 |
| B | 0 | 3736 | 0 |
| C | 0 | 3736 | 0 |
| D | 0 | 3736 | 0 |
| Quadrant | Total seconds | Saturated seconds | Saturation percentage |
|---|---|---|---|
| A | 183887 | 1830 | 0.995176% |
| B | 183887 | 2110 | 1.147444% |
| C | 183887 | 2490 | 1.354092% |
| D | 183887 | 10490 | 5.704590% |
Noise dominated data is calculated using 1-second bins in cleaned event files. If a bin has >2000 counts, and if more than 50% of those come from <1% of pixels, then it is considered to be noise-dominated and hence unusable.
| Quadrant | # 1 sec bins | Bins with >0 counts | Bins with >2000 counts | High rate bins dominated by noise | Noise dominated (total time) | Noise dominated (detector-on time) | Marked lightcurve |
|---|---|---|---|---|---|---|---|
| A | 210718 | 183880 | 0 | 0 | 0.00% | 0.00% |  |
| B | 210718 | 183880 | 0 | 0 | 0.00% | 0.00% |  |
| C | 210718 | 183879 | 0 | 0 | 0.00% | 0.00% |  |
| D | 210718 | 183824 | 0 | 0 | 0.00% | 0.00% |  |
Top three noisy pixels from each quadrant. If the there are fewer than three noisy pixels in the level2.evt file, extra rows are filled as -1
| Pixel properties | Quadrant properties | ||||||
|---|---|---|---|---|---|---|---|
| Quadrant | DetID | PixID | Counts | Sigma | Mean | Median | Sigma |
| A | 0 | 29 | 9022 | 9.24 | 2793 | 2617 | 693.4 |
| A | 7 | 110 | 8596 | 8.62 | 2793 | 2617 | 693.4 |
| A | 9 | 19 | 8211 | 8.07 | 2793 | 2617 | 693.4 |
| B | 2 | 9 | 8234 | 10.6 | 2727 | 2600 | 531.5 |
| B | 2 | 8 | 6945 | 8.17 | 2727 | 2600 | 531.5 |
| B | 3 | 17 | 6786 | 7.87 | 2727 | 2600 | 531.5 |
| C | 12 | 241 | 7307 | 6.82 | 2726 | 2536 | 699.1 |
| C | 3 | 126 | 6930 | 6.28 | 2726 | 2536 | 699.1 |
| C | 2 | 191 | 6913 | 6.26 | 2726 | 2536 | 699.1 |
| D | 3 | 14 | 6659 | 6.48 | 2523 | 2295 | 673.8 |
| D | 7 | 3 | 6273 | 5.9 | 2523 | 2295 | 673.8 |
| D | 10 | 189 | 6180 | 5.77 | 2523 | 2295 | 673.8 |
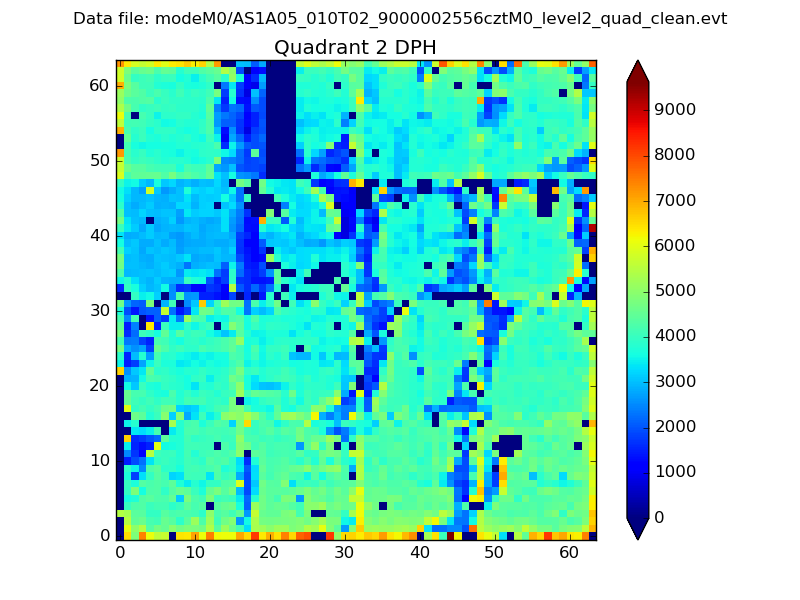
Histogram calculated using DETX and DETY for each event in the final _common_clean file
| Quadrant A |  |
 |
Quadrant B |
|---|---|---|---|
| Quadrant D | 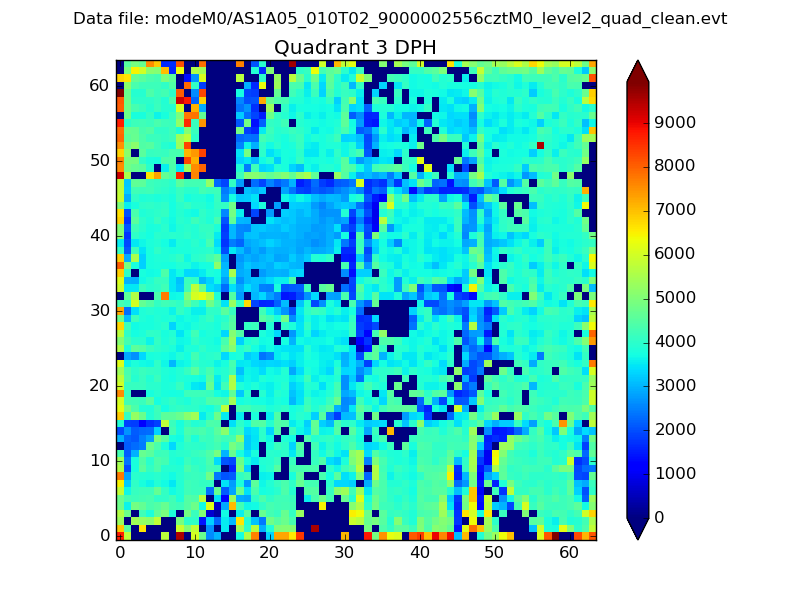 |
 |
Quadrant C |
| Plot type | Count rate plots | Images |
|---|---|---|
| Comparison with Poisson distribution Blue bars denote a histogram of data divided into 1 sec bins. Red curve is a Poisson curve with rate = median count rate of data. |
 |
 |
| Quadrant-wise count rates Data is divided into 100 sec bins |
 |
|
| Module-wise count rates for Quadrant A Data is divided into 100 sec bins |
 |
 |
| Module-wise count rates for Quadrant B Data is divided into 100 sec bins |
 |
 |
| Module-wise count rates for Quadrant C Data is divided into 100 sec bins |
 |
 |
| Module-wise count rates for Quadrant D Data is divided into 100 sec bins |
 |
 |
| Parameter | Plot |
|---|---|
| CZT HV Monitor |  |
| D_VDD | 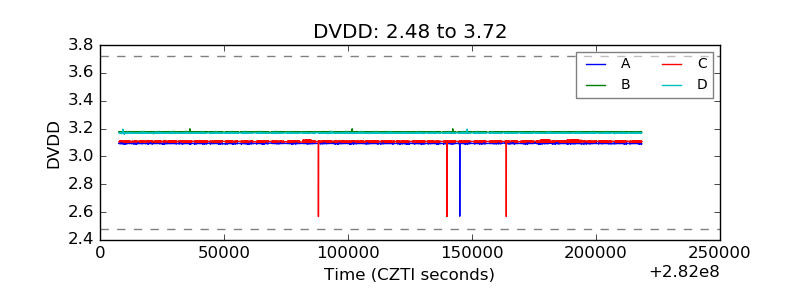 |
| Temperature 1 |  |
| Veto HV Monitor |  |
| Veto LLD |  |
| Alpha Counter |  |
| _CPM_Rate |  |
| CZT Counter |  |
| +2.5 Volts monitor |  |
| +5 Volts monitor |  |
| _ROLL_ROT |  |
| _Roll_DEC |  |
| _Roll_RA |  |
| Veto Counter |  |