| Param | Original file | Final file |
|---|---|---|
| Filename | modeM0/AS1A05_010T02_9000002556_17286cztM0_level2.evt | modeM0/AS1A05_010T02_9000002556_17286cztM0_level2_quad_clean.evt |
| Size (bytes) | 579,928,320 | 75,574,080 |
| Size | 553.1 MB | 72.1 MB |
| Events in quadrant A | 2,801,804 | 498,487 |
| Events in quadrant B | 2,812,959 | 500,079 |
| Events in quadrant C | 2,796,560 | 470,542 |
| Events in quadrant D | 8,738,911 | 393,418 |
| Mode M0 | |||
|---|---|---|---|
| Quadrant | BADHDUFLAG | Total packets | Discarded packets |
| A | 0 | 12468 | 1 |
| B | 0 | 12469 | 1 |
| C | 0 | 12360 | 1 |
| D | 0 | 30187 | 1 |
| Mode M9 | |||
|---|---|---|---|
| Quadrant | BADHDUFLAG | Total packets | Discarded packets |
| A | 0 | 5 | 0 |
| B | 0 | 5 | 0 |
| C | 0 | 5 | 0 |
| D | 0 | 5 | 0 |
| Mode SS | |||
|---|---|---|---|
| Quadrant | BADHDUFLAG | Total packets | Discarded packets |
| A | 0 | 122 | 0 |
| B | 0 | 122 | 0 |
| C | 0 | 122 | 0 |
| D | 0 | 122 | 0 |
| Quadrant | Total seconds | Saturated seconds | Saturation percentage |
|---|---|---|---|
| A | 6097 | 30 | 0.492045% |
| B | 6097 | 50 | 0.820075% |
| C | 6097 | 66 | 1.082500% |
| D | 6097 | 1857 | 30.457602% |
Noise dominated data is calculated using 1-second bins in cleaned event files. If a bin has >2000 counts, and if more than 50% of those come from <1% of pixels, then it is considered to be noise-dominated and hence unusable.
| Quadrant | # 1 sec bins | Bins with >0 counts | Bins with >2000 counts | High rate bins dominated by noise | Noise dominated (total time) | Noise dominated (detector-on time) | Marked lightcurve |
|---|---|---|---|---|---|---|---|
| A | 6532 | 6098 | 0 | 0 | 0.00% | 0.00% | 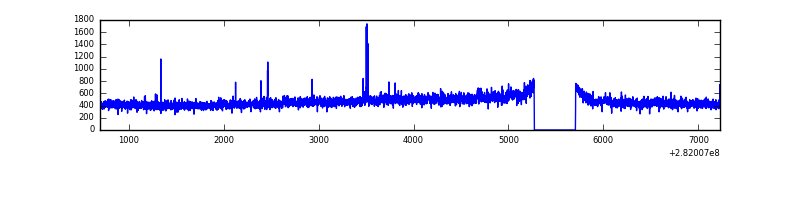 |
| B | 6532 | 6098 | 1 | 1 | 0.02% | 0.02% | 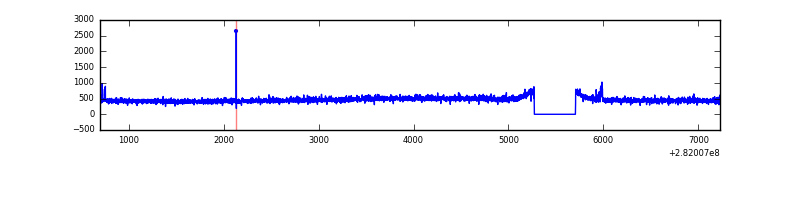 |
| C | 6532 | 6098 | 0 | 0 | 0.00% | 0.00% | 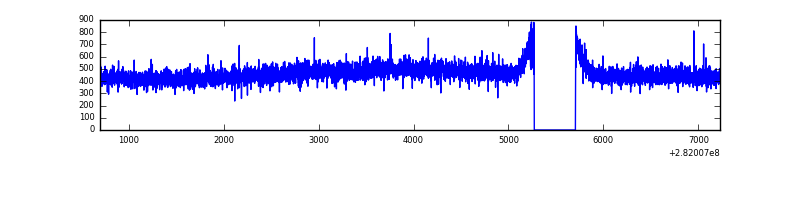 |
| D | 6532 | 6098 | 1792 | 1792 | 27.43% | 29.39% | 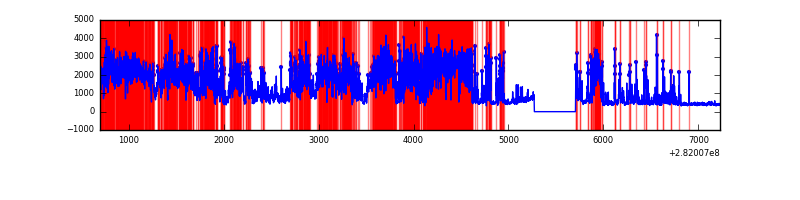 |
Top three noisy pixels from each quadrant. If the there are fewer than three noisy pixels in the level2.evt file, extra rows are filled as -1
| Pixel properties | Quadrant properties | ||||||
|---|---|---|---|---|---|---|---|
| Quadrant | DetID | PixID | Counts | Sigma | Mean | Median | Sigma |
| A | 0 | 23 | 37545 | 253.15 | 713 | 697 | 145.6 |
| A | 4 | 2 | 12762 | 82.89 | 713 | 697 | 145.6 |
| A | 0 | 13 | 9432 | 60.01 | 713 | 697 | 145.6 |
| B | 12 | 111 | 16872 | 117.94 | 713 | 695 | 137.2 |
| B | 11 | 111 | 14645 | 101.7 | 713 | 695 | 137.2 |
| B | 0 | 230 | 13595 | 94.05 | 713 | 695 | 137.2 |
| C | 14 | 238 | 103505 | 637.08 | 682 | 685 | 161.4 |
| C | 3 | 233 | 33751 | 204.88 | 682 | 685 | 161.4 |
| C | 13 | 61 | 4844 | 25.77 | 682 | 685 | 161.4 |
| D | 11 | 176 | 6026360 | 39695.79 | 620 | 600 | 151.8 |
| D | 13 | 232 | 172855 | 1134.76 | 620 | 600 | 151.8 |
| D | 10 | 70 | 130802 | 857.73 | 620 | 600 | 151.8 |
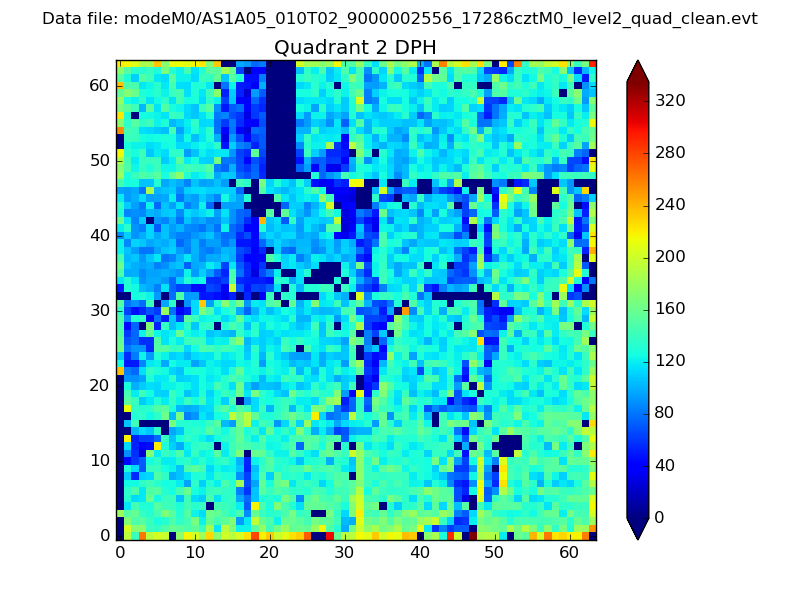
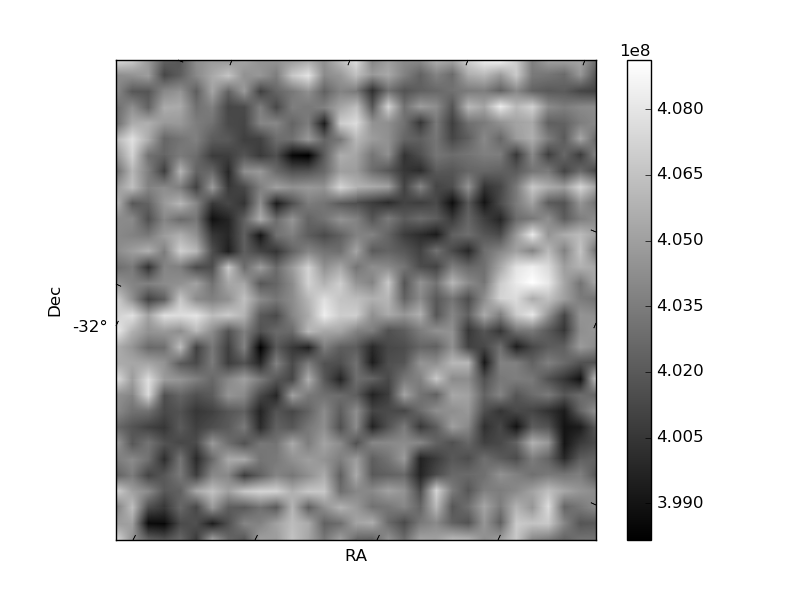
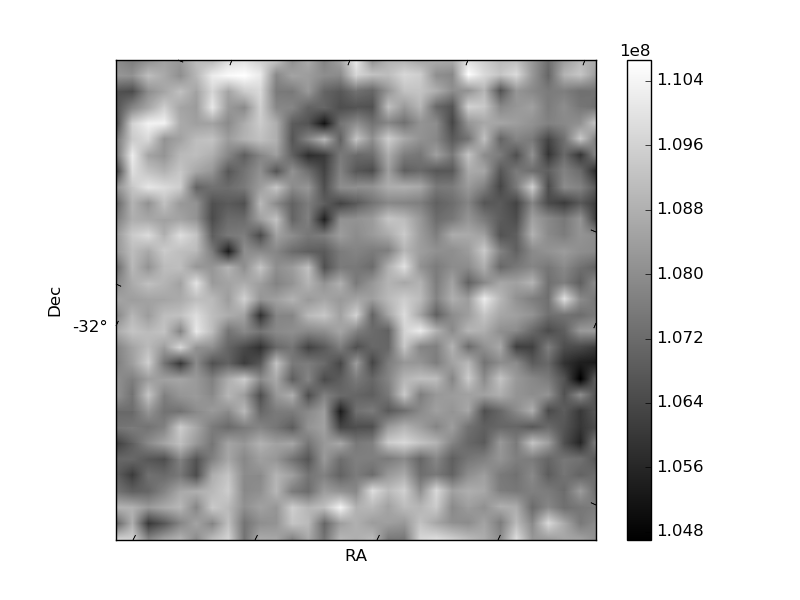
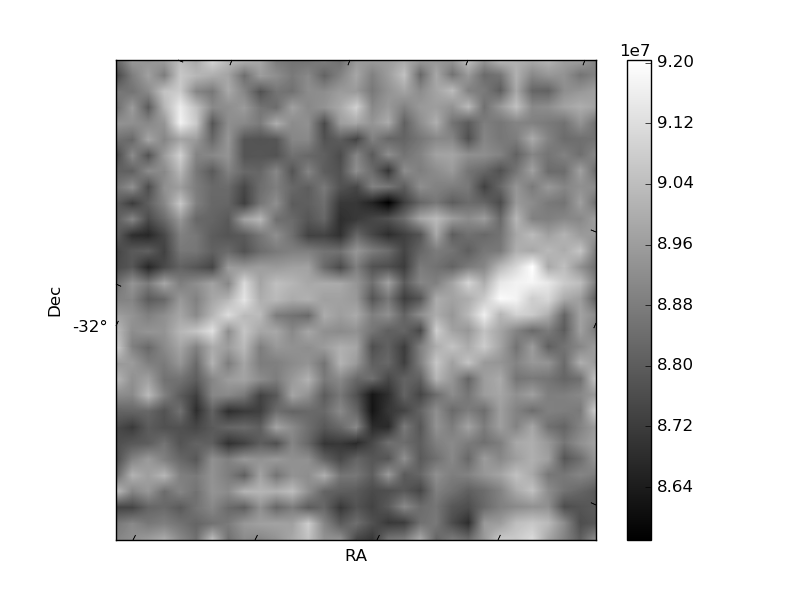
Histogram calculated using DETX and DETY for each event in the final _common_clean file
| Quadrant A | 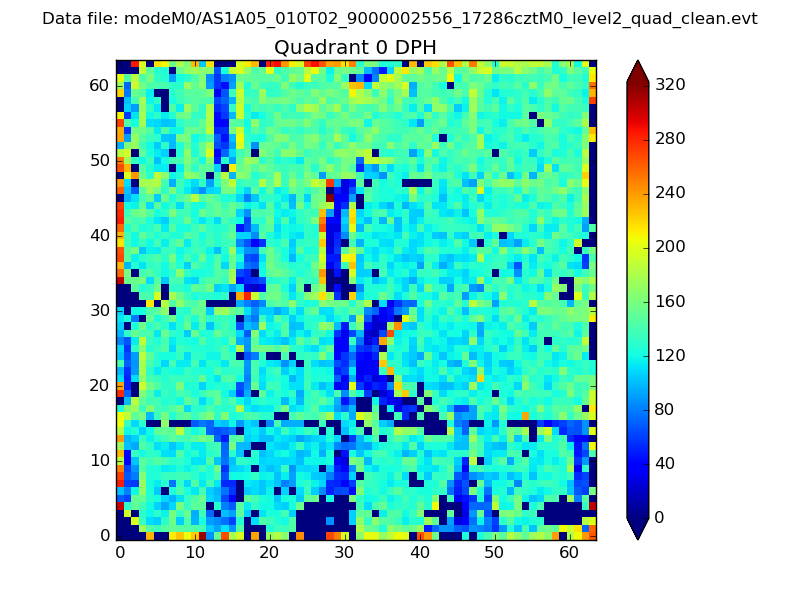 |
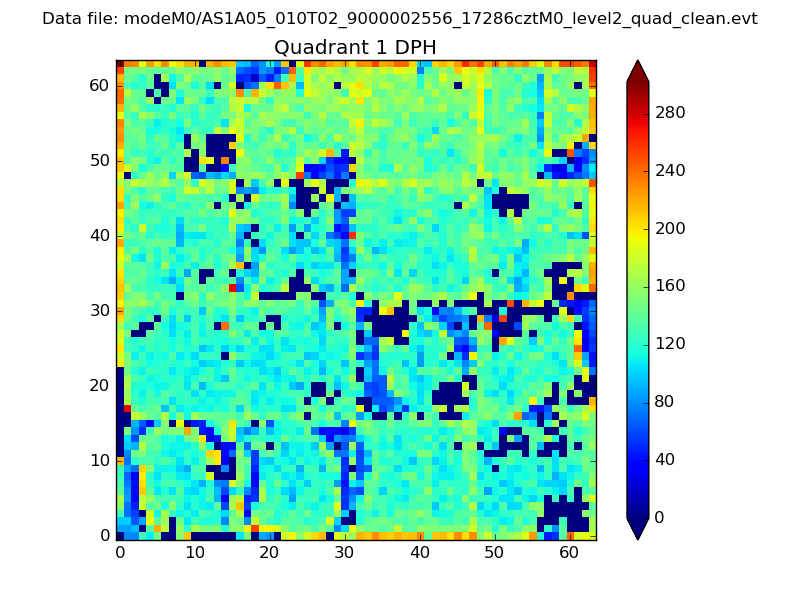 |
Quadrant B |
|---|---|---|---|
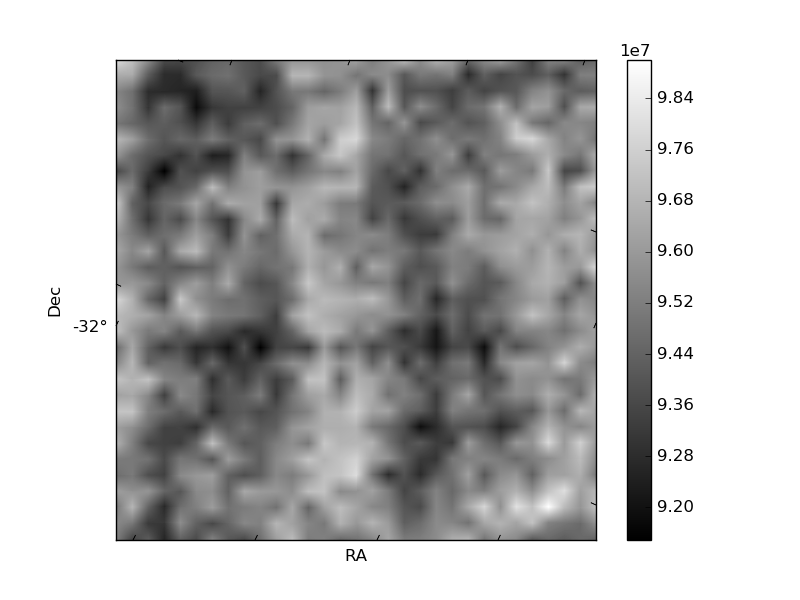
| Quadrant D | 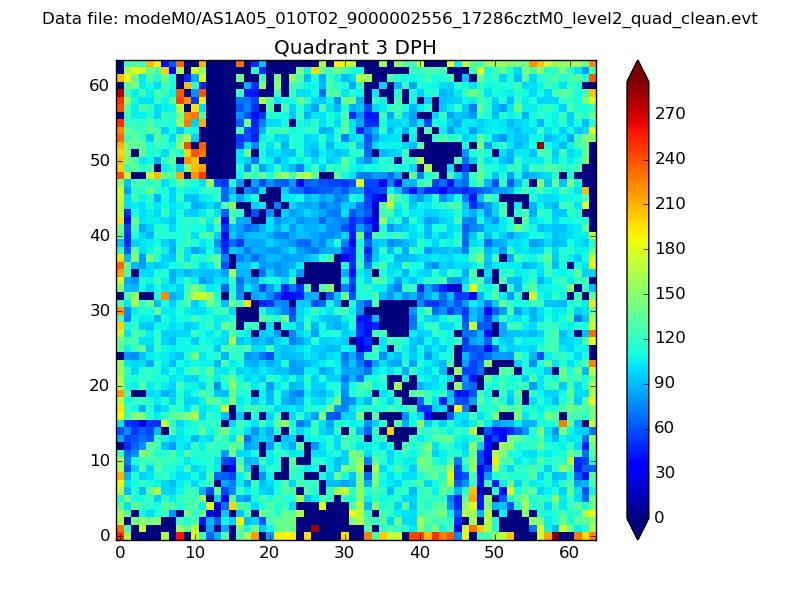 |
 |
Quadrant C |
| Plot type | Count rate plots | Images |
|---|---|---|
| Comparison with Poisson distribution Blue bars denote a histogram of data divided into 1 sec bins. Red curve is a Poisson curve with rate = median count rate of data. |
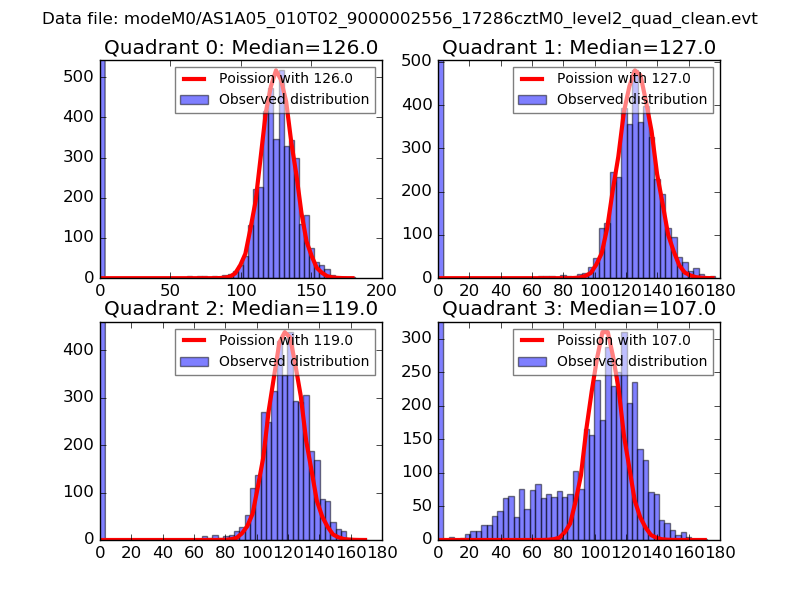 |
 |
| Quadrant-wise count rates Data is divided into 100 sec bins |
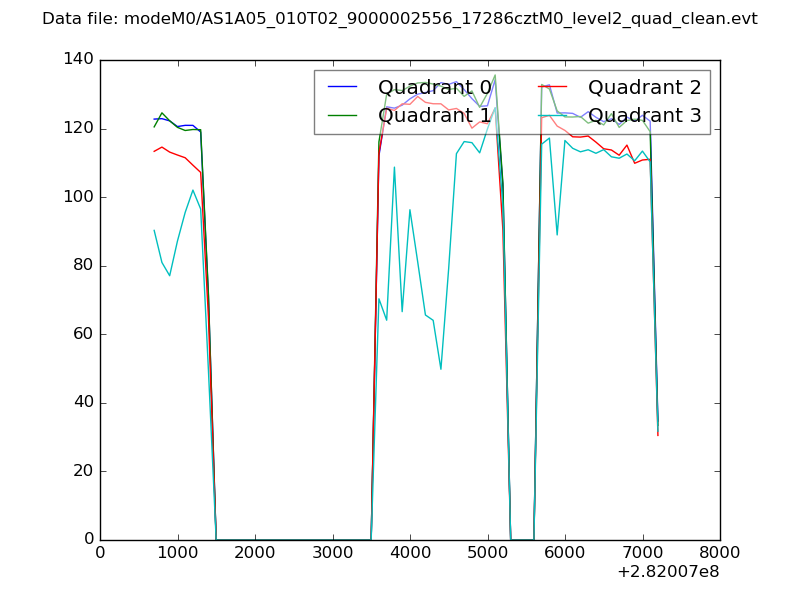 |
|
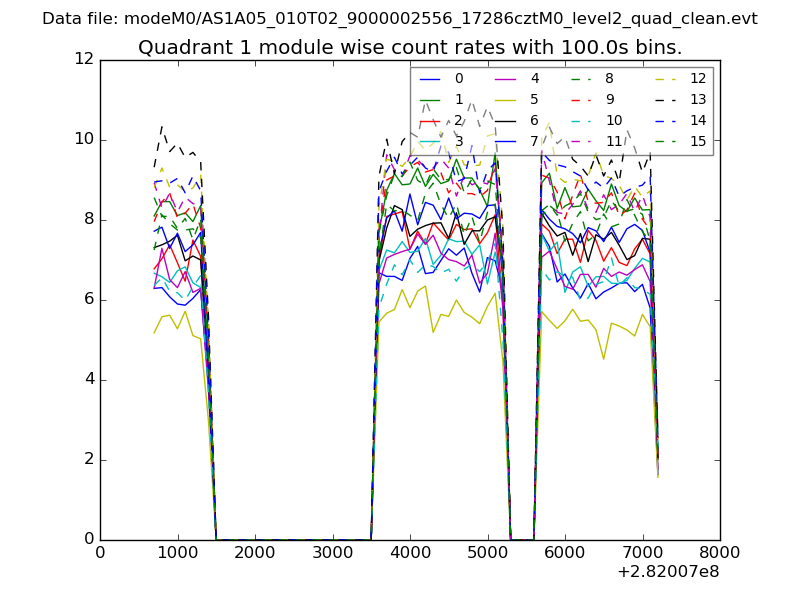
| Module-wise count rates for Quadrant A Data is divided into 100 sec bins |
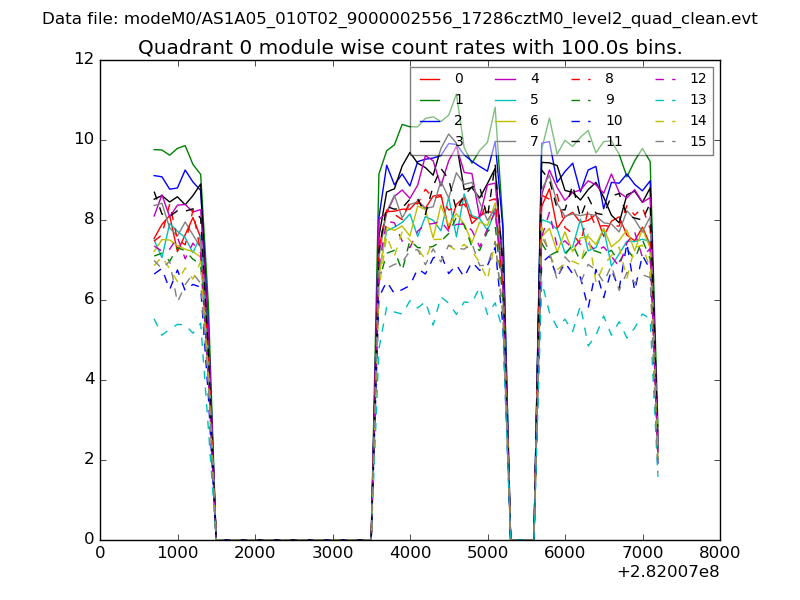 |
 |
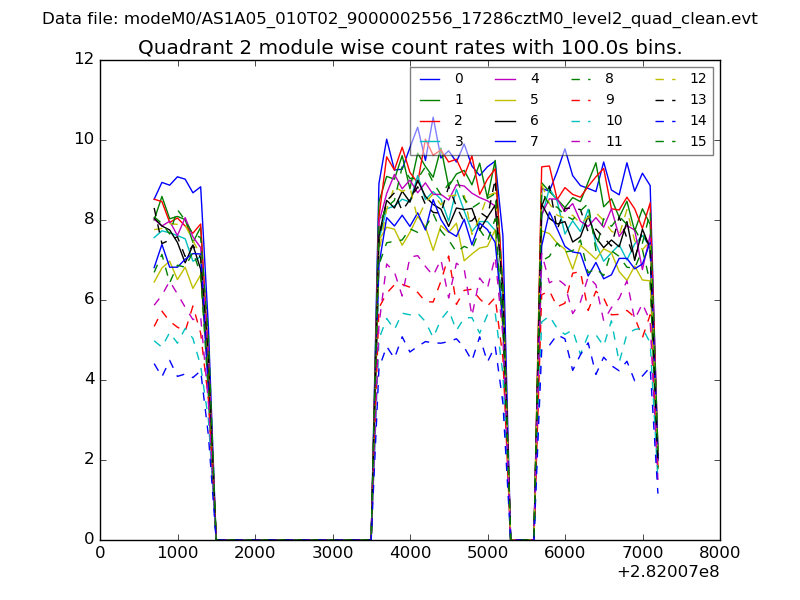
| Module-wise count rates for Quadrant B Data is divided into 100 sec bins |
 |
 |
| Module-wise count rates for Quadrant C Data is divided into 100 sec bins |
 |
 |
| Module-wise count rates for Quadrant D Data is divided into 100 sec bins |
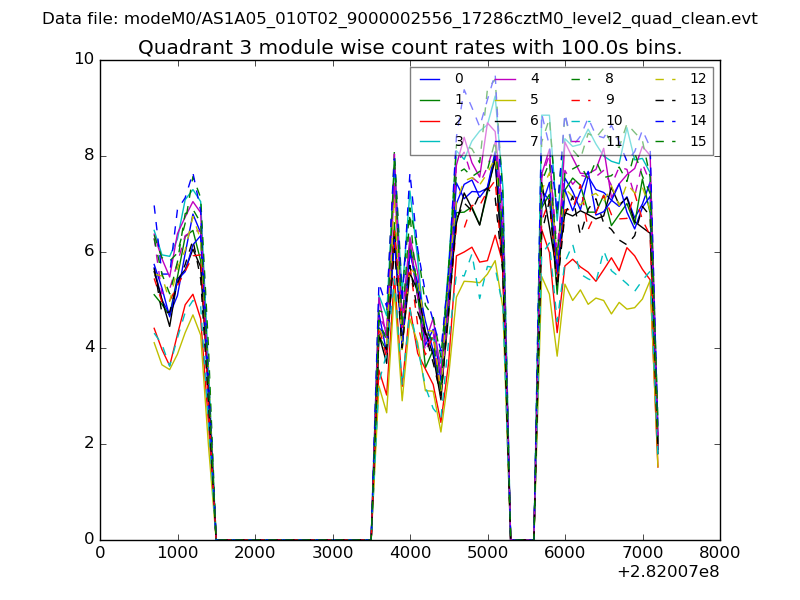 |
 |
| Parameter | Plot |
|---|---|
| CZT HV Monitor | 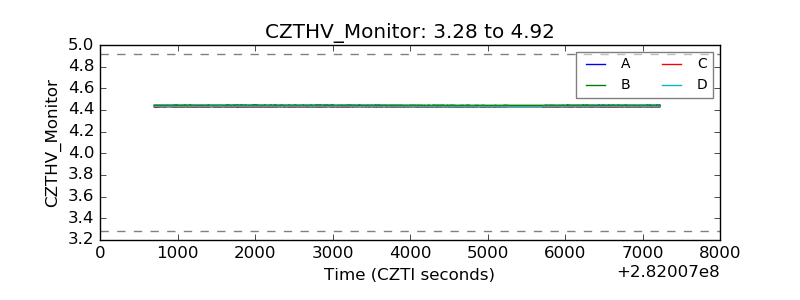 |
| D_VDD | 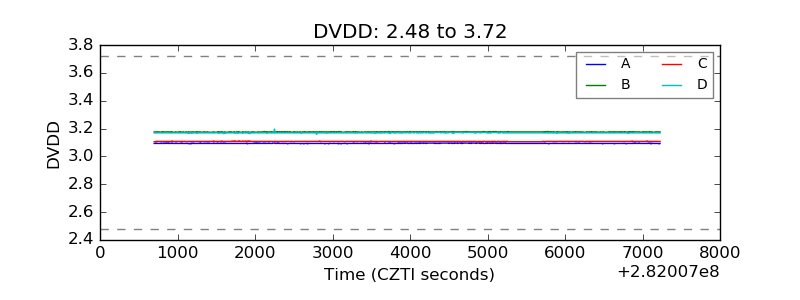 |
| Temperature 1 |  |
| Veto HV Monitor | 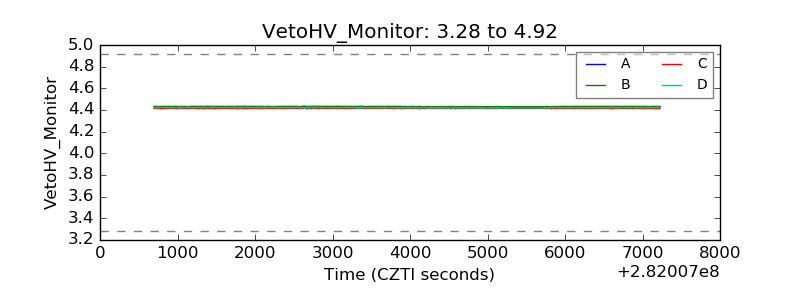 |
| Veto LLD | 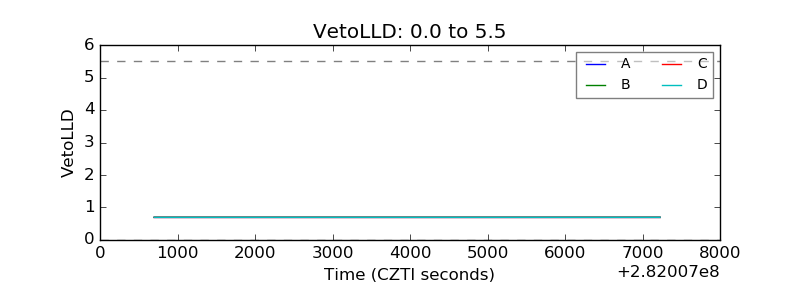 |
| Alpha Counter | 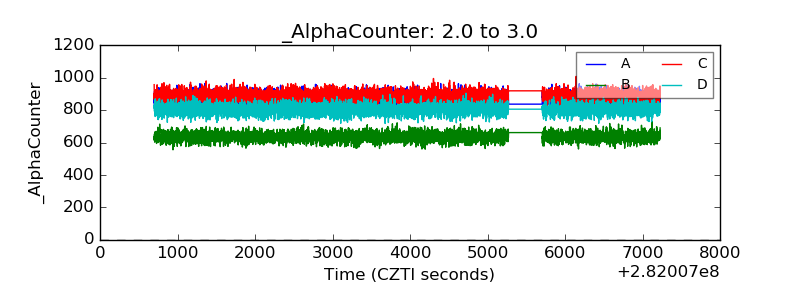 |
| _CPM_Rate | 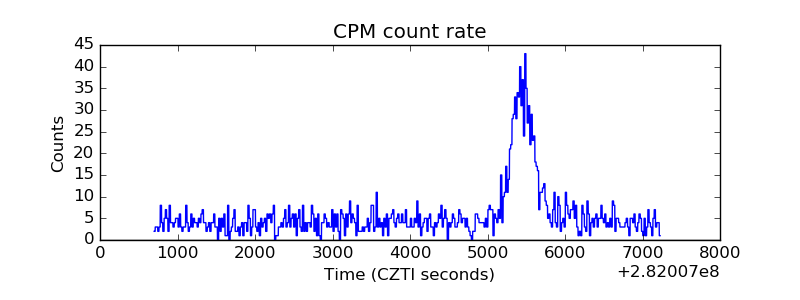 |
| CZT Counter | 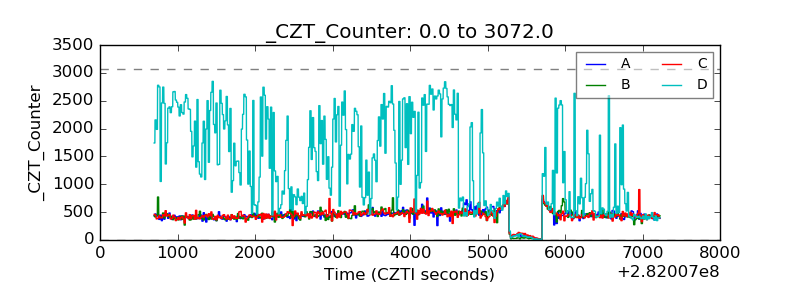 |
| +2.5 Volts monitor |  |
| +5 Volts monitor |  |
| _ROLL_ROT | 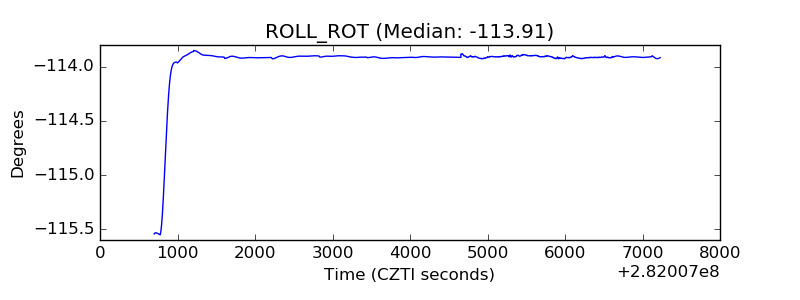 |
| _Roll_DEC | 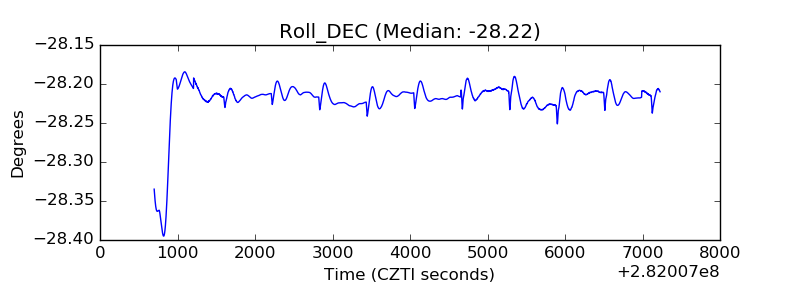 |
| _Roll_RA | 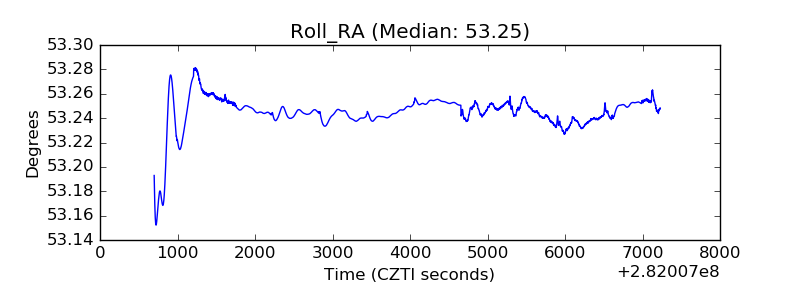 |
| Veto Counter | 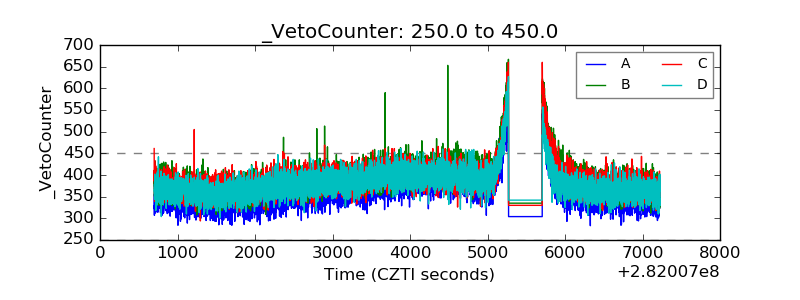 |