| Param | Original file | Final file |
|---|---|---|
| Filename | modeM0/AS1A05_010T02_9000002556_17287cztM0_level2.evt | modeM0/AS1A05_010T02_9000002556_17287cztM0_level2_quad_clean.evt |
| Size (bytes) | 799,179,840 | 111,277,440 |
| Size | 762.2 MB | 106.1 MB |
| Events in quadrant A | 4,754,465 | 755,373 |
| Events in quadrant B | 3,959,848 | 758,700 |
| Events in quadrant C | 3,949,535 | 718,869 |
| Events in quadrant D | 10,965,922 | 547,546 |
| Mode M0 | |||
|---|---|---|---|
| Quadrant | BADHDUFLAG | Total packets | Discarded packets |
| A | 0 | 19941 | 2 |
| B | 0 | 17433 | 2 |
| C | 0 | 17338 | 2 |
| D | 0 | 38525 | 2 |
| Mode M9 | |||
|---|---|---|---|
| Quadrant | BADHDUFLAG | Total packets | Discarded packets |
| A | 0 | 9 | 0 |
| B | 0 | 9 | 0 |
| C | 0 | 9 | 0 |
| D | 0 | 9 | 0 |
| Mode SS | |||
|---|---|---|---|
| Quadrant | BADHDUFLAG | Total packets | Discarded packets |
| A | 0 | 174 | 0 |
| B | 0 | 174 | 0 |
| C | 0 | 174 | 0 |
| D | 0 | 174 | 0 |
| Quadrant | Total seconds | Saturated seconds | Saturation percentage |
|---|---|---|---|
| A | 8475 | 103 | 1.215339% |
| B | 8476 | 127 | 1.498348% |
| C | 8475 | 166 | 1.958702% |
| D | 8475 | 2678 | 31.598820% |
Noise dominated data is calculated using 1-second bins in cleaned event files. If a bin has >2000 counts, and if more than 50% of those come from <1% of pixels, then it is considered to be noise-dominated and hence unusable.
| Quadrant | # 1 sec bins | Bins with >0 counts | Bins with >2000 counts | High rate bins dominated by noise | Noise dominated (total time) | Noise dominated (detector-on time) | Marked lightcurve |
|---|---|---|---|---|---|---|---|
| A | 9210 | 8480 | 3 | 3 | 0.03% | 0.04% | 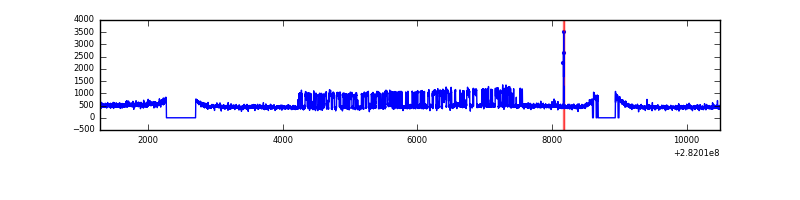 |
| B | 9211 | 8481 | 0 | 0 | 0.00% | 0.00% | 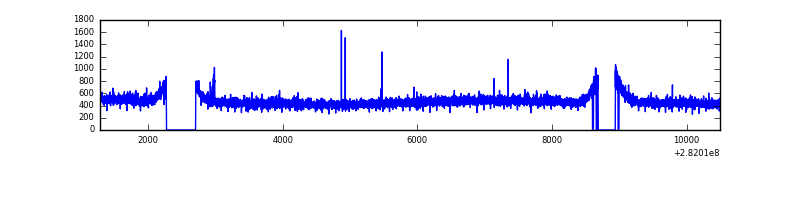 |
| C | 9210 | 8480 | 0 | 0 | 0.00% | 0.00% | 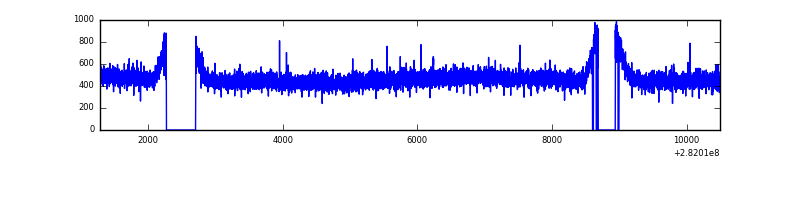 |
| D | 9210 | 8476 | 2369 | 2369 | 25.72% | 27.95% |  |
Top three noisy pixels from each quadrant. If the there are fewer than three noisy pixels in the level2.evt file, extra rows are filled as -1
| Pixel properties | Quadrant properties | ||||||
|---|---|---|---|---|---|---|---|
| Quadrant | DetID | PixID | Counts | Sigma | Mean | Median | Sigma |
| A | 0 | 23 | 811165 | 3950.95 | 1006 | 984 | 205.1 |
| A | 0 | 226 | 57758 | 276.87 | 1006 | 984 | 205.1 |
| A | 15 | 174 | 18214 | 84.02 | 1006 | 984 | 205.1 |
| B | 12 | 111 | 24026 | 118.67 | 1006 | 980 | 194.2 |
| B | 11 | 111 | 20623 | 101.14 | 1006 | 980 | 194.2 |
| B | 14 | 111 | 17984 | 87.56 | 1006 | 980 | 194.2 |
| C | 14 | 238 | 145284 | 637.28 | 961 | 966 | 226.5 |
| C | 3 | 233 | 61136 | 265.7 | 961 | 966 | 226.5 |
| C | 13 | 61 | 6761 | 25.59 | 961 | 966 | 226.5 |
| D | 11 | 176 | 6973401 | 34186.58 | 831 | 806 | 204.0 |
| D | 13 | 232 | 482846 | 2363.44 | 831 | 806 | 204.0 |
| D | 10 | 70 | 304189 | 1487.48 | 831 | 806 | 204.0 |
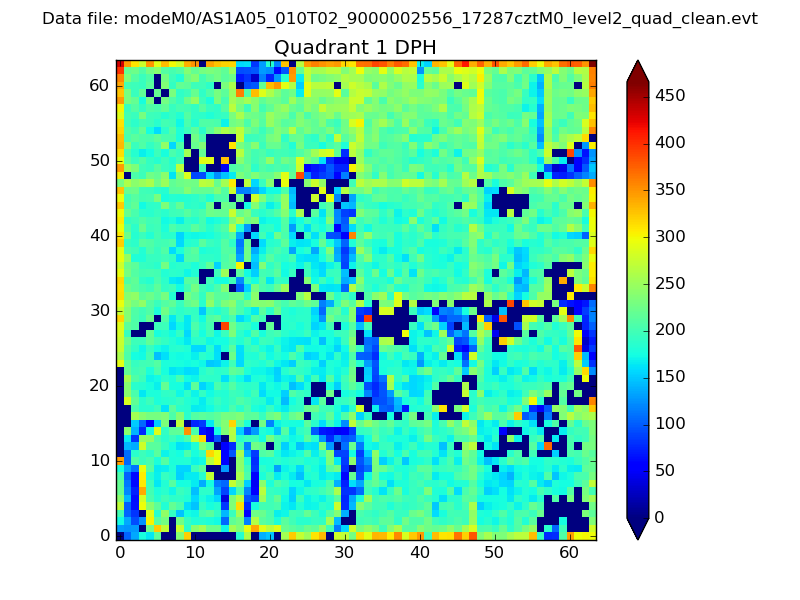
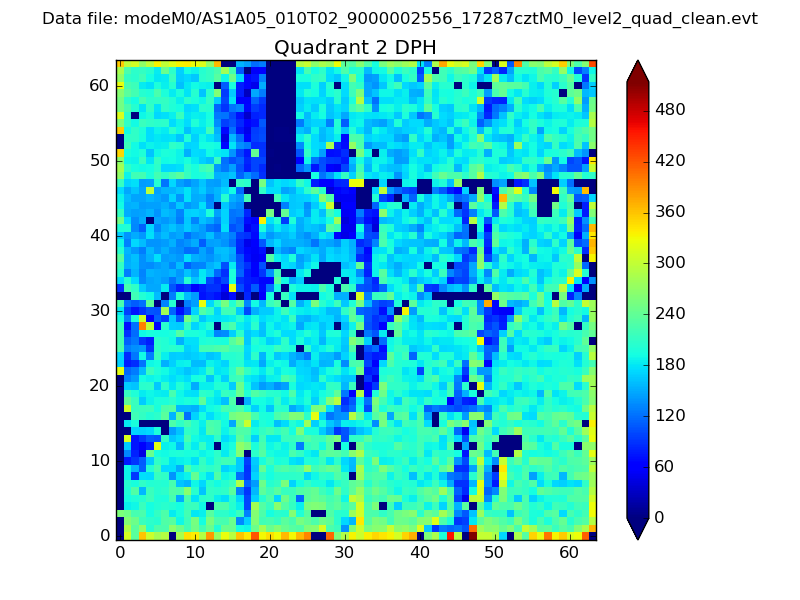
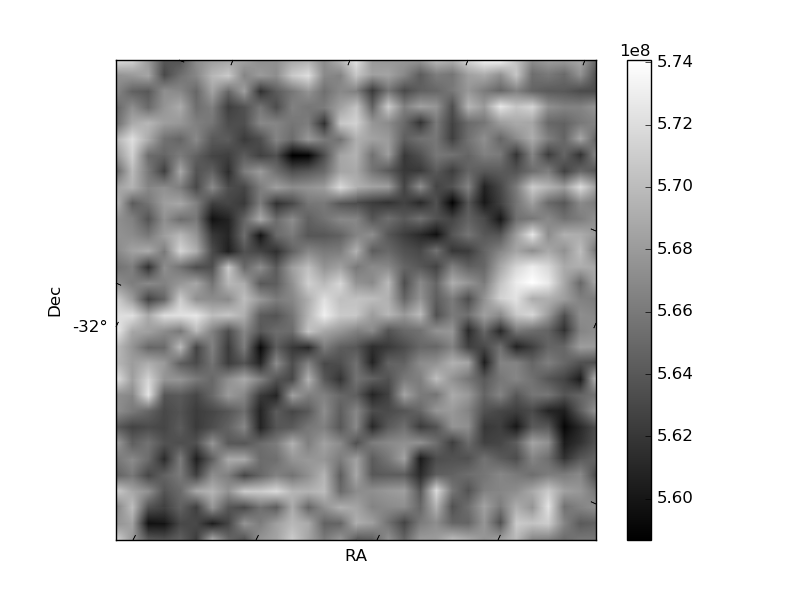
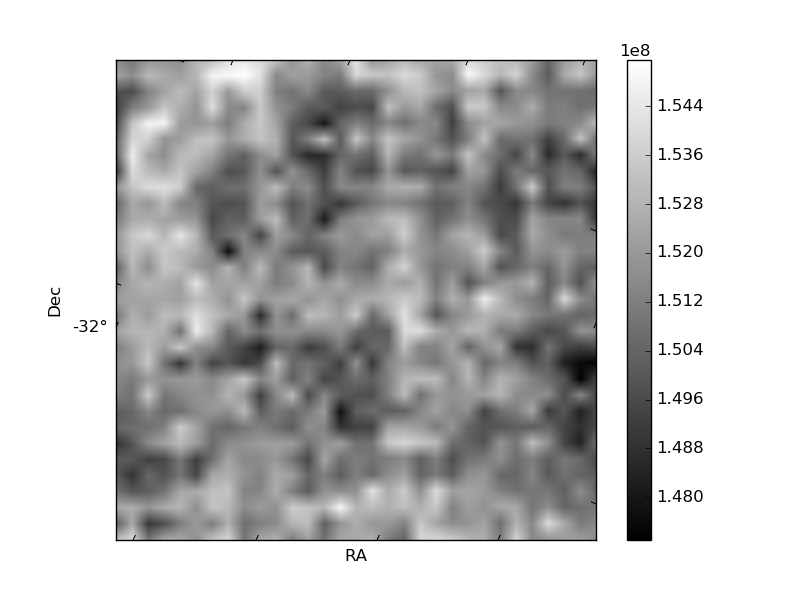
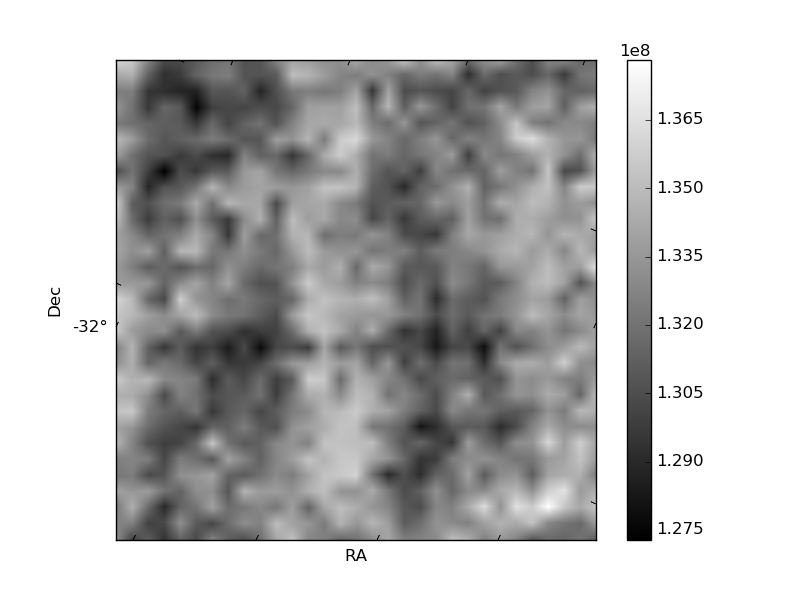
Histogram calculated using DETX and DETY for each event in the final _common_clean file
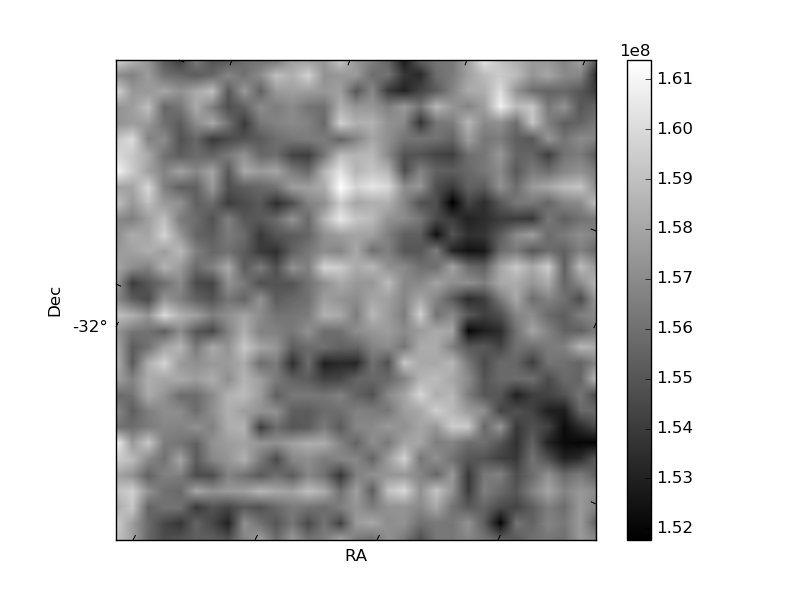
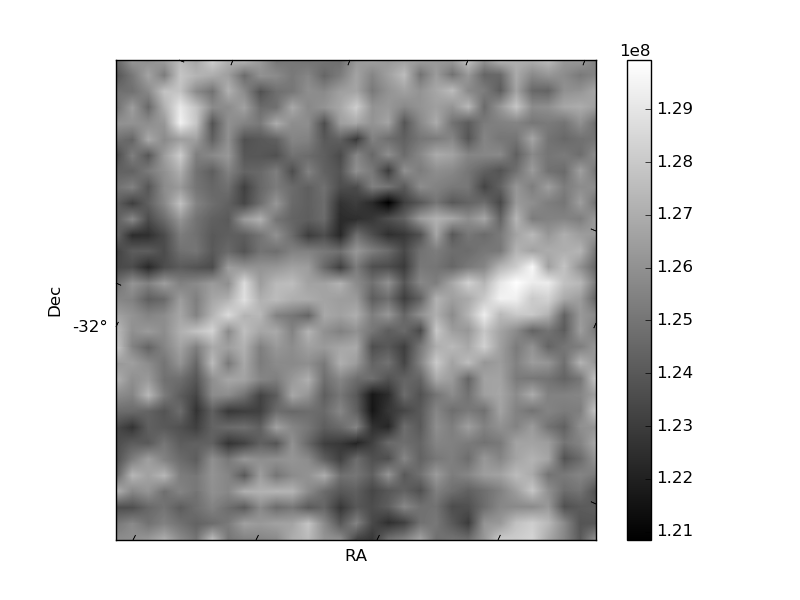
| Quadrant A | 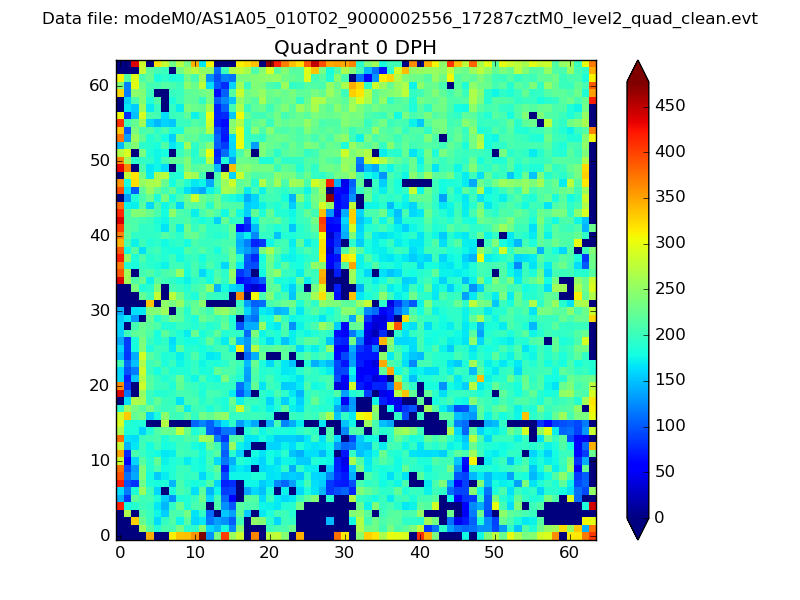 |
 |
Quadrant B |
|---|---|---|---|
| Quadrant D | 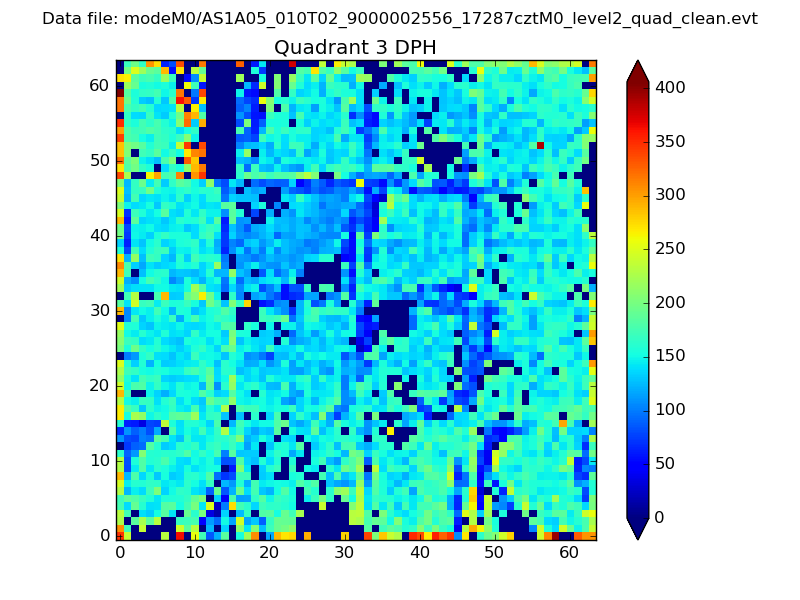 |
 |
Quadrant C |
| Plot type | Count rate plots | Images |
|---|---|---|
| Comparison with Poisson distribution Blue bars denote a histogram of data divided into 1 sec bins. Red curve is a Poisson curve with rate = median count rate of data. |
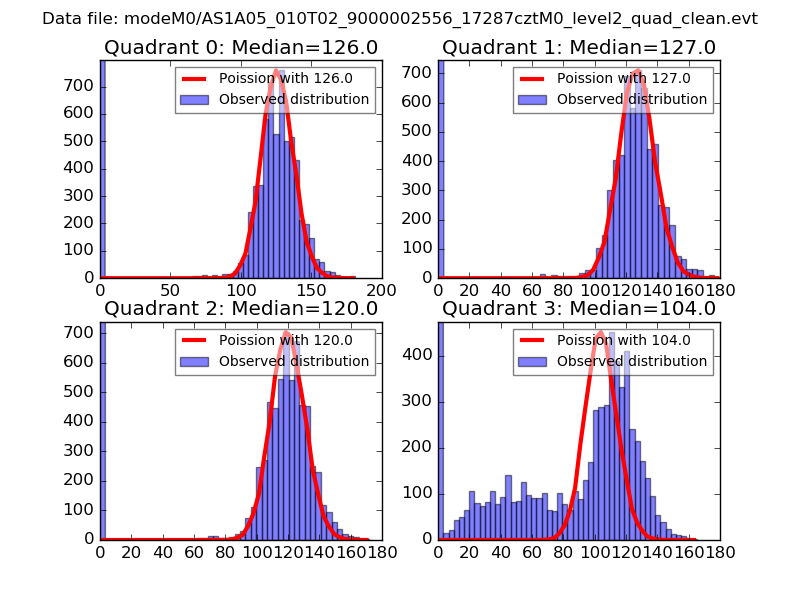 |
 |
| Quadrant-wise count rates Data is divided into 100 sec bins |
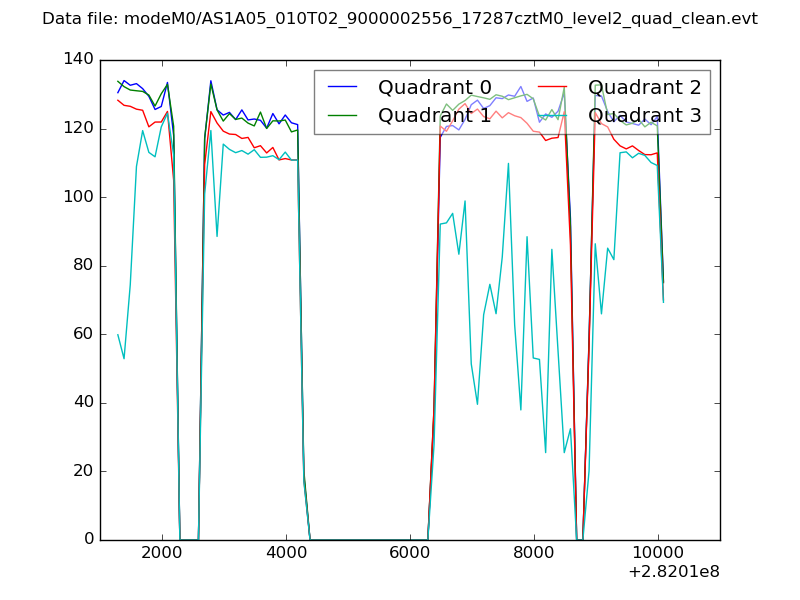 |
|
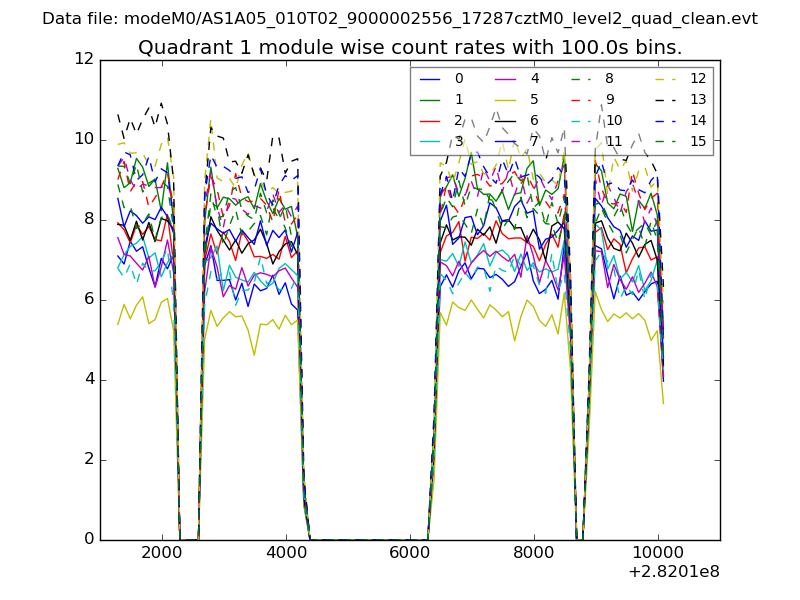
| Module-wise count rates for Quadrant A Data is divided into 100 sec bins |
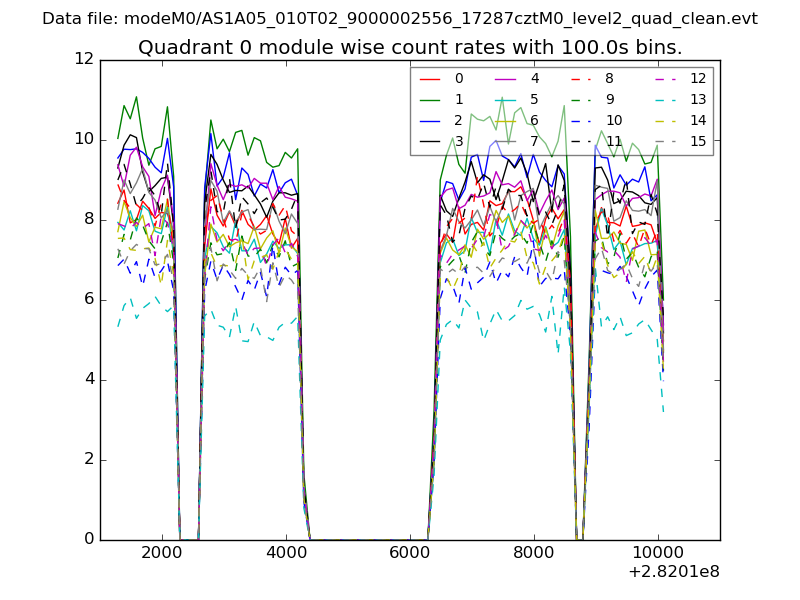 |
 |
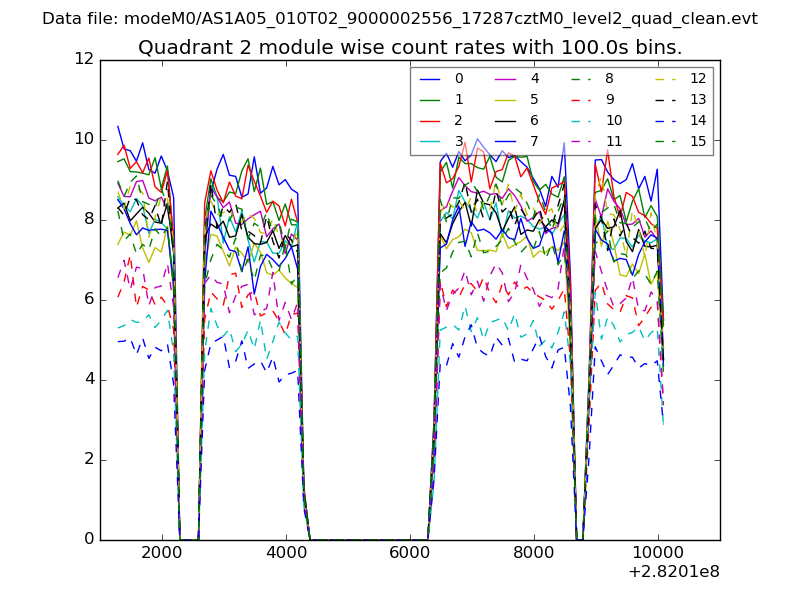
| Module-wise count rates for Quadrant B Data is divided into 100 sec bins |
 |
 |
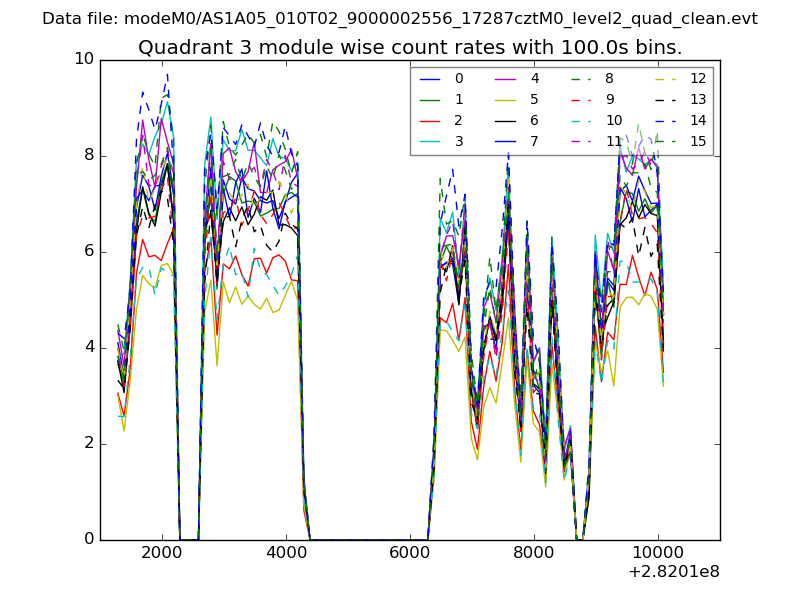
| Module-wise count rates for Quadrant C Data is divided into 100 sec bins |
 |
 |
| Module-wise count rates for Quadrant D Data is divided into 100 sec bins |
 |
 |
| Parameter | Plot |
|---|---|
| CZT HV Monitor | 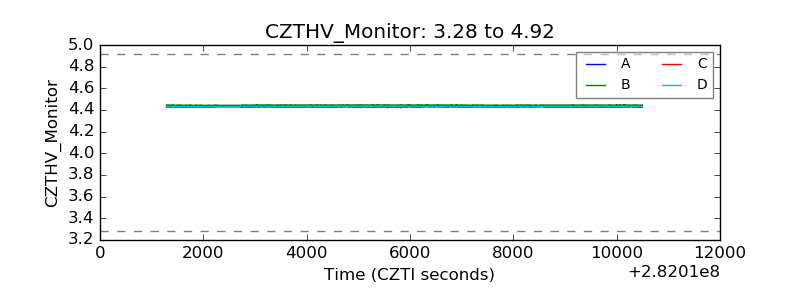 |
| D_VDD |  |
| Temperature 1 | 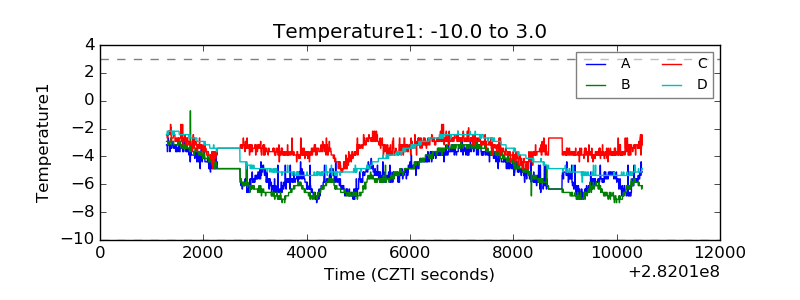 |
| Veto HV Monitor | 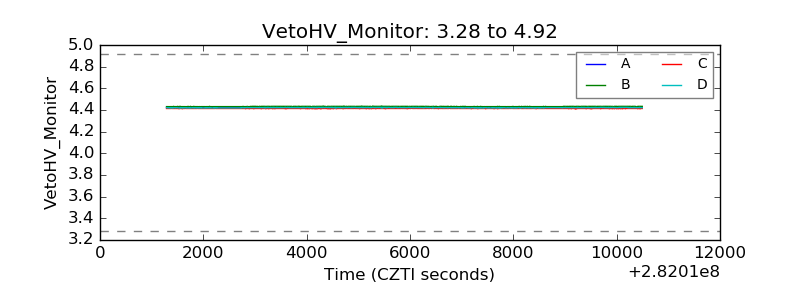 |
| Veto LLD | 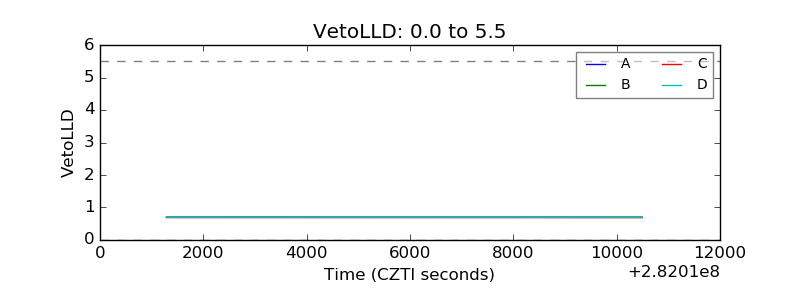 |
| Alpha Counter | 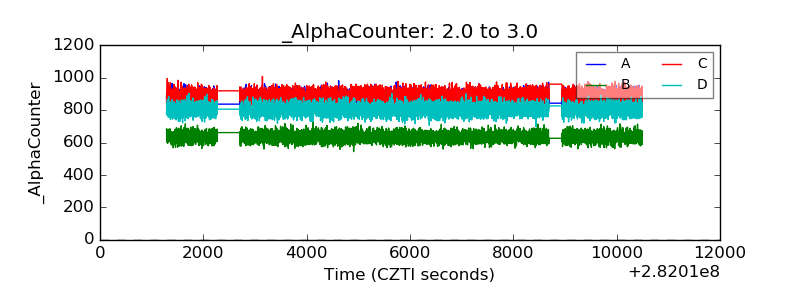 |
| _CPM_Rate | 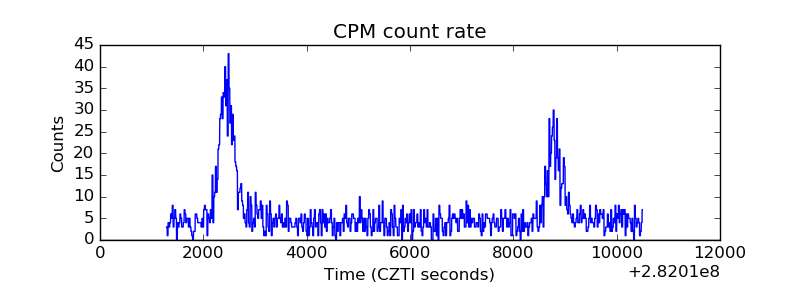 |
| CZT Counter | 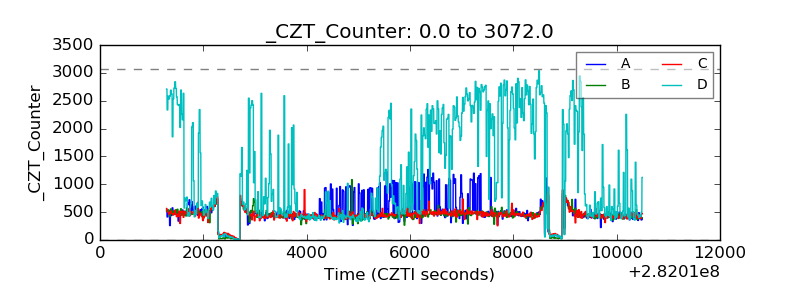 |
| +2.5 Volts monitor |  |
| +5 Volts monitor |  |
| _ROLL_ROT | 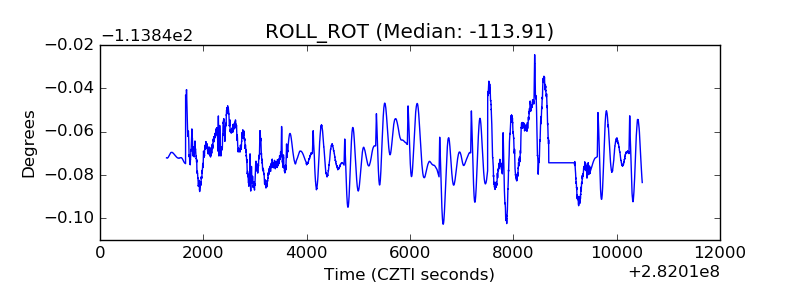 |
| _Roll_DEC | 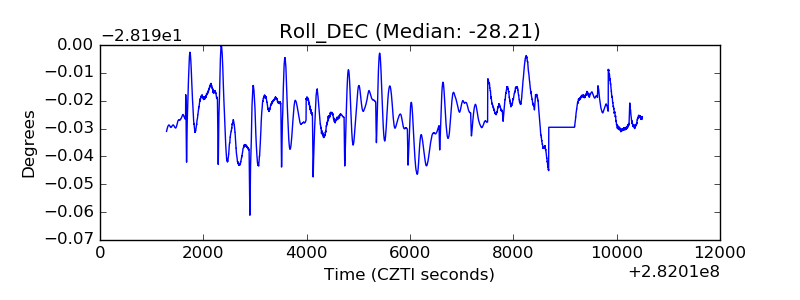 |
| _Roll_RA | 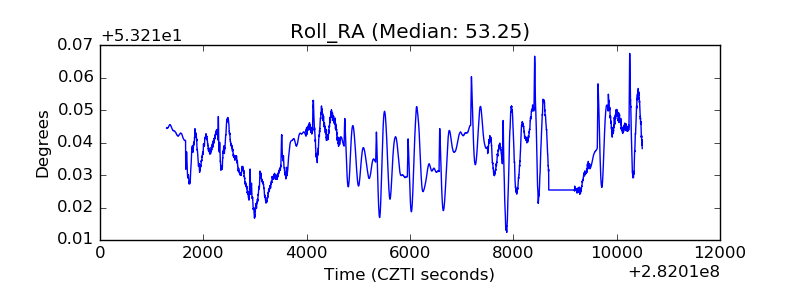 |
| Veto Counter | 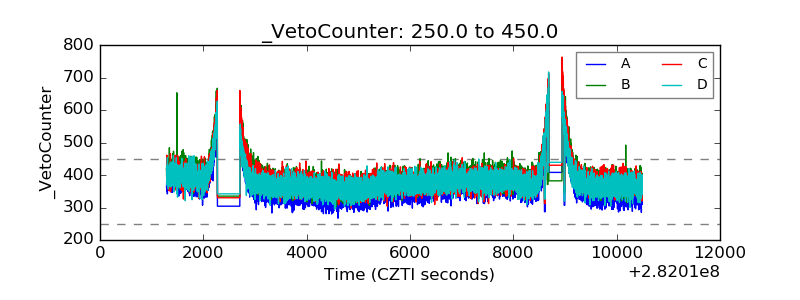 |