| Param | Original file | Final file |
|---|---|---|
| Filename | modeM0/AS1A05_010T02_9000002556_17291cztM0_level2.evt | modeM0/AS1A05_010T02_9000002556_17291cztM0_level2_quad_clean.evt |
| Size (bytes) | 658,575,360 | 119,808,000 |
| Size | 628.1 MB | 114.3 MB |
| Events in quadrant A | 4,441,669 | 757,662 |
| Events in quadrant B | 4,479,665 | 759,272 |
| Events in quadrant C | 4,456,788 | 724,671 |
| Events in quadrant D | 5,915,454 | 720,994 |
| Mode M0 | |||
|---|---|---|---|
| Quadrant | BADHDUFLAG | Total packets | Discarded packets |
| A | 0 | 19718 | 3 |
| B | 0 | 19664 | 2 |
| C | 0 | 19713 | 2 |
| D | 0 | 24294 | 2 |
| Mode M9 | |||
|---|---|---|---|
| Quadrant | BADHDUFLAG | Total packets | Discarded packets |
| A | 0 | 17 | 0 |
| B | 0 | 17 | 0 |
| C | 0 | 17 | 0 |
| D | 0 | 17 | 0 |
| Mode SS | |||
|---|---|---|---|
| Quadrant | BADHDUFLAG | Total packets | Discarded packets |
| A | 0 | 194 | 0 |
| B | 0 | 194 | 0 |
| C | 0 | 194 | 0 |
| D | 0 | 194 | 0 |
| Quadrant | Total seconds | Saturated seconds | Saturation percentage |
|---|---|---|---|
| A | 9609 | 108 | 1.123946% |
| B | 9610 | 107 | 1.113424% |
| C | 9610 | 154 | 1.602497% |
| D | 9610 | 393 | 4.089490% |
Noise dominated data is calculated using 1-second bins in cleaned event files. If a bin has >2000 counts, and if more than 50% of those come from <1% of pixels, then it is considered to be noise-dominated and hence unusable.
| Quadrant | # 1 sec bins | Bins with >0 counts | Bins with >2000 counts | High rate bins dominated by noise | Noise dominated (total time) | Noise dominated (detector-on time) | Marked lightcurve |
|---|---|---|---|---|---|---|---|
| A | 11194 | 9611 | 3 | 3 | 0.03% | 0.03% | 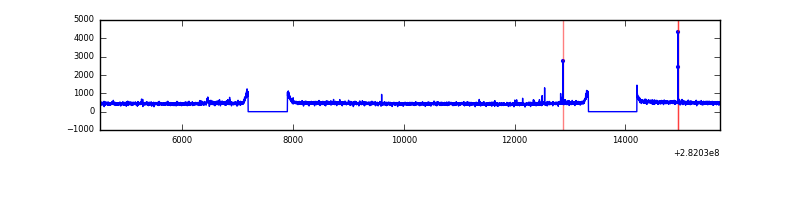 |
| B | 11195 | 9611 | 1 | 1 | 0.01% | 0.01% | 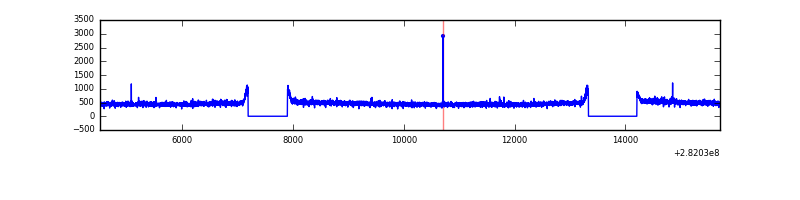 |
| C | 11195 | 9611 | 0 | 0 | 0.00% | 0.00% | 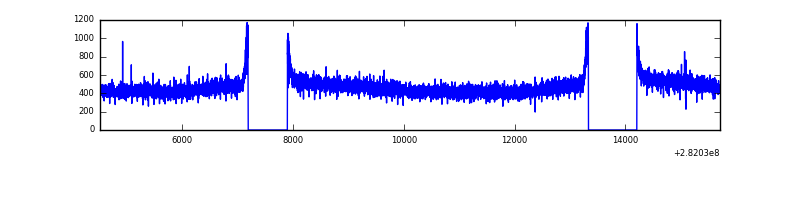 |
| D | 11195 | 9612 | 187 | 187 | 1.67% | 1.95% | 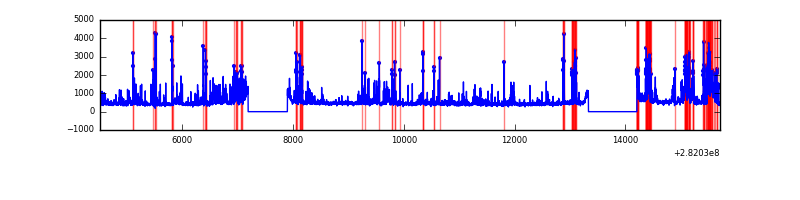 |
Top three noisy pixels from each quadrant. If the there are fewer than three noisy pixels in the level2.evt file, extra rows are filled as -1
| Pixel properties | Quadrant properties | ||||||
|---|---|---|---|---|---|---|---|
| Quadrant | DetID | PixID | Counts | Sigma | Mean | Median | Sigma |
| A | 4 | 2 | 25130 | 103.4 | 1146 | 1122 | 232.2 |
| A | 0 | 226 | 10222 | 39.19 | 1146 | 1122 | 232.2 |
| A | 3 | 137 | 9051 | 34.15 | 1146 | 1122 | 232.2 |
| B | 12 | 111 | 27824 | 120.48 | 1143 | 1111 | 221.7 |
| B | 11 | 111 | 24052 | 103.47 | 1143 | 1111 | 221.7 |
| B | 14 | 111 | 21038 | 89.88 | 1143 | 1111 | 221.7 |
| C | 14 | 238 | 168669 | 653.01 | 1096 | 1103 | 256.6 |
| C | 3 | 233 | 13396 | 47.9 | 1096 | 1103 | 256.6 |
| C | 13 | 61 | 7637 | 25.46 | 1096 | 1103 | 256.6 |
| D | 13 | 232 | 609865 | 2286.54 | 1097 | 1066 | 266.3 |
| D | 11 | 176 | 581074 | 2178.4 | 1097 | 1066 | 266.3 |
| D | 1 | 52 | 141964 | 529.19 | 1097 | 1066 | 266.3 |
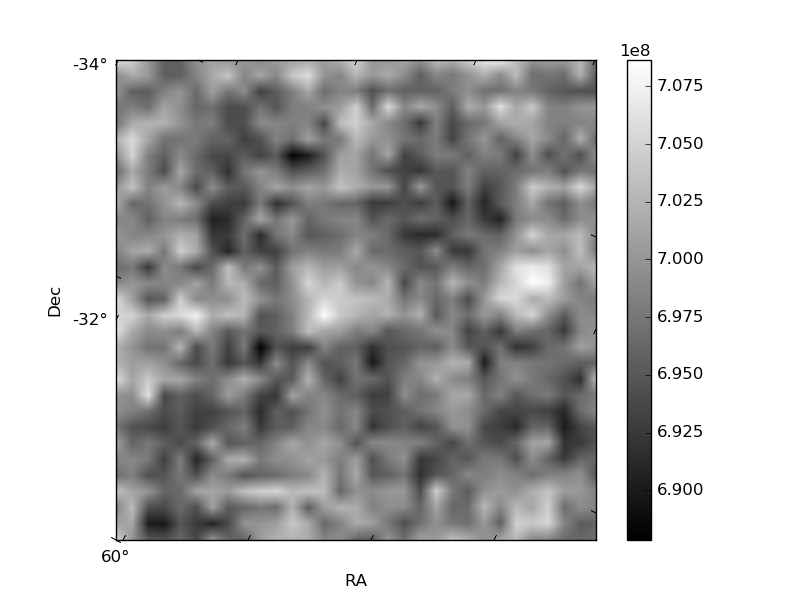
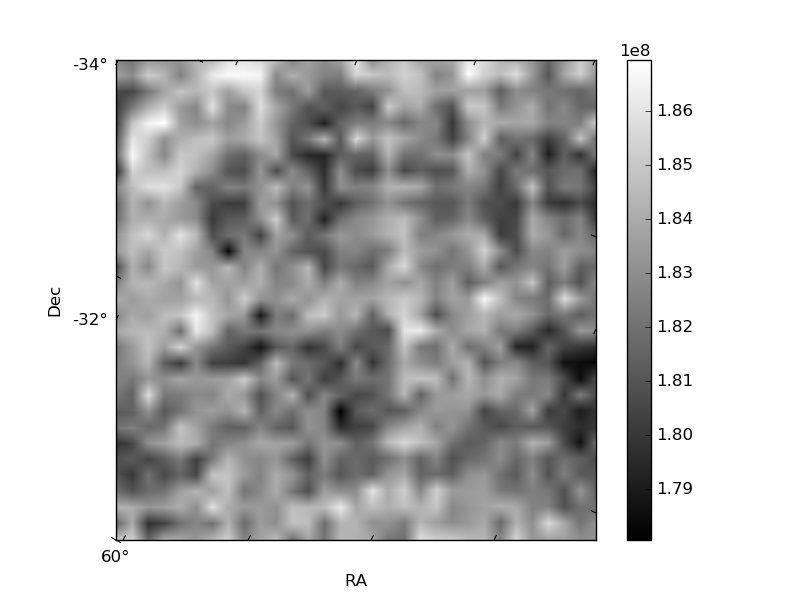
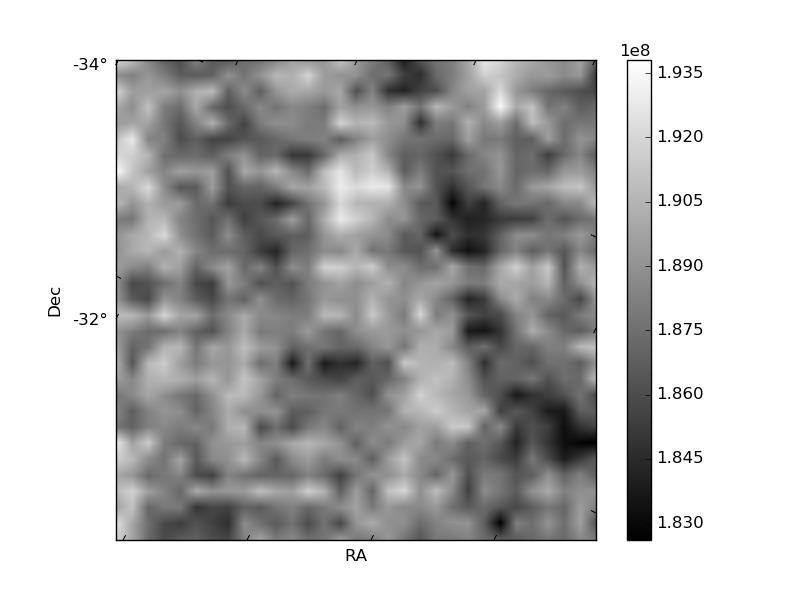
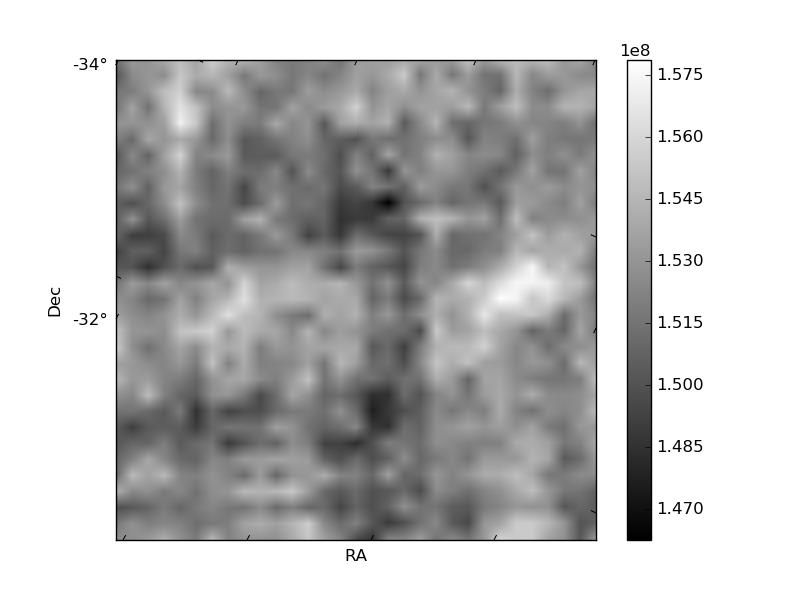
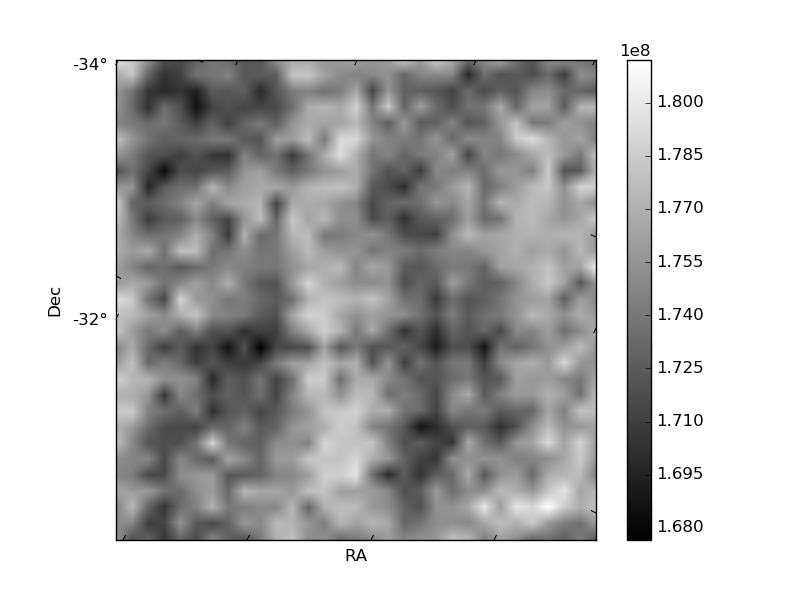
Histogram calculated using DETX and DETY for each event in the final _common_clean file
| Quadrant A | 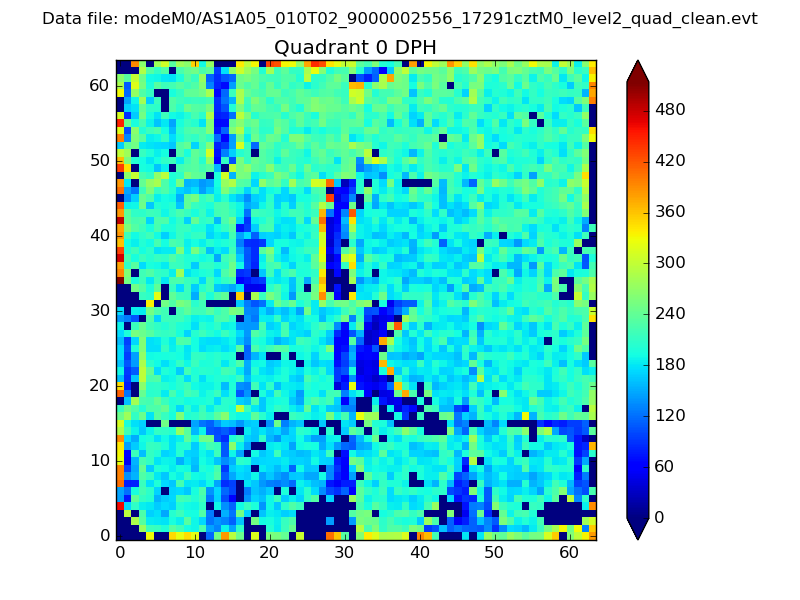 |
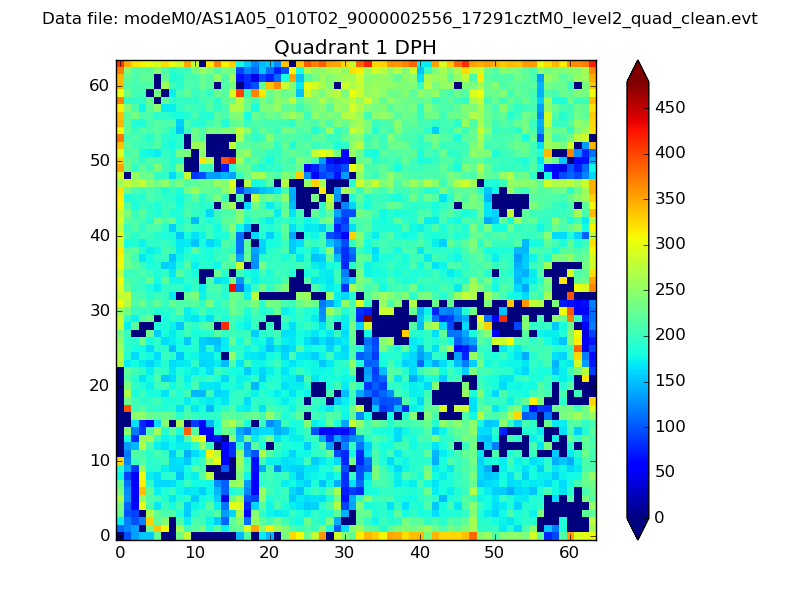 |
Quadrant B |
|---|---|---|---|
| Quadrant D | 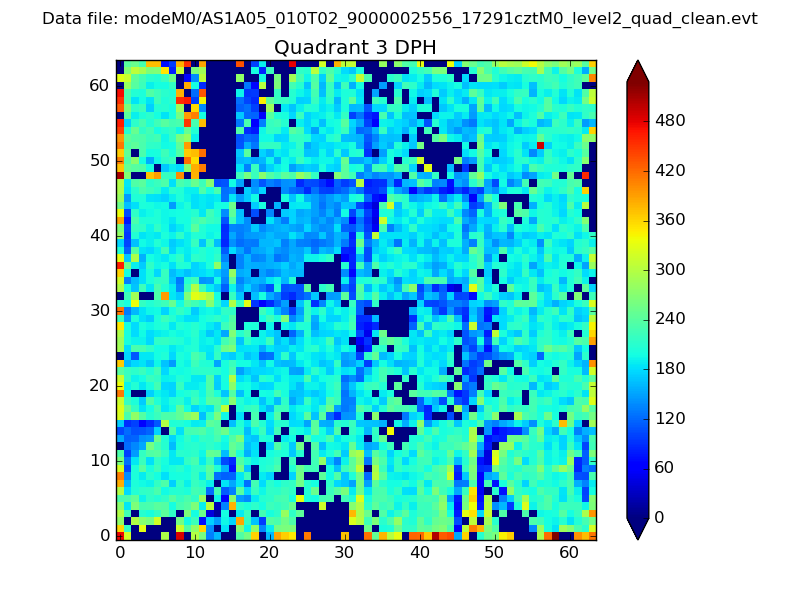 |
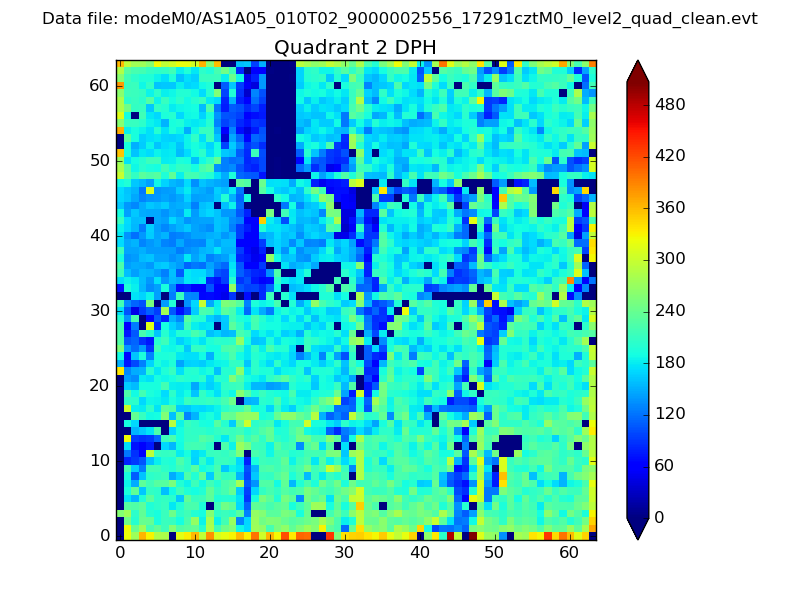 |
Quadrant C |
| Plot type | Count rate plots | Images |
|---|---|---|
| Comparison with Poisson distribution Blue bars denote a histogram of data divided into 1 sec bins. Red curve is a Poisson curve with rate = median count rate of data. |
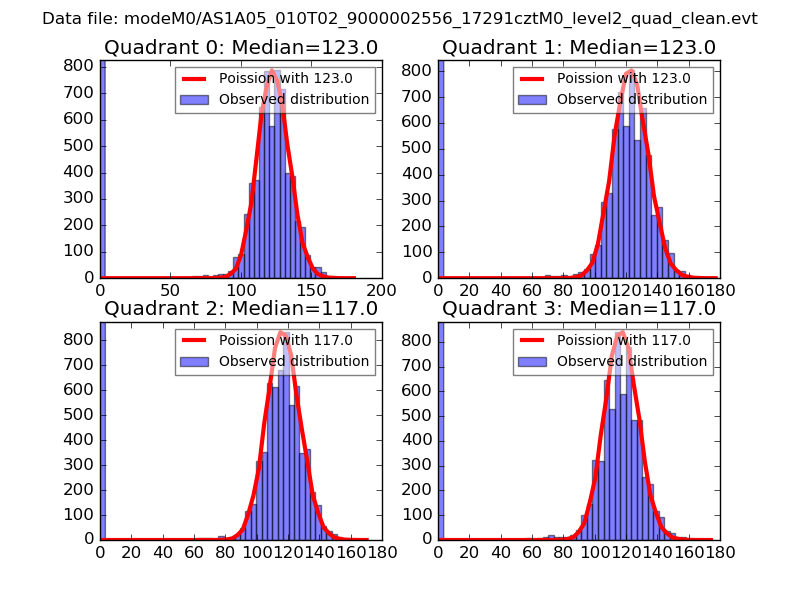 |
 |
| Quadrant-wise count rates Data is divided into 100 sec bins |
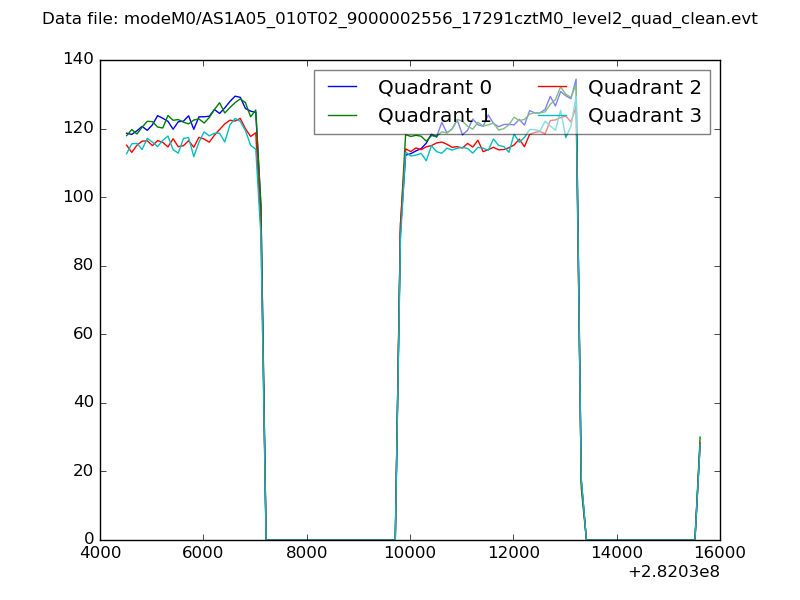 |
|
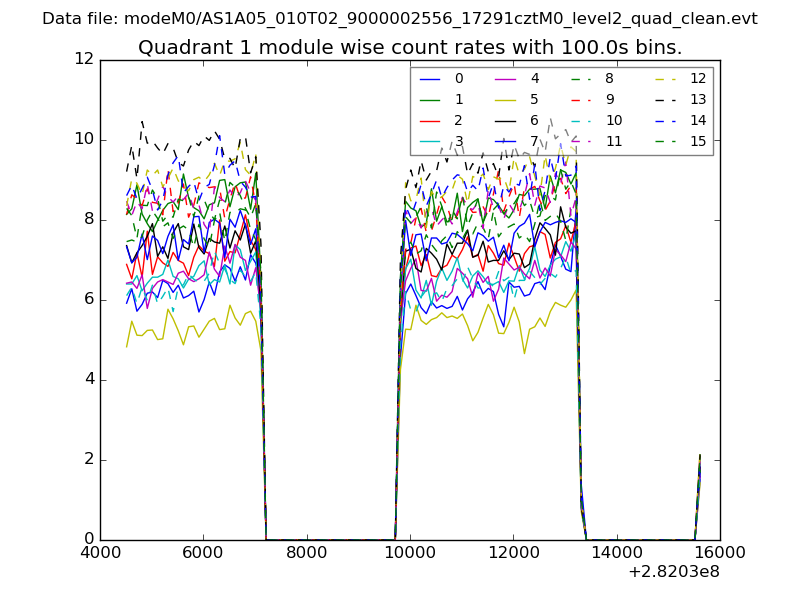
| Module-wise count rates for Quadrant A Data is divided into 100 sec bins |
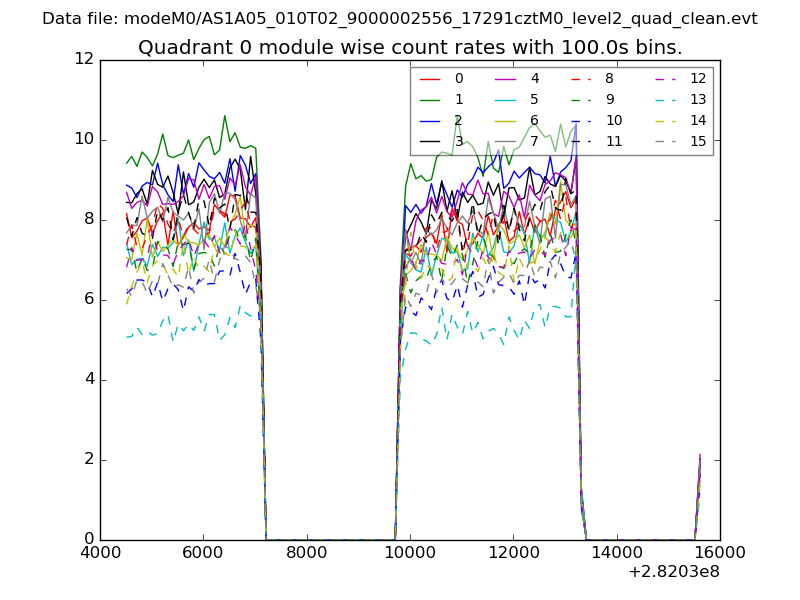 |
 |
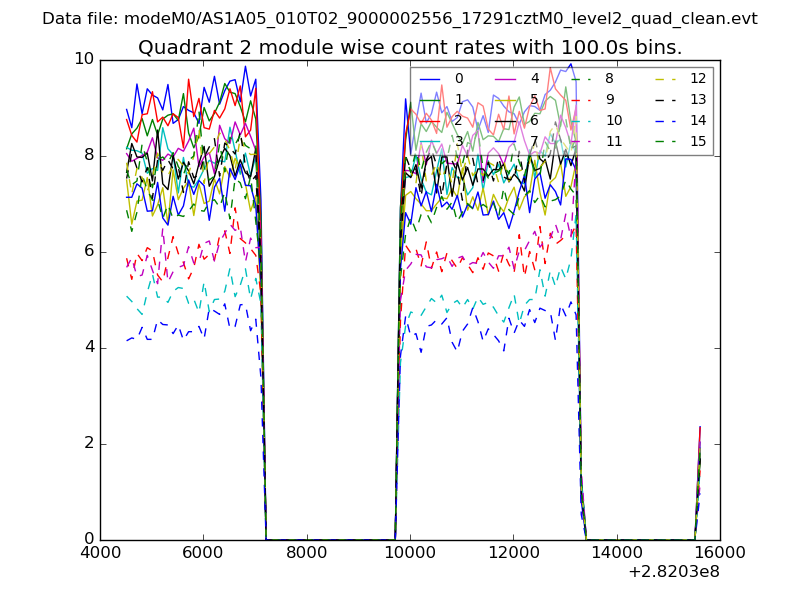
| Module-wise count rates for Quadrant B Data is divided into 100 sec bins |
 |
 |
| Module-wise count rates for Quadrant C Data is divided into 100 sec bins |
 |
 |
| Module-wise count rates for Quadrant D Data is divided into 100 sec bins |
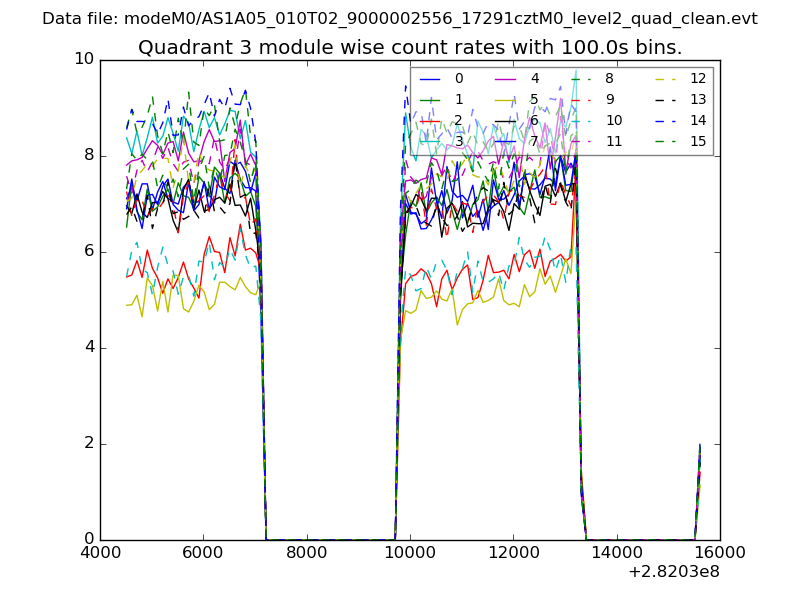 |
 |
| Parameter | Plot |
|---|---|
| CZT HV Monitor | 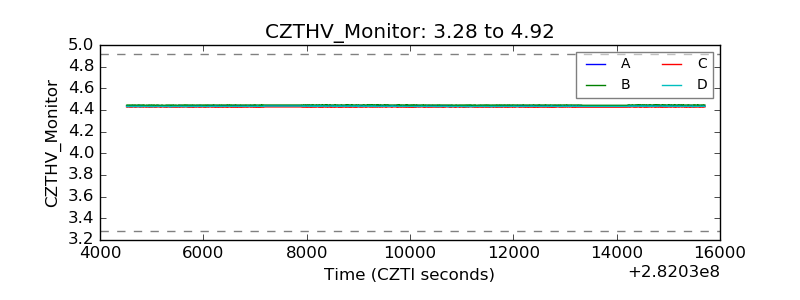 |
| D_VDD | 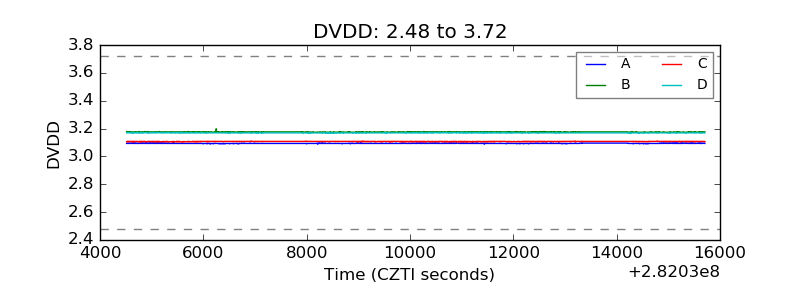 |
| Temperature 1 | 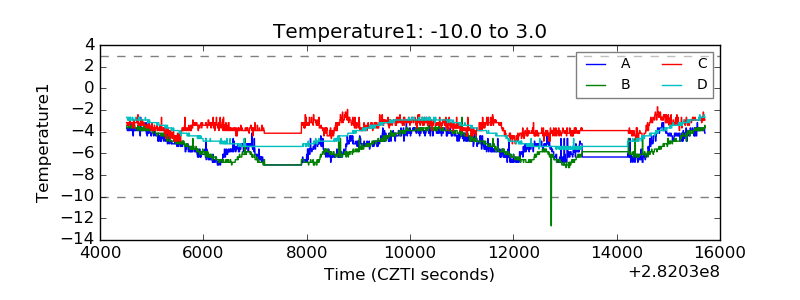 |
| Veto HV Monitor | 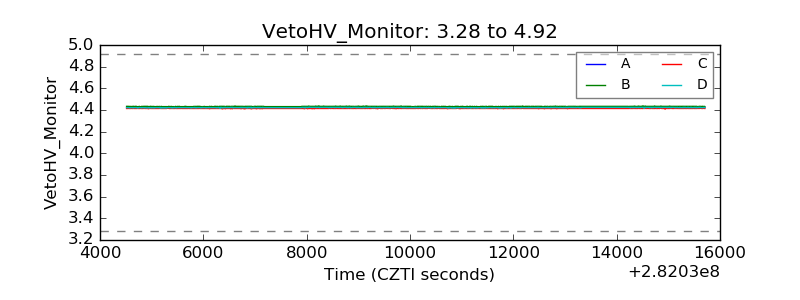 |
| Veto LLD | 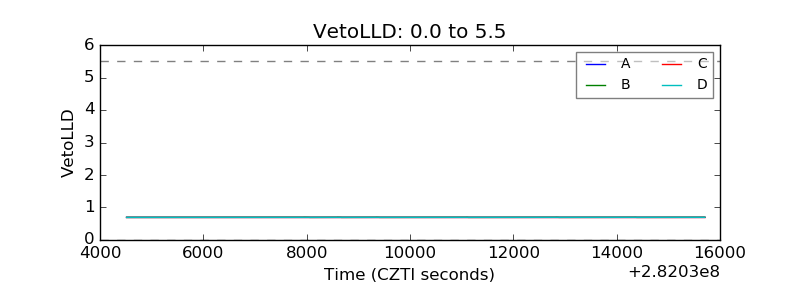 |
| Alpha Counter | 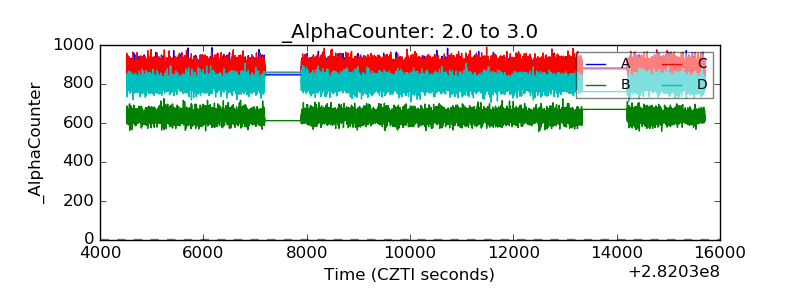 |
| _CPM_Rate | 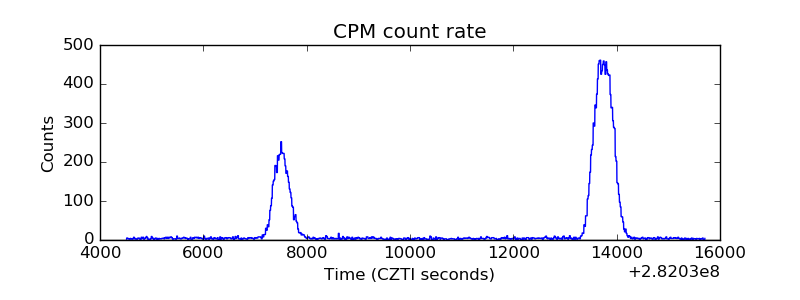 |
| CZT Counter | 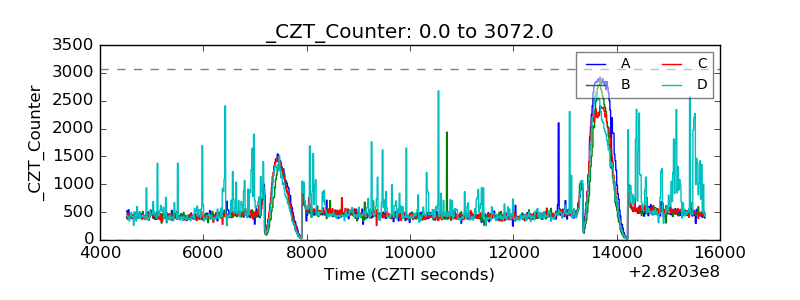 |
| +2.5 Volts monitor | 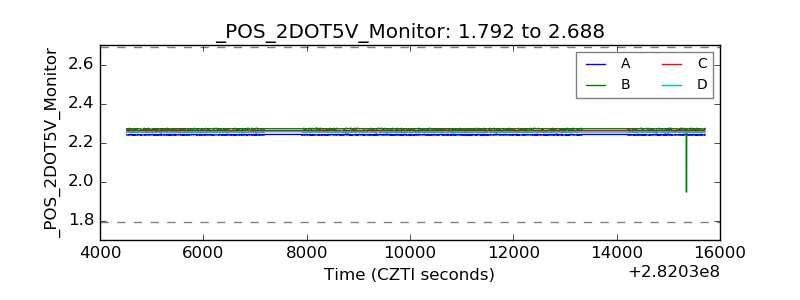 |
| +5 Volts monitor |  |
| _ROLL_ROT | 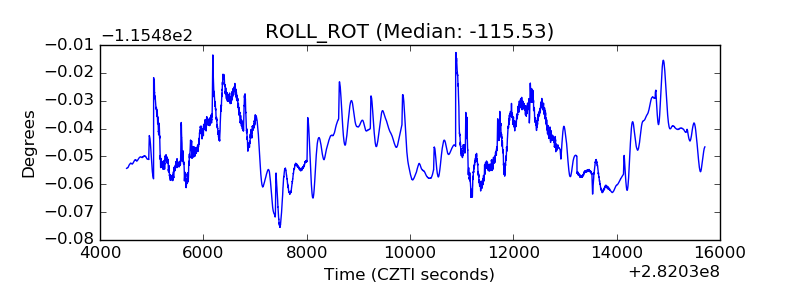 |
| _Roll_DEC | 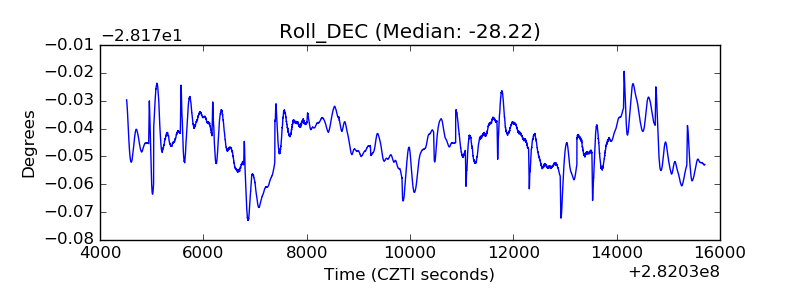 |
| _Roll_RA | 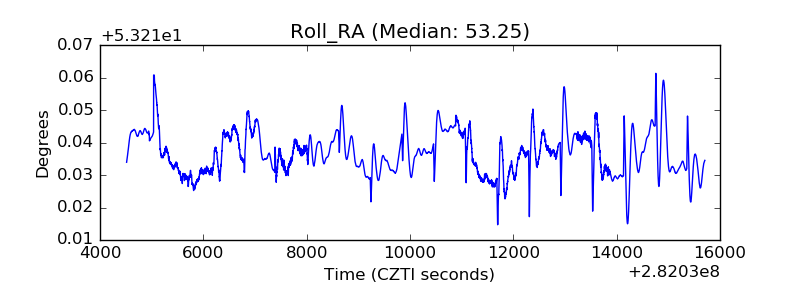 |
| Veto Counter | 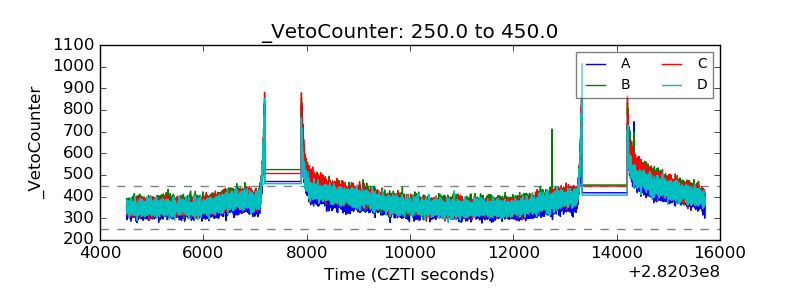 |