| Param | Original file | Final file |
|---|---|---|
| Filename | modeM0/AS1A05_010T02_9000002556_17292cztM0_level2.evt | modeM0/AS1A05_010T02_9000002556_17292cztM0_level2_quad_clean.evt |
| Size (bytes) | 496,537,920 | 84,205,440 |
| Size | 473.5 MB | 80.3 MB |
| Events in quadrant A | 3,311,461 | 529,570 |
| Events in quadrant B | 3,341,239 | 533,293 |
| Events in quadrant C | 3,338,755 | 507,980 |
| Events in quadrant D | 4,579,923 | 500,970 |
| Mode M0 | |||
|---|---|---|---|
| Quadrant | BADHDUFLAG | Total packets | Discarded packets |
| A | 0 | 14337 | 2 |
| B | 0 | 14377 | 2 |
| C | 0 | 14453 | 2 |
| D | 0 | 18443 | 2 |
| Mode M9 | |||
|---|---|---|---|
| Quadrant | BADHDUFLAG | Total packets | Discarded packets |
| A | 0 | 20 | 0 |
| B | 0 | 20 | 0 |
| C | 0 | 20 | 0 |
| D | 0 | 20 | 0 |
| Mode SS | |||
|---|---|---|---|
| Quadrant | BADHDUFLAG | Total packets | Discarded packets |
| A | 0 | 138 | 0 |
| B | 0 | 138 | 0 |
| C | 0 | 138 | 0 |
| D | 0 | 138 | 0 |
| Quadrant | Total seconds | Saturated seconds | Saturation percentage |
|---|---|---|---|
| A | 6872 | 113 | 1.644354% |
| B | 6873 | 117 | 1.702313% |
| C | 6872 | 141 | 2.051804% |
| D | 6872 | 425 | 6.184517% |
Noise dominated data is calculated using 1-second bins in cleaned event files. If a bin has >2000 counts, and if more than 50% of those come from <1% of pixels, then it is considered to be noise-dominated and hence unusable.
| Quadrant | # 1 sec bins | Bins with >0 counts | Bins with >2000 counts | High rate bins dominated by noise | Noise dominated (total time) | Noise dominated (detector-on time) | Marked lightcurve |
|---|---|---|---|---|---|---|---|
| A | 8757 | 6873 | 2 | 2 | 0.02% | 0.03% | 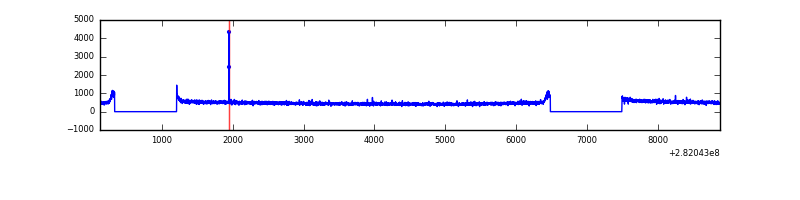 |
| B | 8758 | 6873 | 0 | 0 | 0.00% | 0.00% | 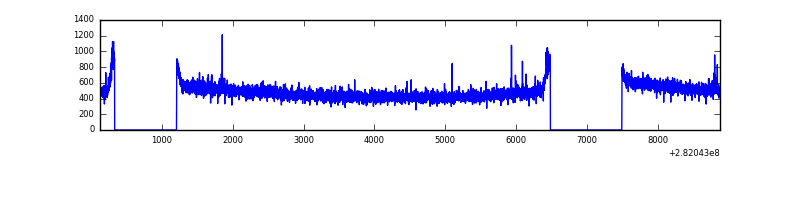 |
| C | 8757 | 6872 | 0 | 0 | 0.00% | 0.00% | 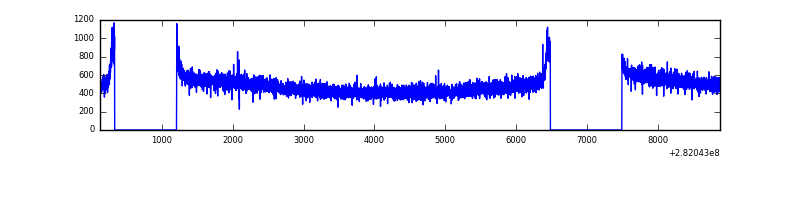 |
| D | 8757 | 6873 | 205 | 205 | 2.34% | 2.98% | 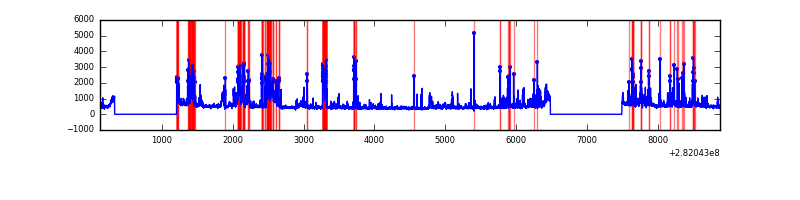 |
Top three noisy pixels from each quadrant. If the there are fewer than three noisy pixels in the level2.evt file, extra rows are filled as -1
| Pixel properties | Quadrant properties | ||||||
|---|---|---|---|---|---|---|---|
| Quadrant | DetID | PixID | Counts | Sigma | Mean | Median | Sigma |
| A | 0 | 226 | 7664 | 39.47 | 859 | 840 | 172.9 |
| A | 0 | 23 | 7122 | 36.33 | 859 | 840 | 172.9 |
| A | 3 | 137 | 6483 | 32.64 | 859 | 840 | 172.9 |
| B | 12 | 111 | 20317 | 119.03 | 853 | 831 | 163.7 |
| B | 11 | 111 | 17655 | 102.77 | 853 | 831 | 163.7 |
| B | 14 | 111 | 15440 | 89.24 | 853 | 831 | 163.7 |
| C | 14 | 238 | 125675 | 650.83 | 818 | 826 | 191.8 |
| C | 3 | 233 | 23585 | 118.64 | 818 | 826 | 191.8 |
| C | 13 | 61 | 5780 | 25.82 | 818 | 826 | 191.8 |
| D | 11 | 176 | 715159 | 3633.8 | 816 | 794 | 196.6 |
| D | 13 | 232 | 429141 | 2178.9 | 816 | 794 | 196.6 |
| D | 13 | 170 | 126800 | 640.96 | 816 | 794 | 196.6 |
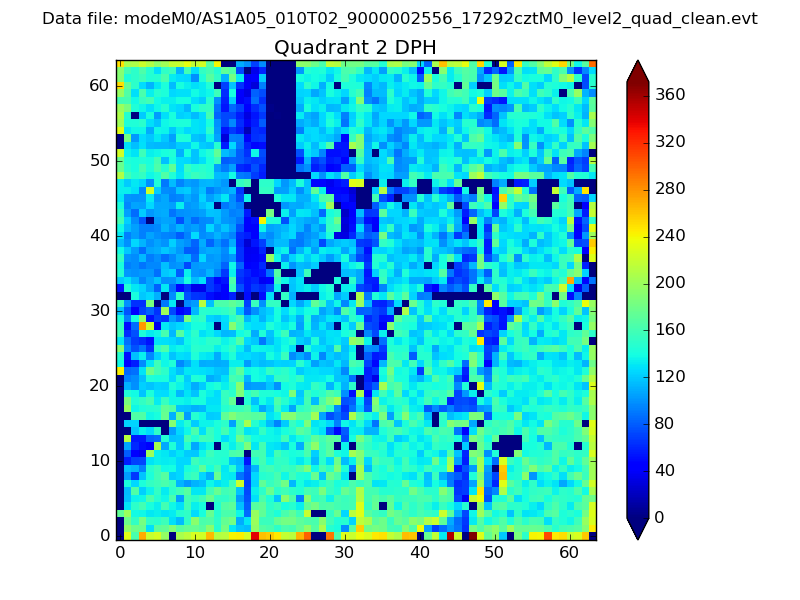
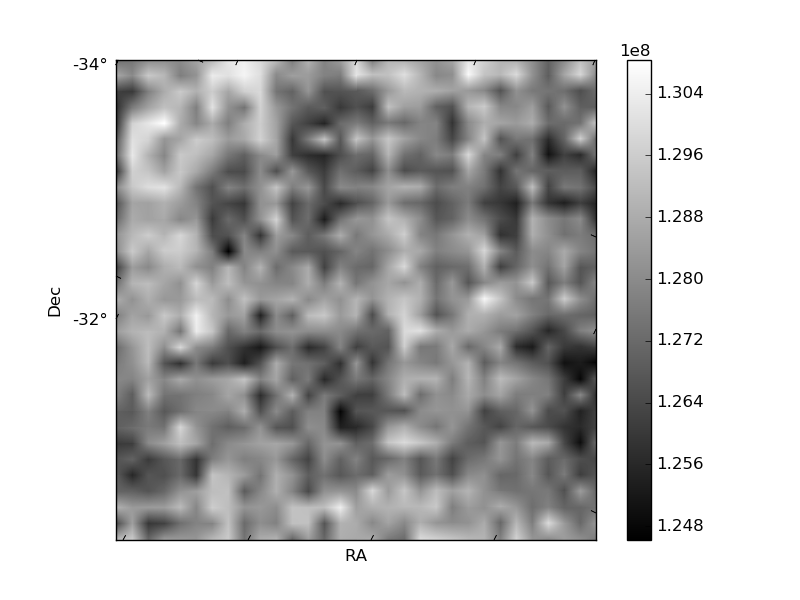
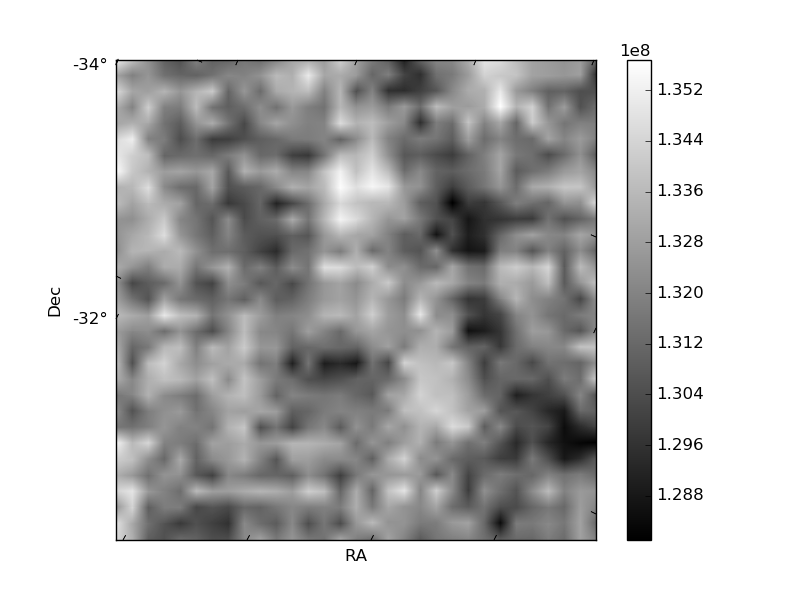
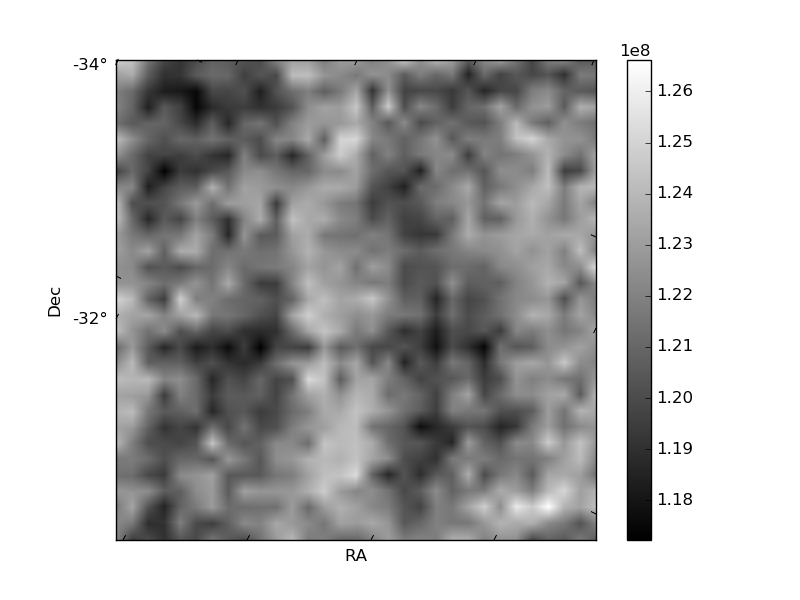
Histogram calculated using DETX and DETY for each event in the final _common_clean file
| Quadrant A | 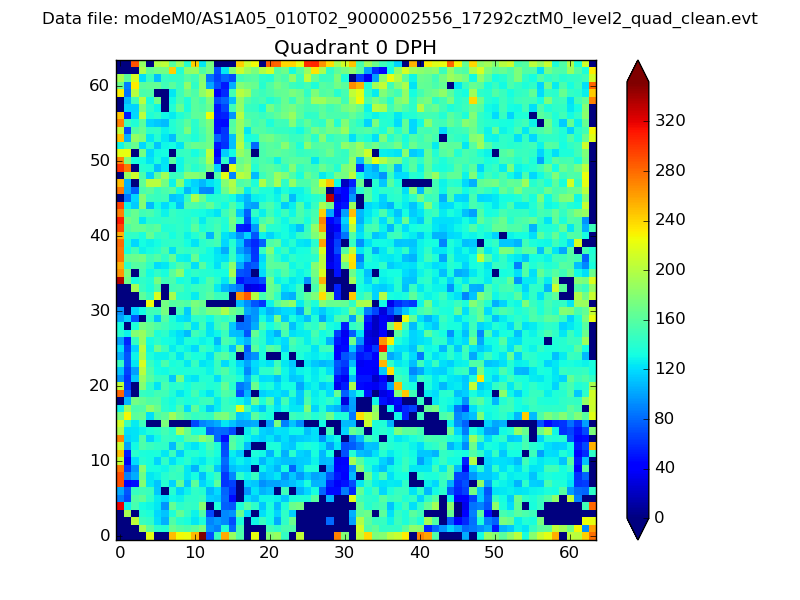 |
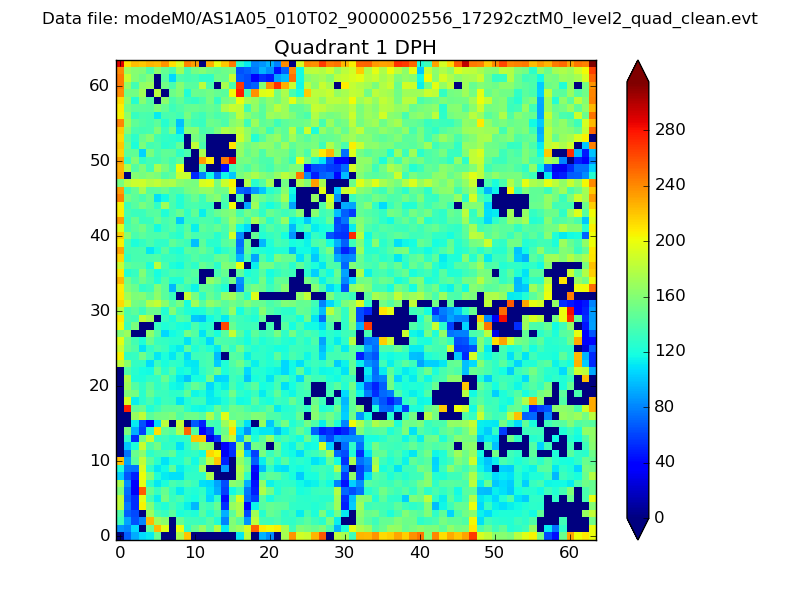 |
Quadrant B |
|---|---|---|---|
| Quadrant D | 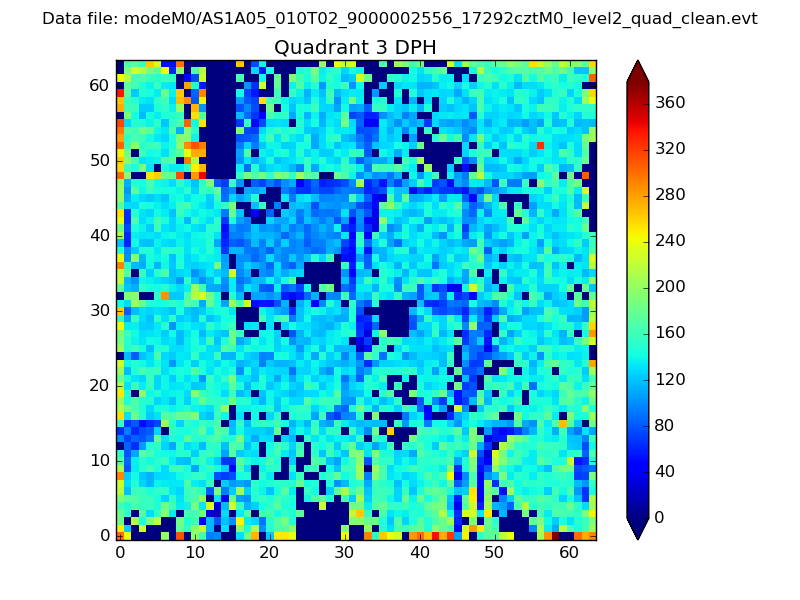 |
 |
Quadrant C |
| Plot type | Count rate plots | Images |
|---|---|---|
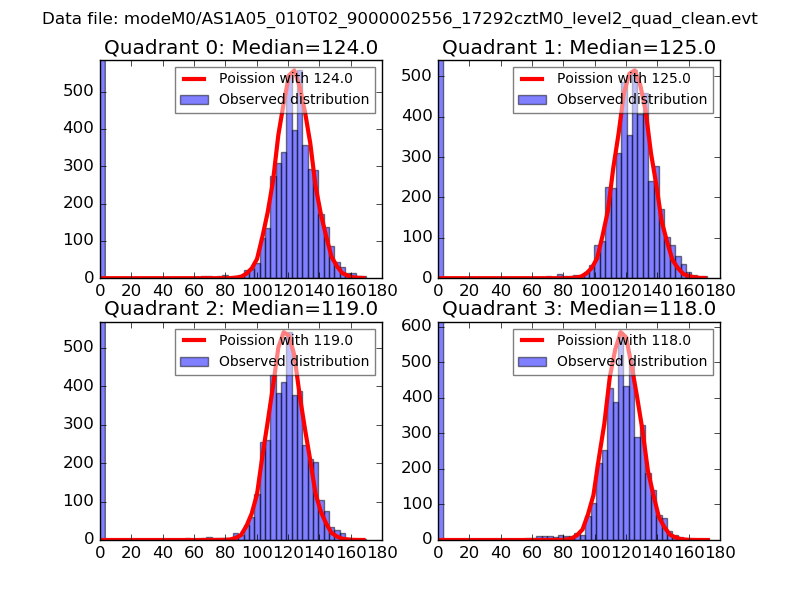
| Comparison with Poisson distribution Blue bars denote a histogram of data divided into 1 sec bins. Red curve is a Poisson curve with rate = median count rate of data. |
 |
 |
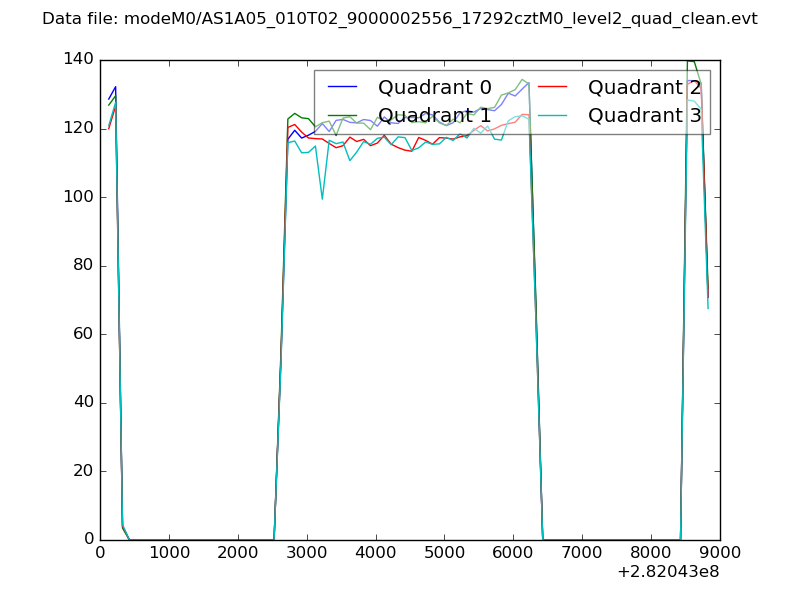
| Quadrant-wise count rates Data is divided into 100 sec bins |
 |
|
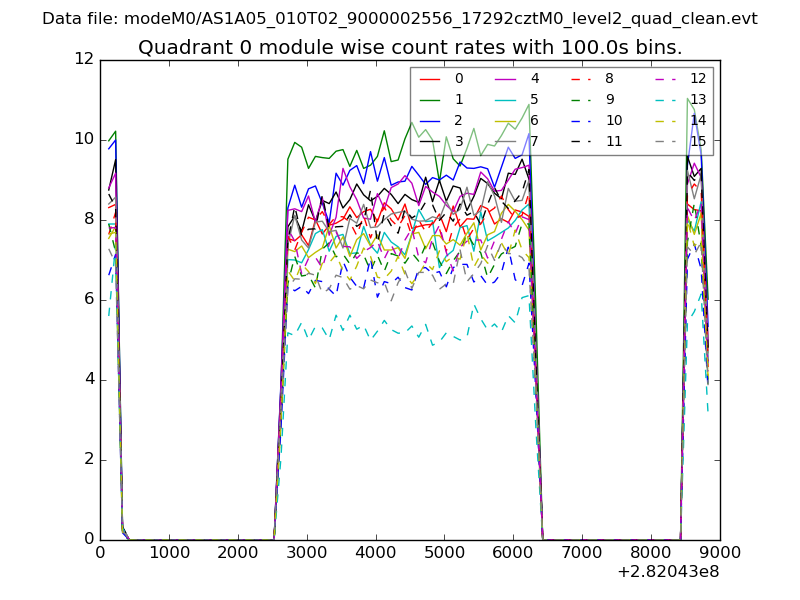
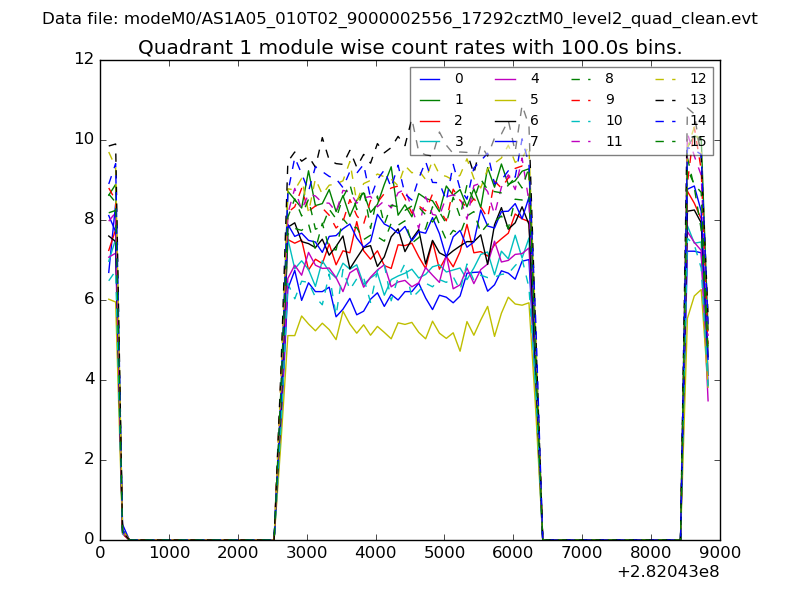
| Module-wise count rates for Quadrant A Data is divided into 100 sec bins |
 |
 |
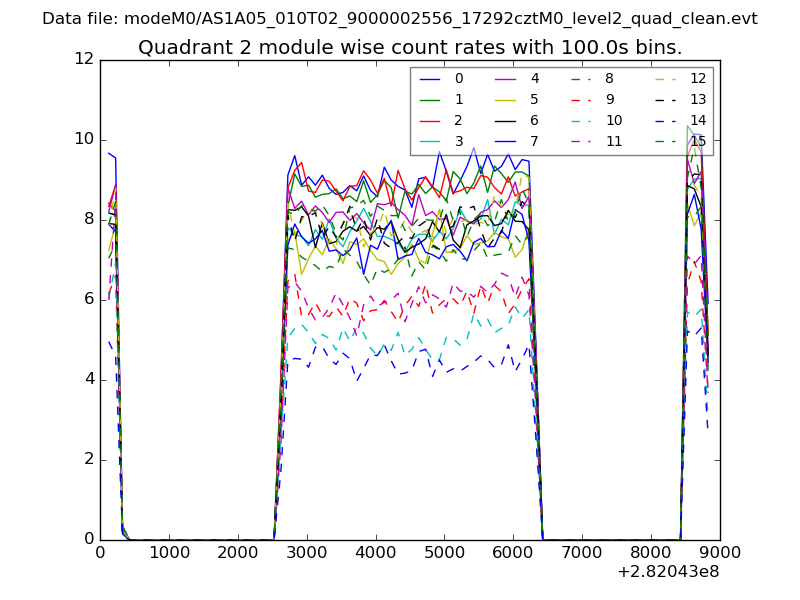
| Module-wise count rates for Quadrant B Data is divided into 100 sec bins |
 |
 |
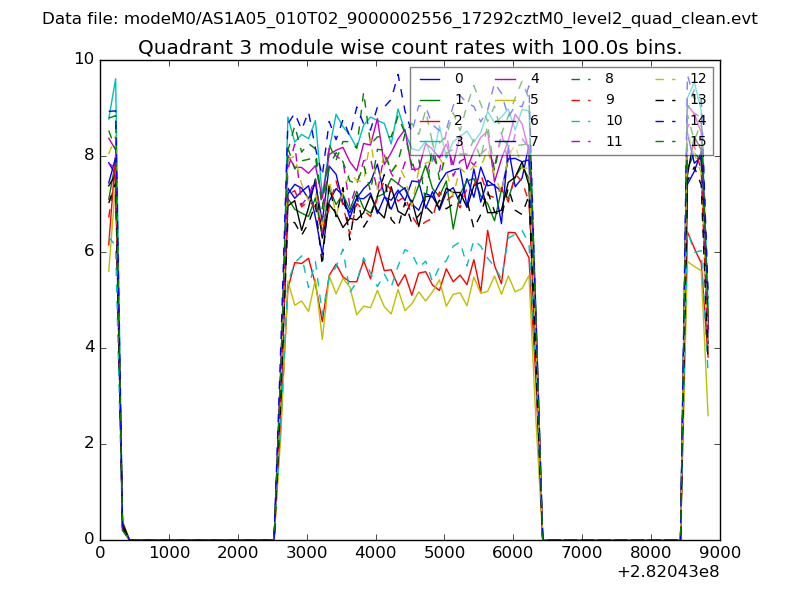
| Module-wise count rates for Quadrant C Data is divided into 100 sec bins |
 |
 |
| Module-wise count rates for Quadrant D Data is divided into 100 sec bins |
 |
 |
| Parameter | Plot |
|---|---|
| CZT HV Monitor | 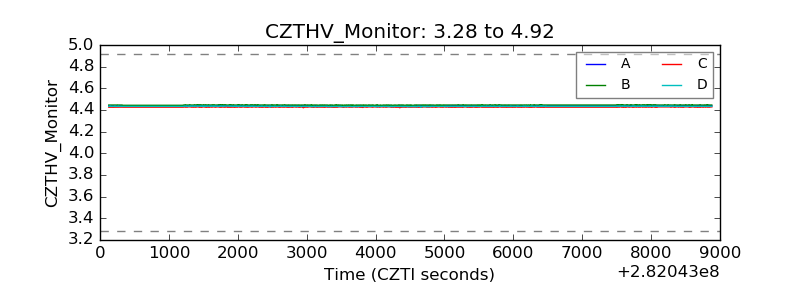 |
| D_VDD | 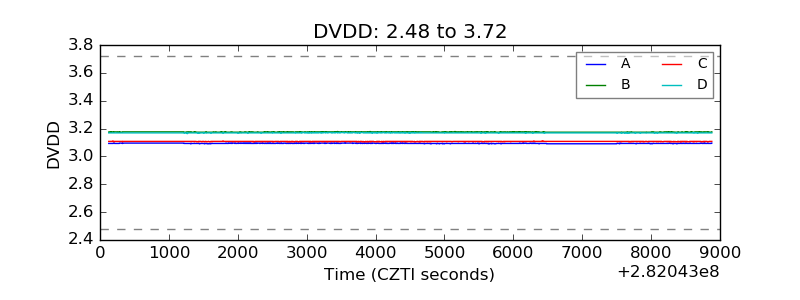 |
| Temperature 1 | 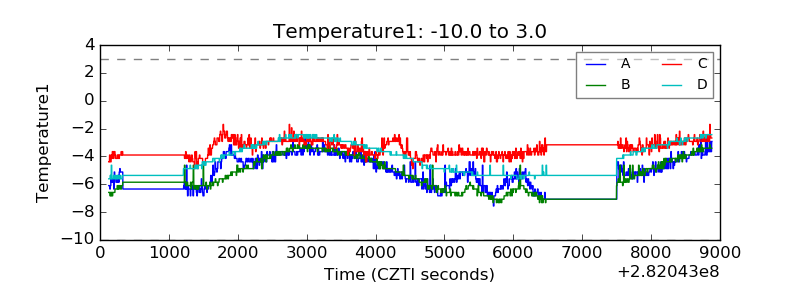 |
| Veto HV Monitor | 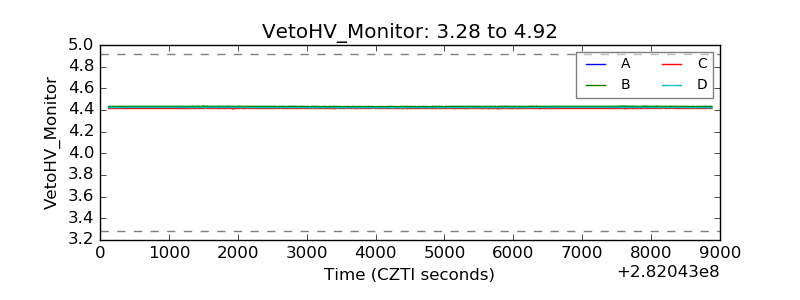 |
| Veto LLD | 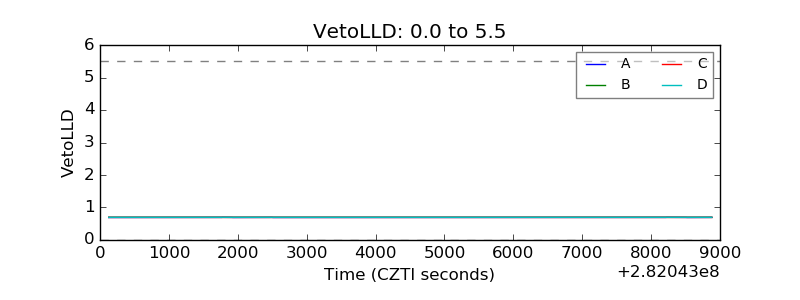 |
| Alpha Counter | 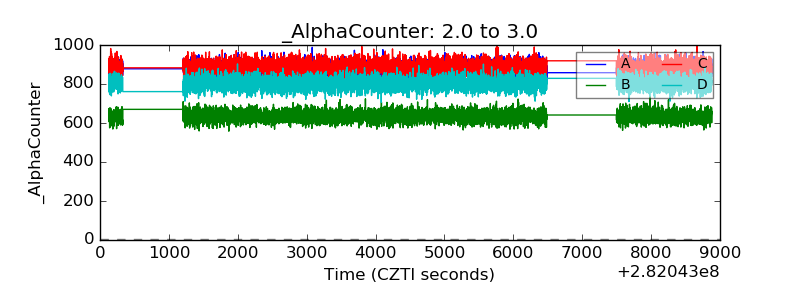 |
| _CPM_Rate | 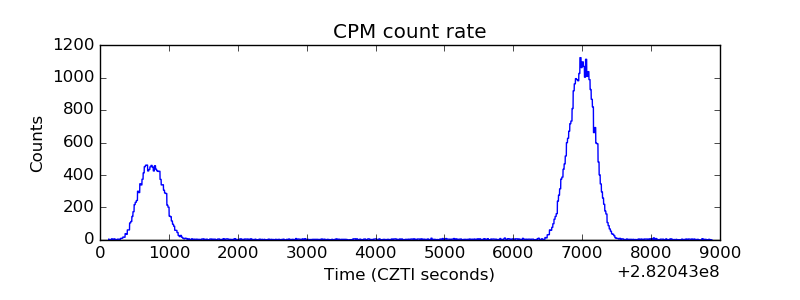 |
| CZT Counter | 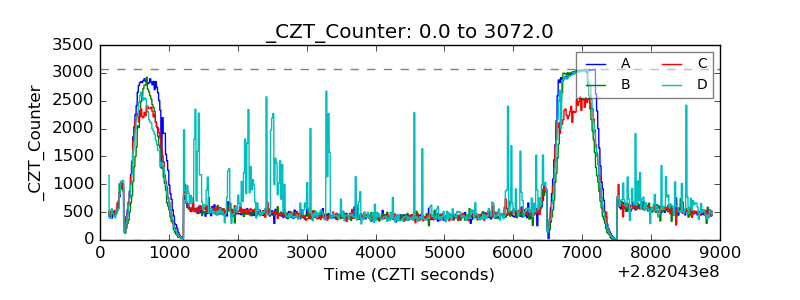 |
| +2.5 Volts monitor | 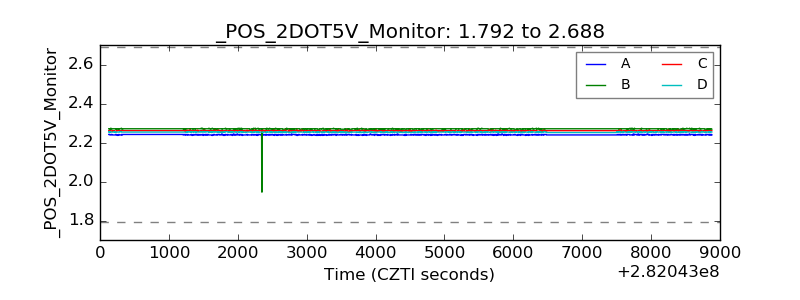 |
| +5 Volts monitor |  |
| _ROLL_ROT | 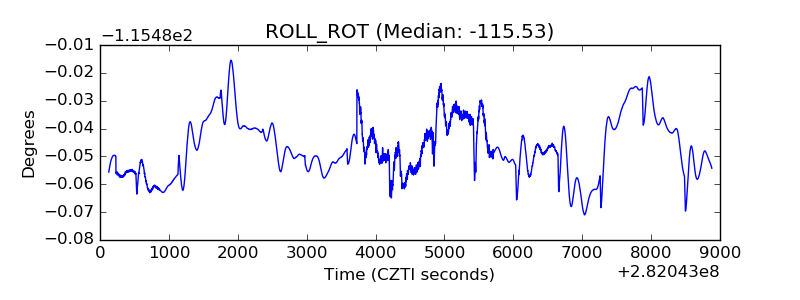 |
| _Roll_DEC | 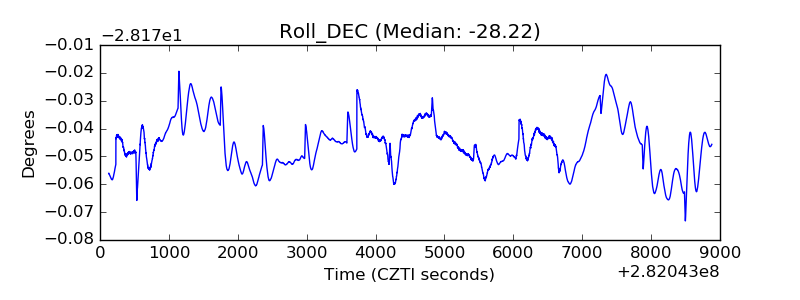 |
| _Roll_RA | 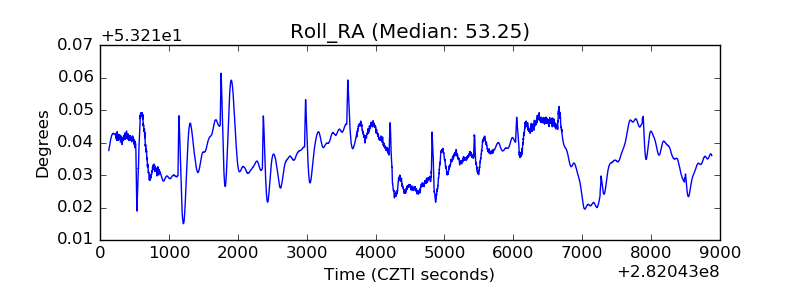 |
| Veto Counter | 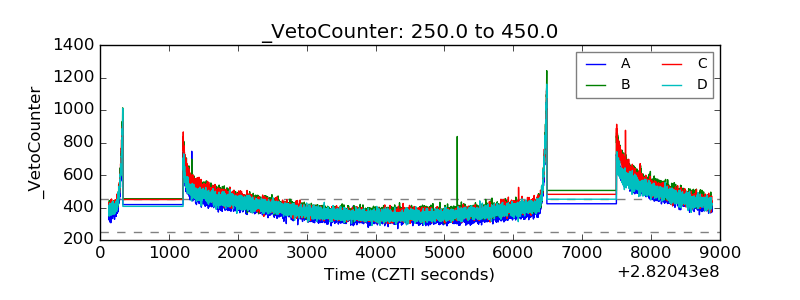 |