| Param | Original file | Final file |
|---|---|---|
| Filename | modeM0/AS1A05_010T02_9000002556_17296cztM0_level2.evt | modeM0/AS1A05_010T02_9000002556_17296cztM0_level2_quad_clean.evt |
| Size (bytes) | 524,848,320 | 117,285,120 |
| Size | 500.5 MB | 111.9 MB |
| Events in quadrant A | 3,499,146 | 808,132 |
| Events in quadrant B | 3,438,303 | 816,046 |
| Events in quadrant C | 3,395,652 | 754,887 |
| Events in quadrant D | 5,111,991 | 710,651 |
| Mode M0 | |||
|---|---|---|---|
| Quadrant | BADHDUFLAG | Total packets | Discarded packets |
| A | 0 | 14706 | 2 |
| B | 0 | 14492 | 2 |
| C | 0 | 14374 | 2 |
| D | 0 | 19683 | 4 |
| Mode M9 | |||
|---|---|---|---|
| Quadrant | BADHDUFLAG | Total packets | Discarded packets |
| A | 0 | 23 | 0 |
| B | 0 | 24 | 0 |
| C | 0 | 24 | 0 |
| D | 0 | 24 | 0 |
| Mode SS | |||
|---|---|---|---|
| Quadrant | BADHDUFLAG | Total packets | Discarded packets |
| A | 0 | 134 | 0 |
| B | 0 | 134 | 0 |
| C | 0 | 134 | 0 |
| D | 0 | 134 | 0 |
| Quadrant | Total seconds | Saturated seconds | Saturation percentage |
|---|---|---|---|
| A | 6636 | 129 | 1.943942% |
| B | 6636 | 102 | 1.537071% |
| C | 6636 | 117 | 1.763110% |
| D | 6635 | 463 | 6.978146% |
Noise dominated data is calculated using 1-second bins in cleaned event files. If a bin has >2000 counts, and if more than 50% of those come from <1% of pixels, then it is considered to be noise-dominated and hence unusable.
| Quadrant | # 1 sec bins | Bins with >0 counts | Bins with >2000 counts | High rate bins dominated by noise | Noise dominated (total time) | Noise dominated (detector-on time) | Marked lightcurve |
|---|---|---|---|---|---|---|---|
| A | 7916 | 6637 | 26 | 26 | 0.33% | 0.39% | 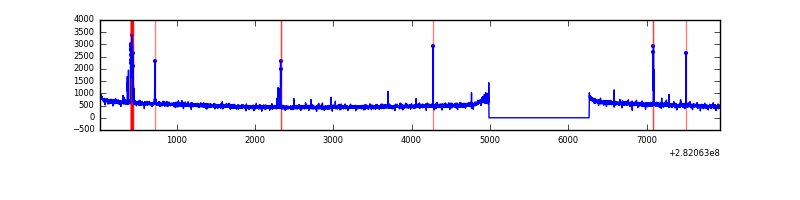 |
| B | 7916 | 6637 | 0 | 0 | 0.00% | 0.00% | 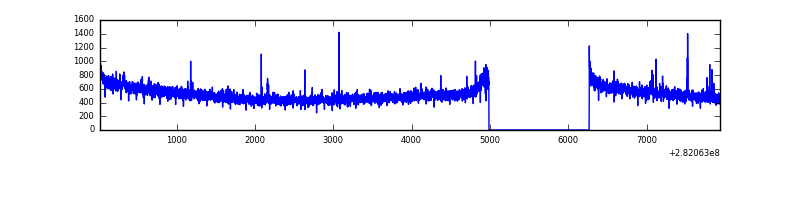 |
| C | 7916 | 6636 | 0 | 0 | 0.00% | 0.00% | 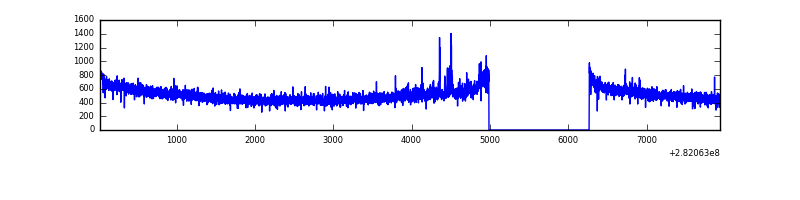 |
| D | 7915 | 6636 | 397 | 397 | 5.02% | 5.98% | 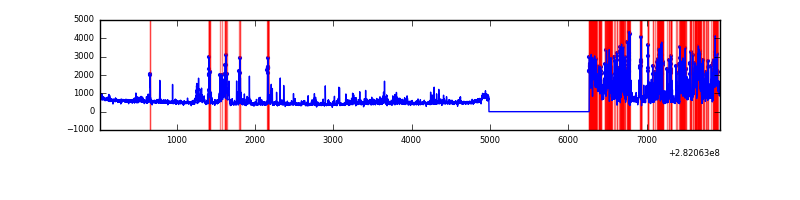 |
Top three noisy pixels from each quadrant. If the there are fewer than three noisy pixels in the level2.evt file, extra rows are filled as -1
| Pixel properties | Quadrant properties | ||||||
|---|---|---|---|---|---|---|---|
| Quadrant | DetID | PixID | Counts | Sigma | Mean | Median | Sigma |
| A | 4 | 2 | 120732 | 685.12 | 879 | 865 | 175.0 |
| A | 0 | 226 | 7853 | 39.94 | 879 | 865 | 175.0 |
| A | 12 | 194 | 6240 | 30.72 | 879 | 865 | 175.0 |
| B | 15 | 19 | 19468 | 113.51 | 875 | 857 | 164.0 |
| B | 12 | 111 | 19219 | 111.99 | 875 | 857 | 164.0 |
| B | 11 | 111 | 16648 | 96.31 | 875 | 857 | 164.0 |
| C | 14 | 238 | 129358 | 681.17 | 818 | 823 | 188.7 |
| C | 0 | 79 | 51335 | 267.69 | 818 | 823 | 188.7 |
| C | 3 | 233 | 26257 | 134.79 | 818 | 823 | 188.7 |
| D | 13 | 232 | 1261998 | 6497.82 | 809 | 789 | 194.1 |
| D | 11 | 176 | 421842 | 2169.29 | 809 | 789 | 194.1 |
| D | 10 | 70 | 269126 | 1382.49 | 809 | 789 | 194.1 |
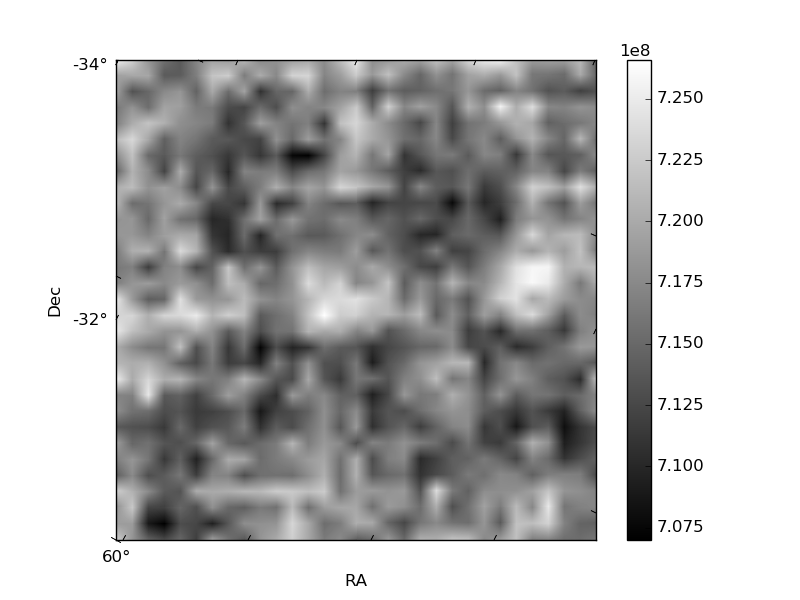
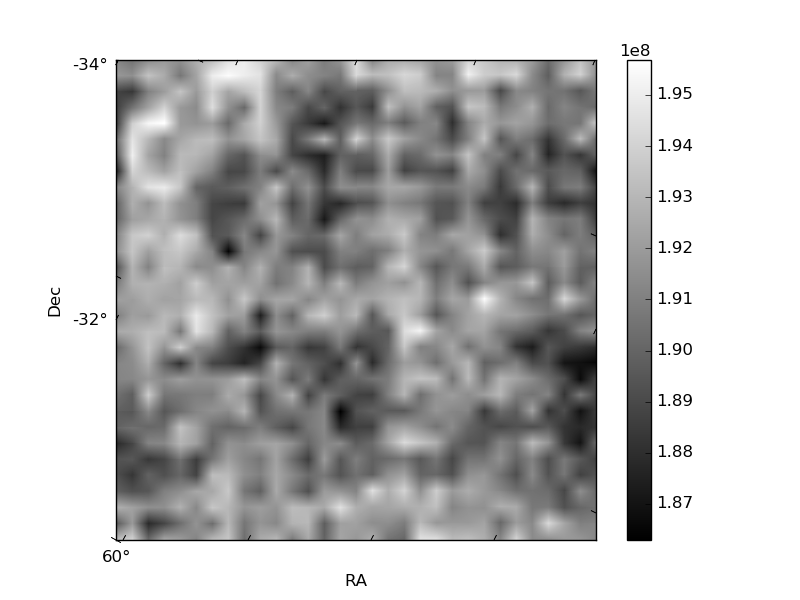
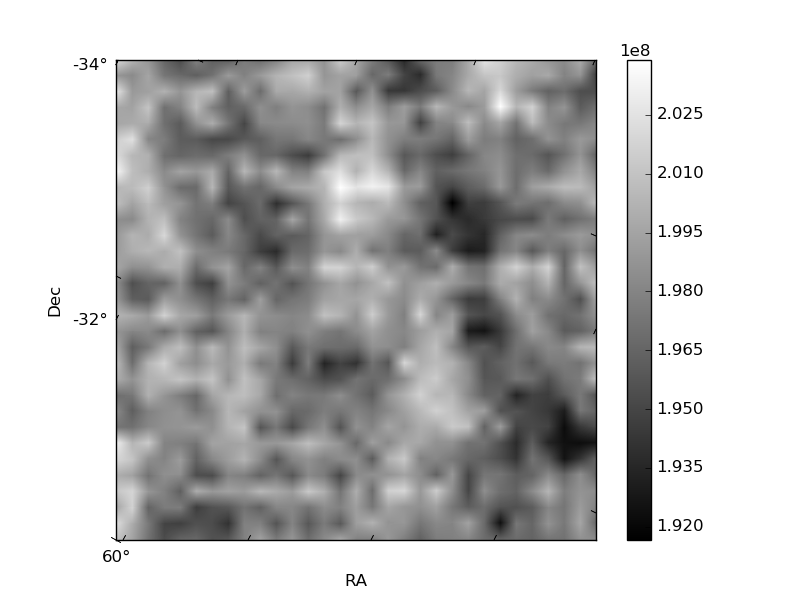
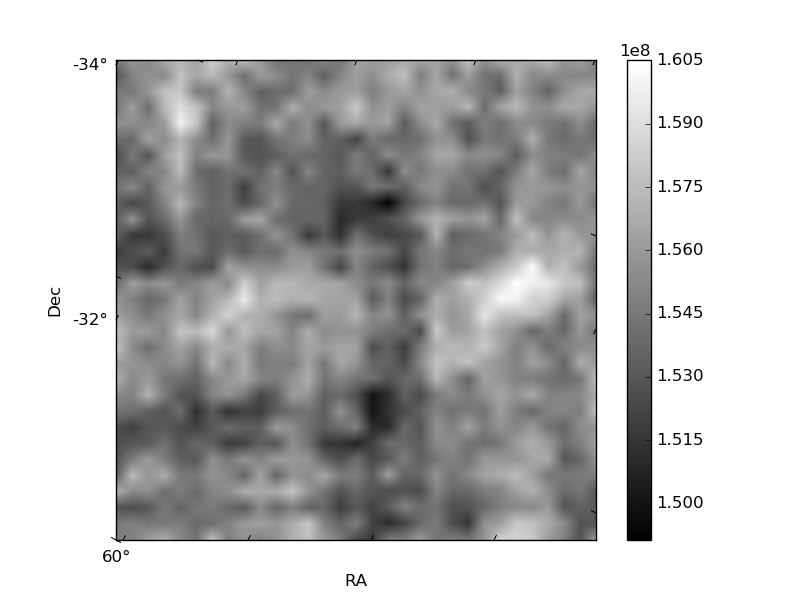
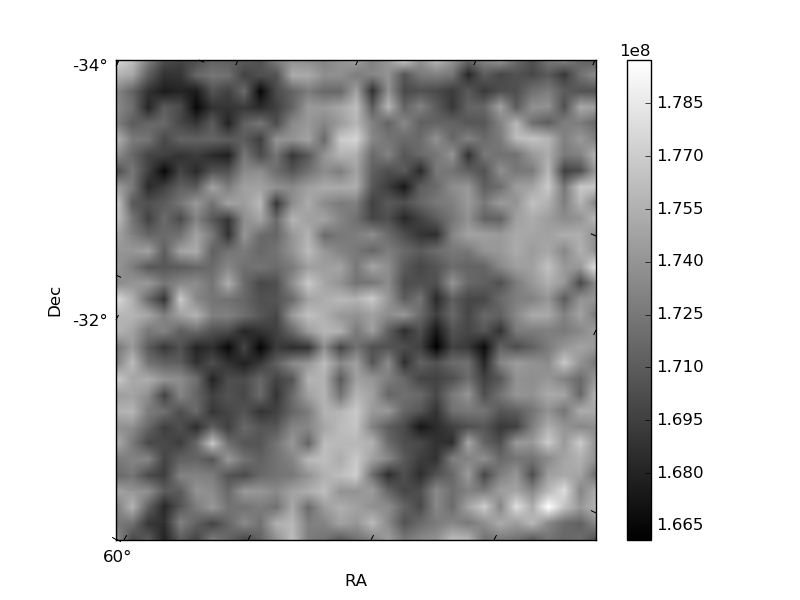
Histogram calculated using DETX and DETY for each event in the final _common_clean file
| Quadrant A | 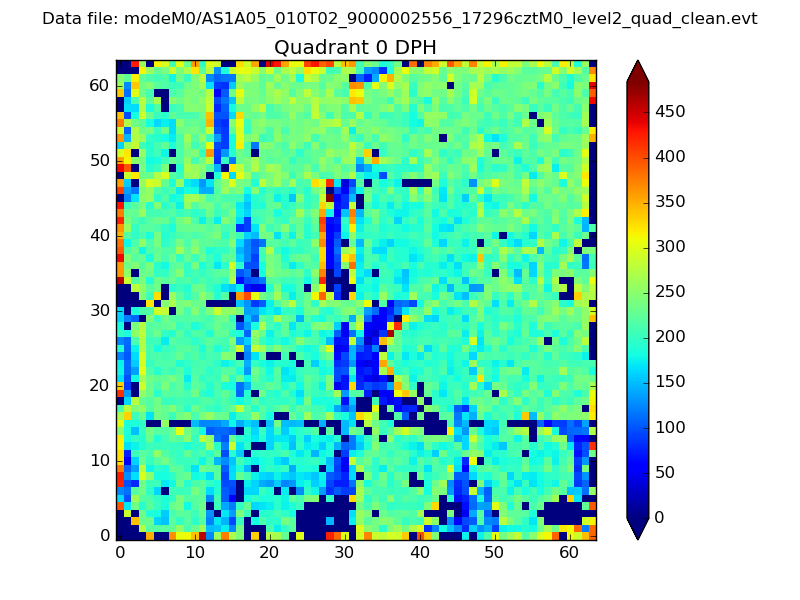 |
 |
Quadrant B |
|---|---|---|---|
| Quadrant D | 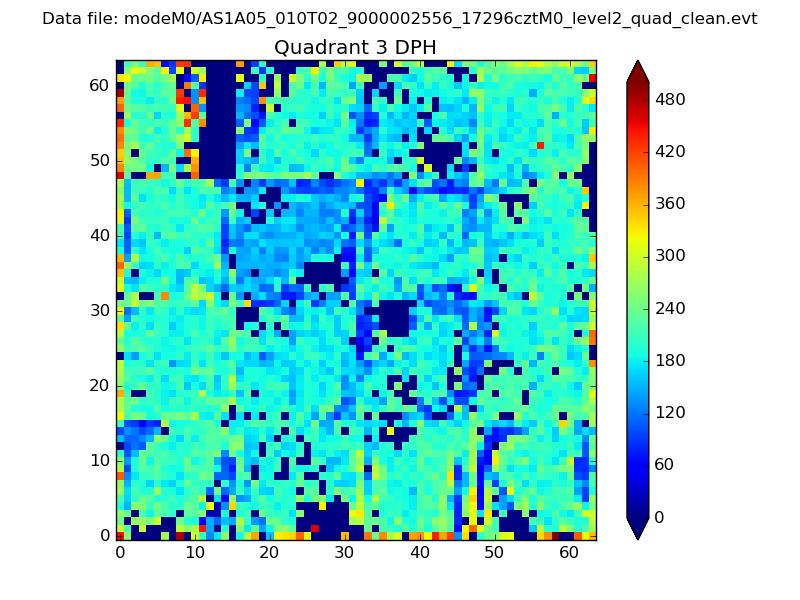 |
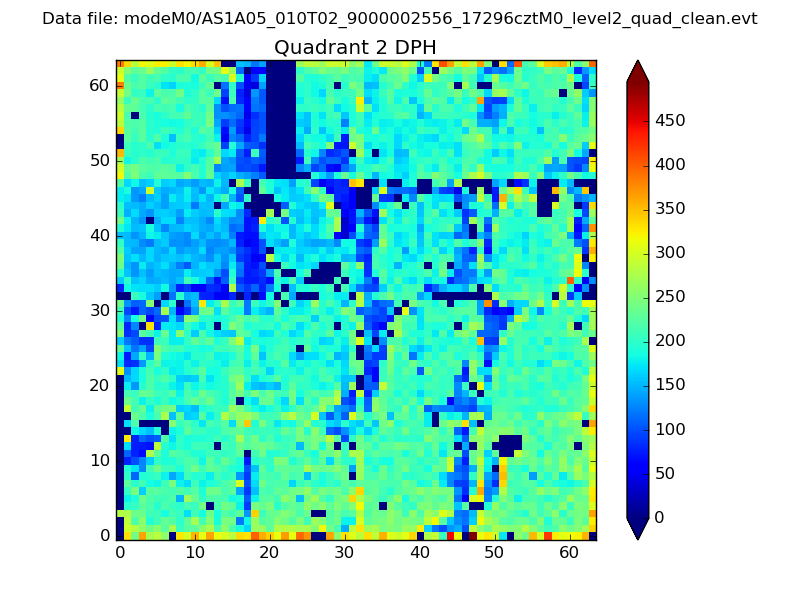 |
Quadrant C |
| Plot type | Count rate plots | Images |
|---|---|---|
| Comparison with Poisson distribution Blue bars denote a histogram of data divided into 1 sec bins. Red curve is a Poisson curve with rate = median count rate of data. |
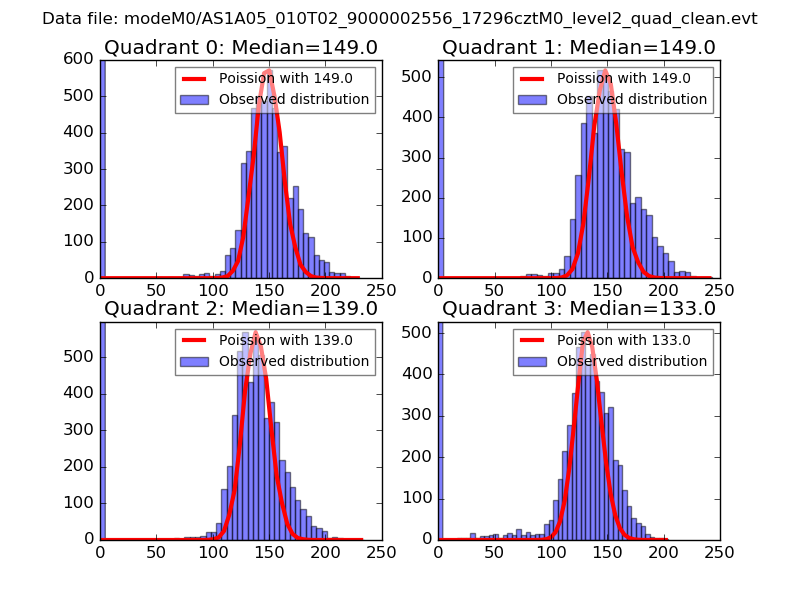 |
 |
| Quadrant-wise count rates Data is divided into 100 sec bins |
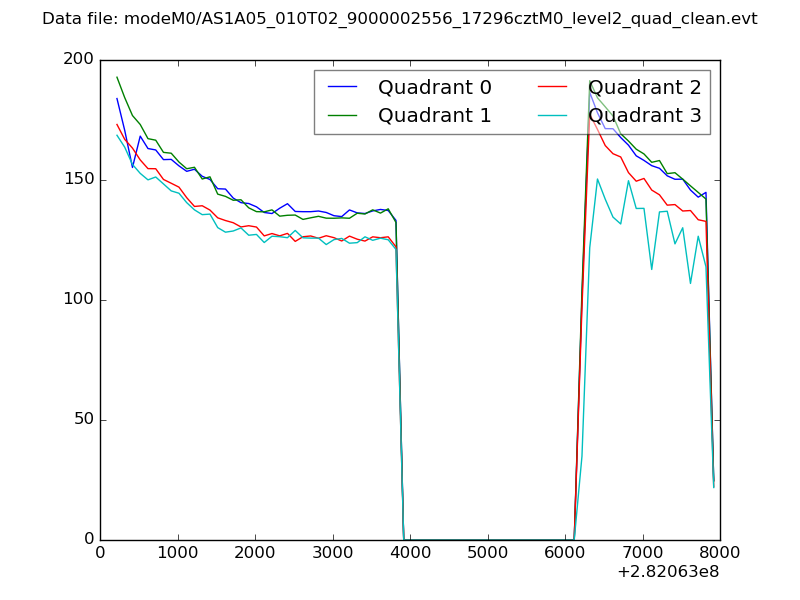 |
|
| Module-wise count rates for Quadrant A Data is divided into 100 sec bins |
 |
 |
| Module-wise count rates for Quadrant B Data is divided into 100 sec bins |
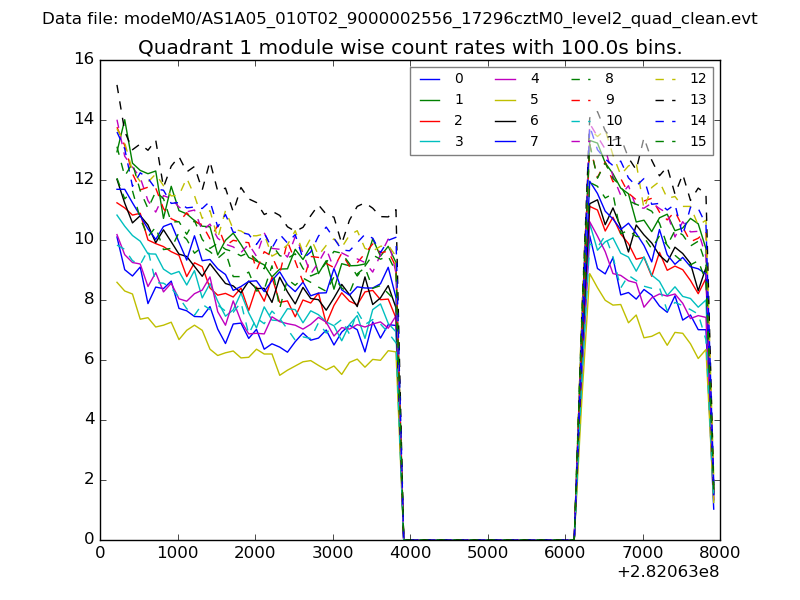 |
 |
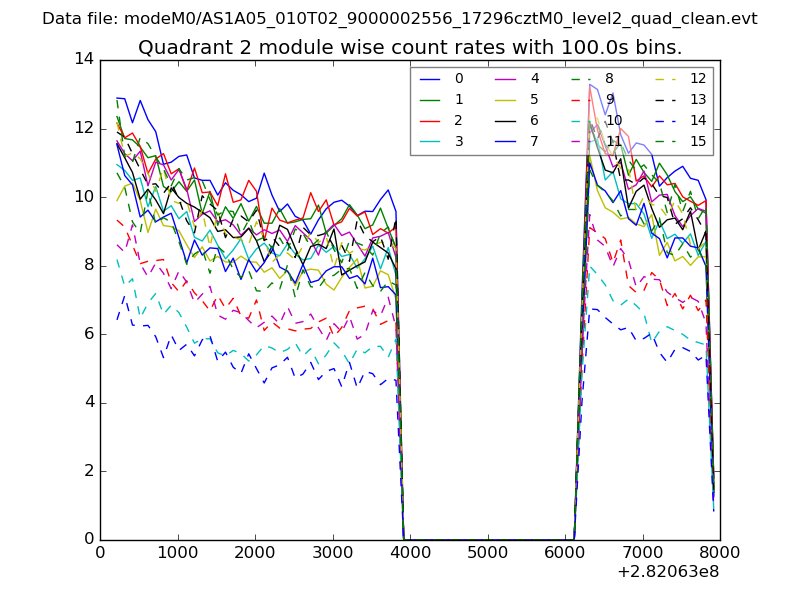
| Module-wise count rates for Quadrant C Data is divided into 100 sec bins |
 |
 |
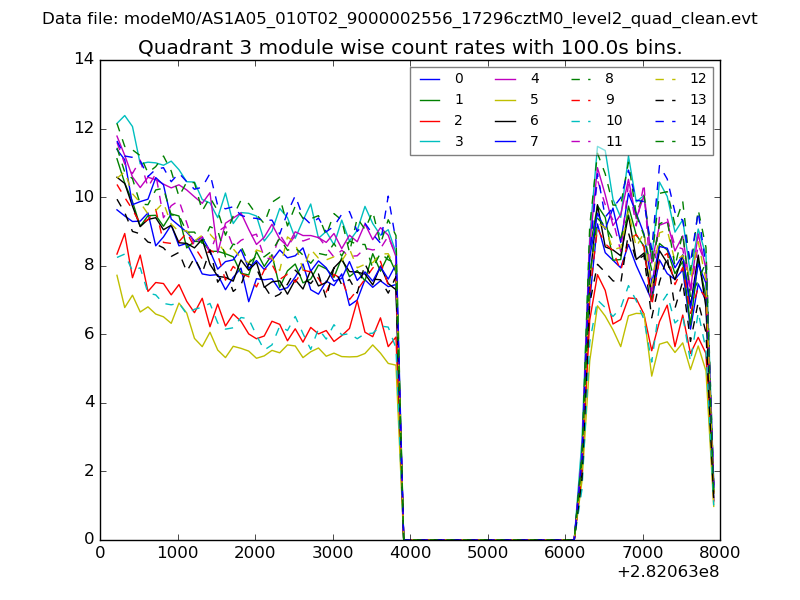
| Module-wise count rates for Quadrant D Data is divided into 100 sec bins |
 |
 |
| Parameter | Plot |
|---|---|
| CZT HV Monitor |  |
| D_VDD | 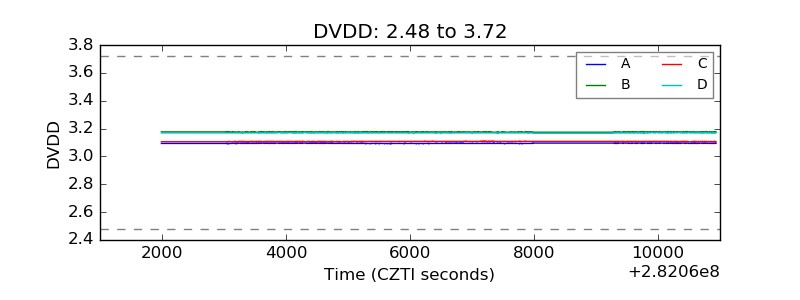 |
| Temperature 1 | 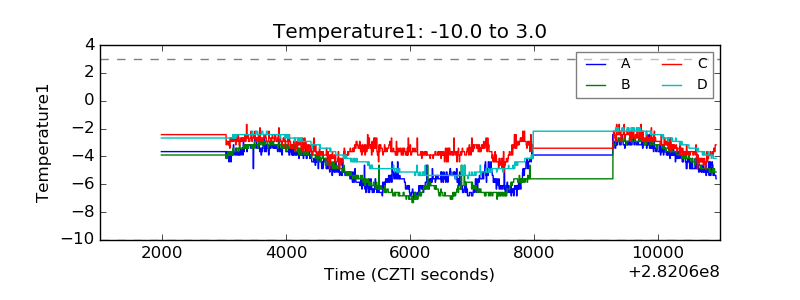 |
| Veto HV Monitor | 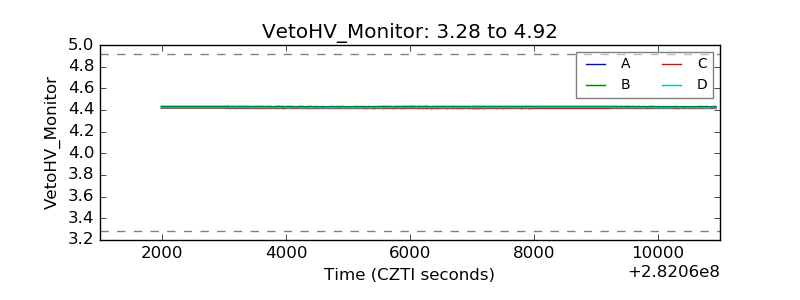 |
| Veto LLD | 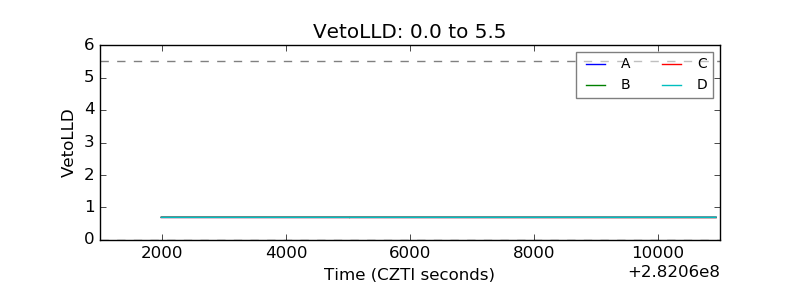 |
| Alpha Counter |  |
| _CPM_Rate | 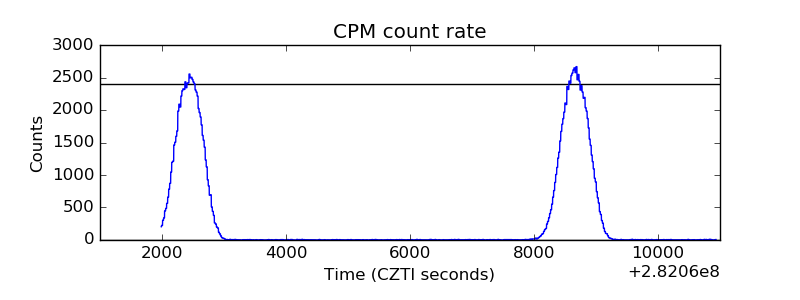 |
| CZT Counter | 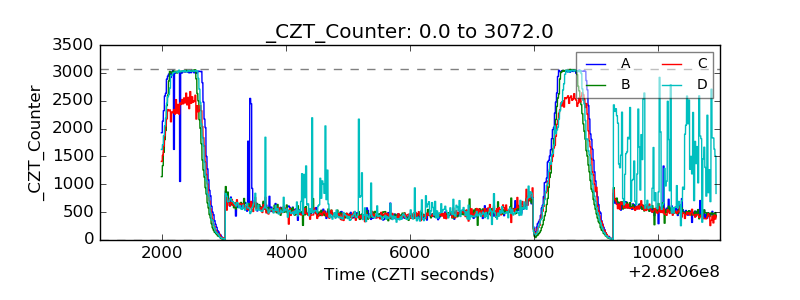 |
| +2.5 Volts monitor |  |
| +5 Volts monitor | 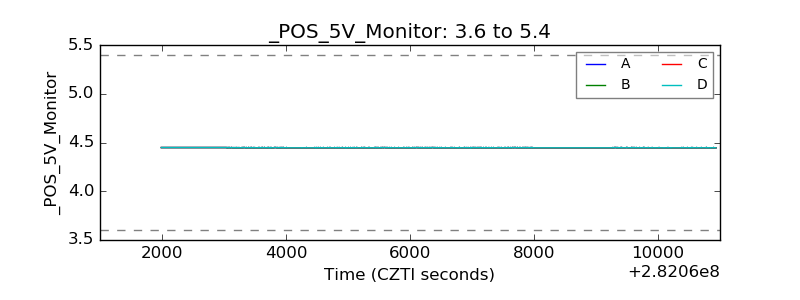 |
| _ROLL_ROT | 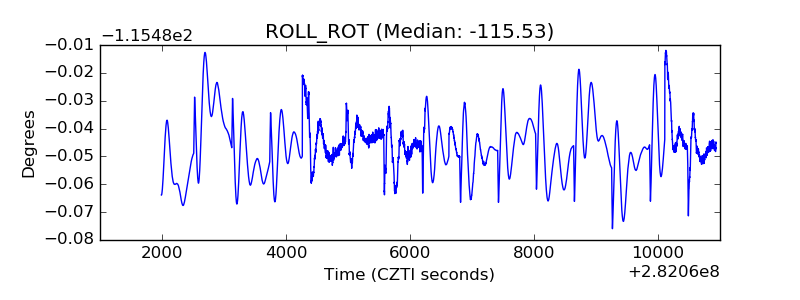 |
| _Roll_DEC | 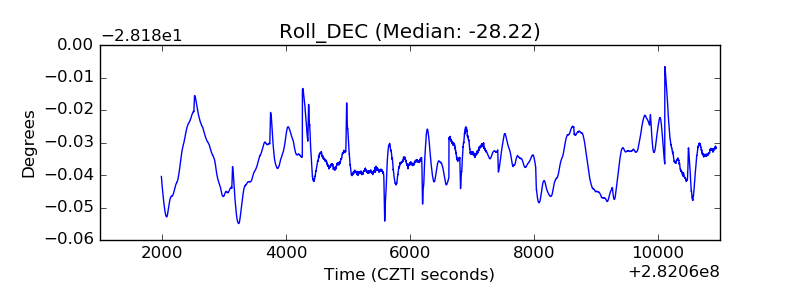 |
| _Roll_RA | 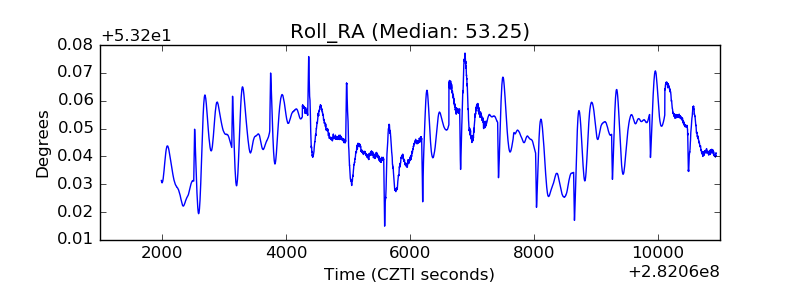 |
| Veto Counter | 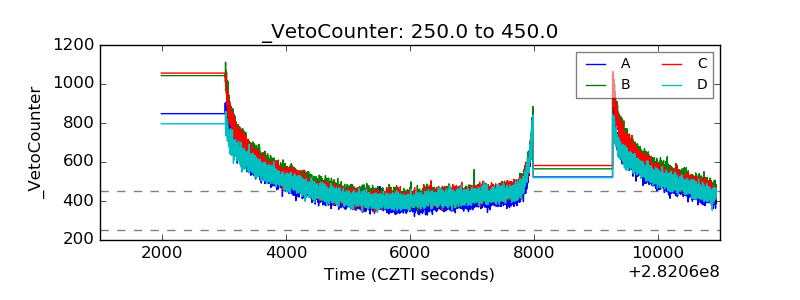 |